Copyright
©The Author(s) 2025.
World J Clin Pediatr. Dec 9, 2025; 14(4): 105820
Published online Dec 9, 2025. doi: 10.5409/wjcp.v14.i4.105820
Published online Dec 9, 2025. doi: 10.5409/wjcp.v14.i4.105820
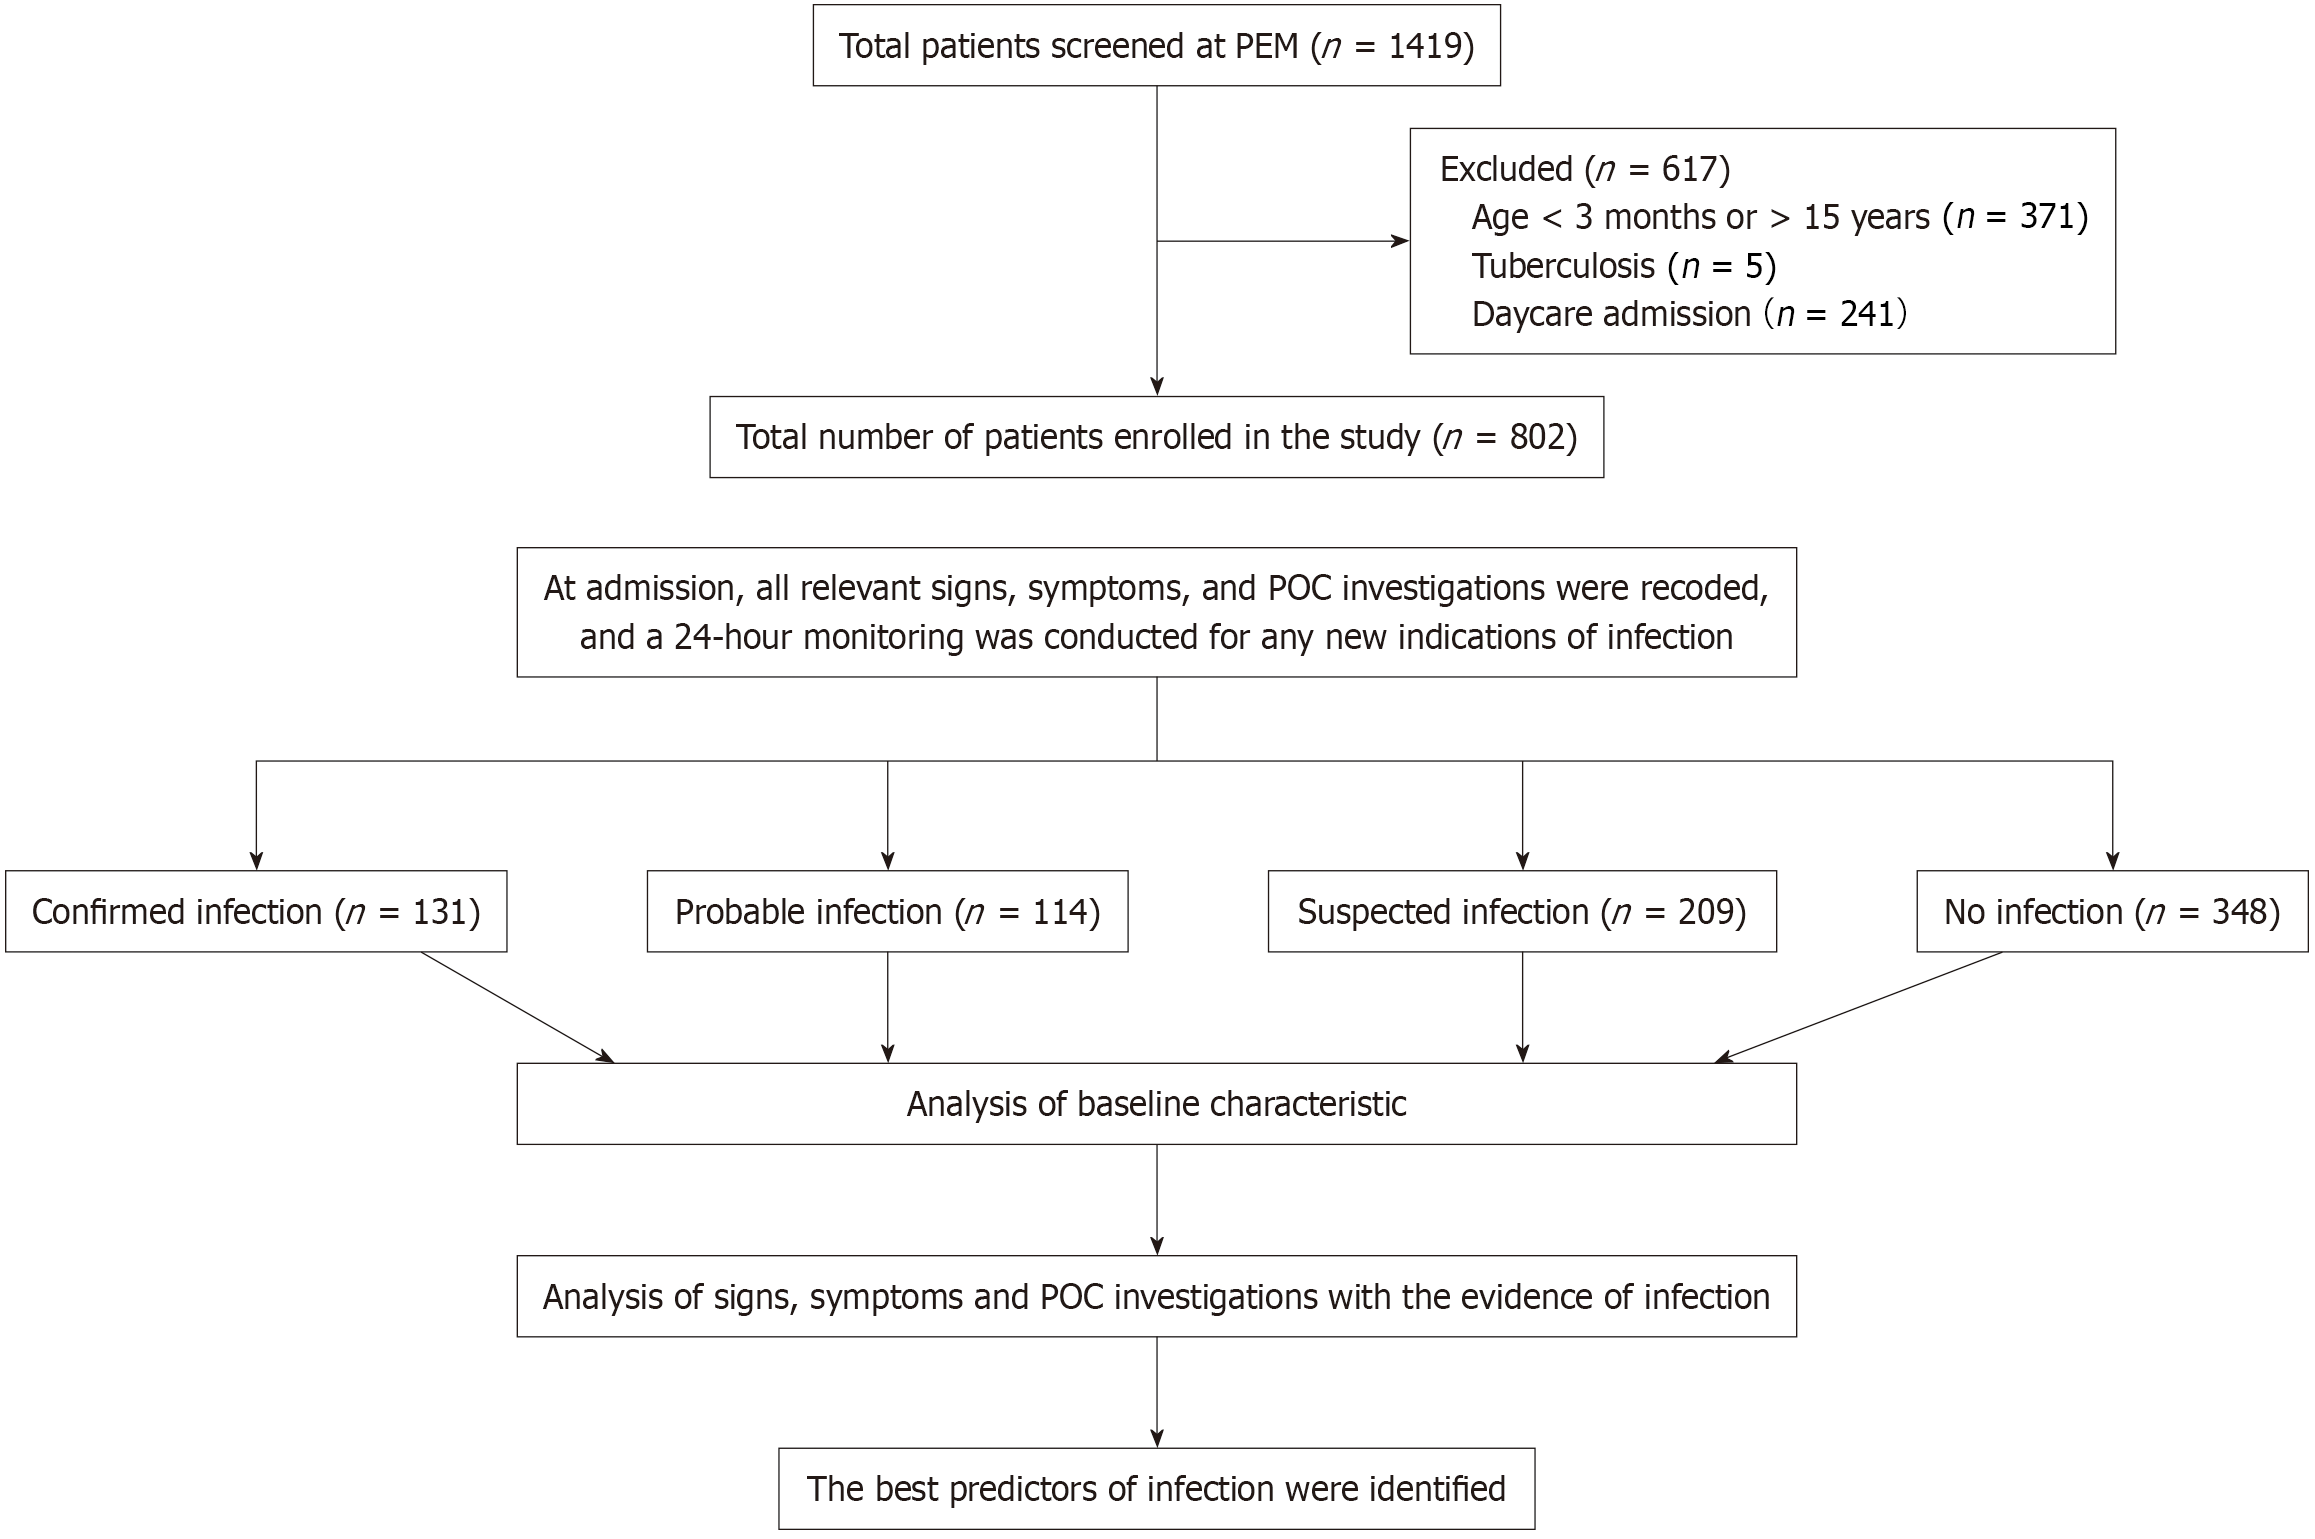
Figure 1 Flow chart.
PEM: Pediatric emergency medicine; POC: Point-of-care.
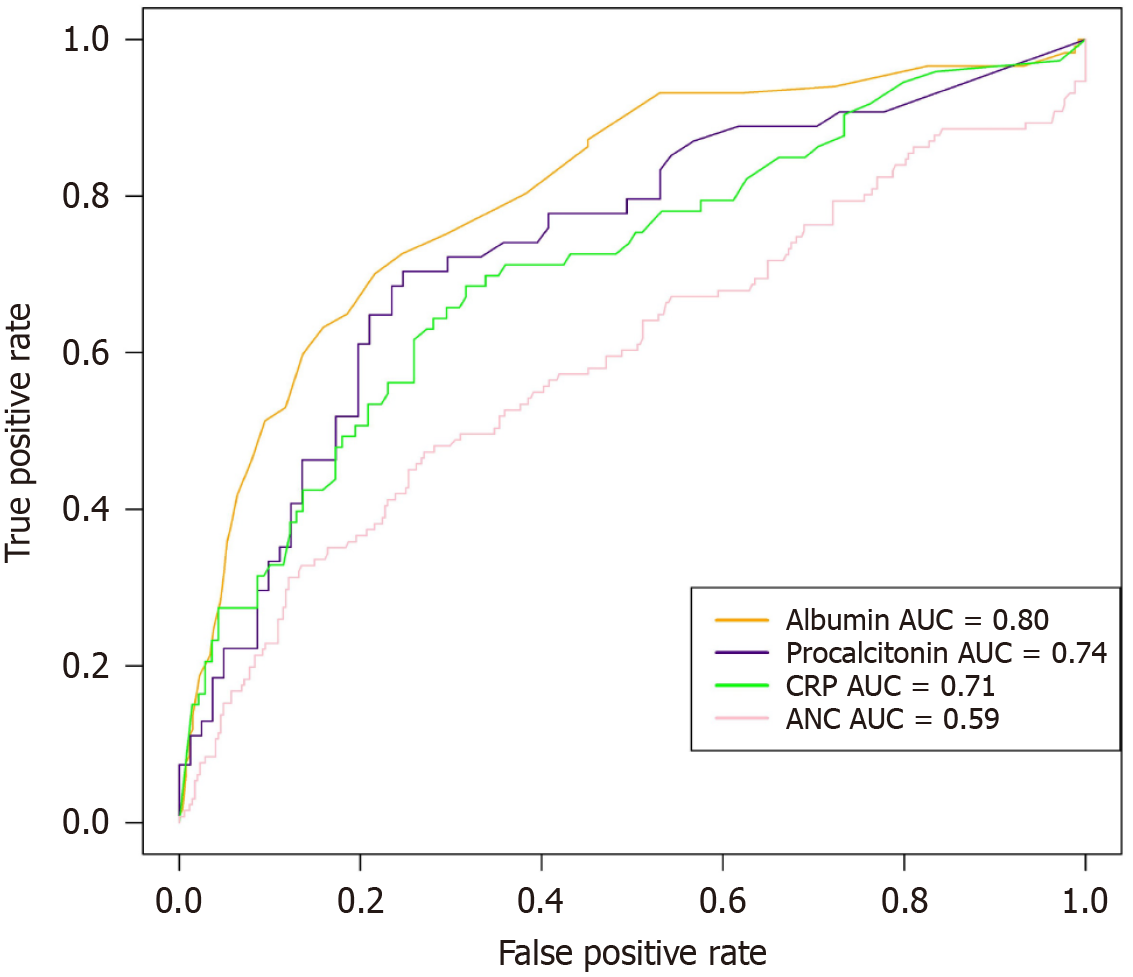
Figure 2 Receiver operating characteristic curve for serum albumin, procalcitonin, C-reactive protein and absolute neutrophil count for differentiating different outcome groups.
ANC: Absolute neutrophil count; AUC: Area under the curve; CRP: C-reactive protein.
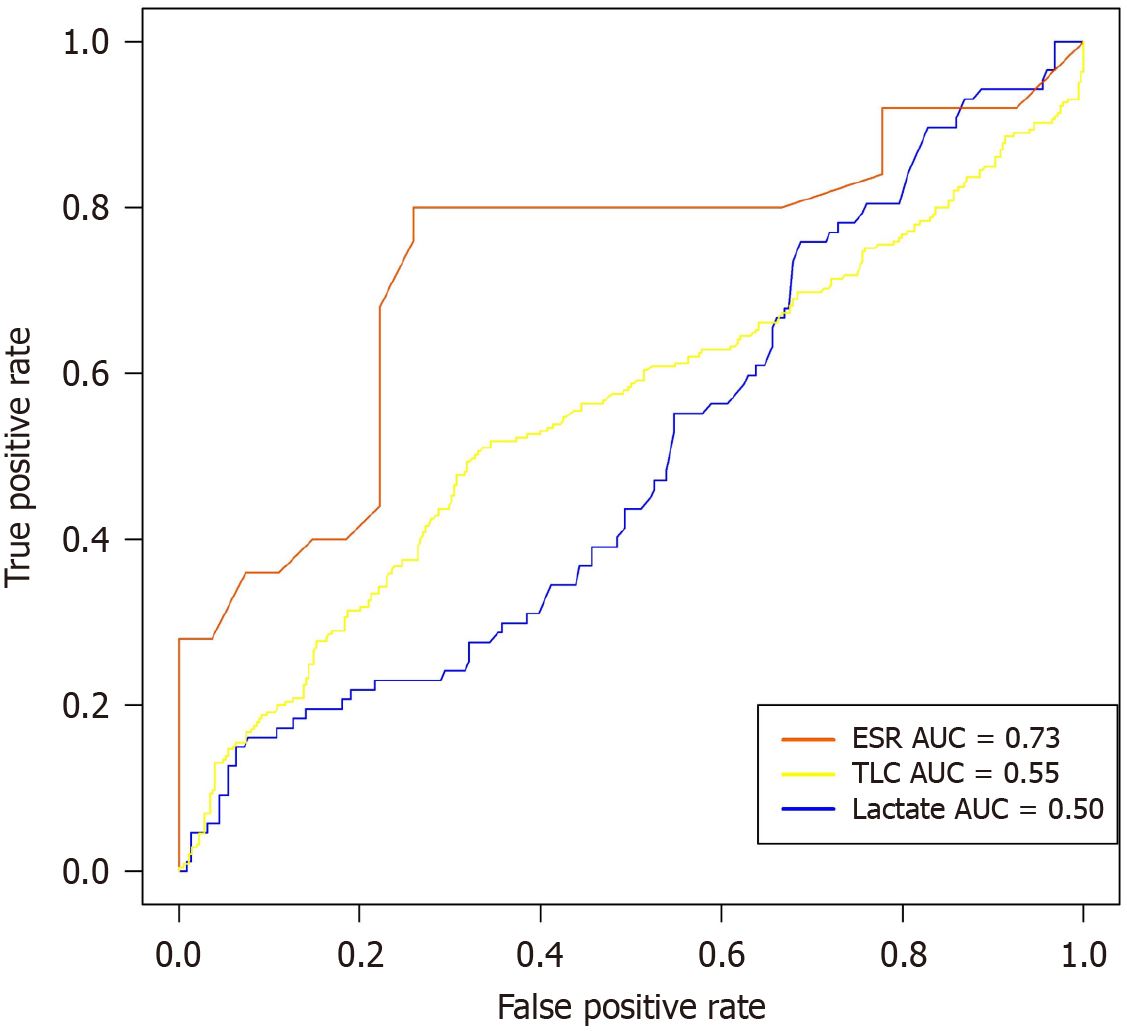
Figure 3 Receiver operating characteristic curve for total leukocyte count, lactate, and erythrocyte sedimentation rate for differentiating different outcome groups.
AUC: Area under the curve; ESR: Erythrocyte sedimentation rate; TLC: Total leukocyte count.
- Citation: Yusuf S, Goel AK, Khobragade AW, Das P, Manoj GSV, Saha AK, Reddy SP, Keshri S, Shah S. Determinants of infection for antibiotic initiation at pediatric emergency admission: A prospective observational study. World J Clin Pediatr 2025; 14(4): 105820
- URL: https://www.wjgnet.com/2219-2808/full/v14/i4/105820.htm
- DOI: https://dx.doi.org/10.5409/wjcp.v14.i4.105820


