Copyright
©The Author(s) 2025.
World J Orthop. Mar 18, 2025; 16(3): 102520
Published online Mar 18, 2025. doi: 10.5312/wjo.v16.i3.102520
Published online Mar 18, 2025. doi: 10.5312/wjo.v16.i3.102520
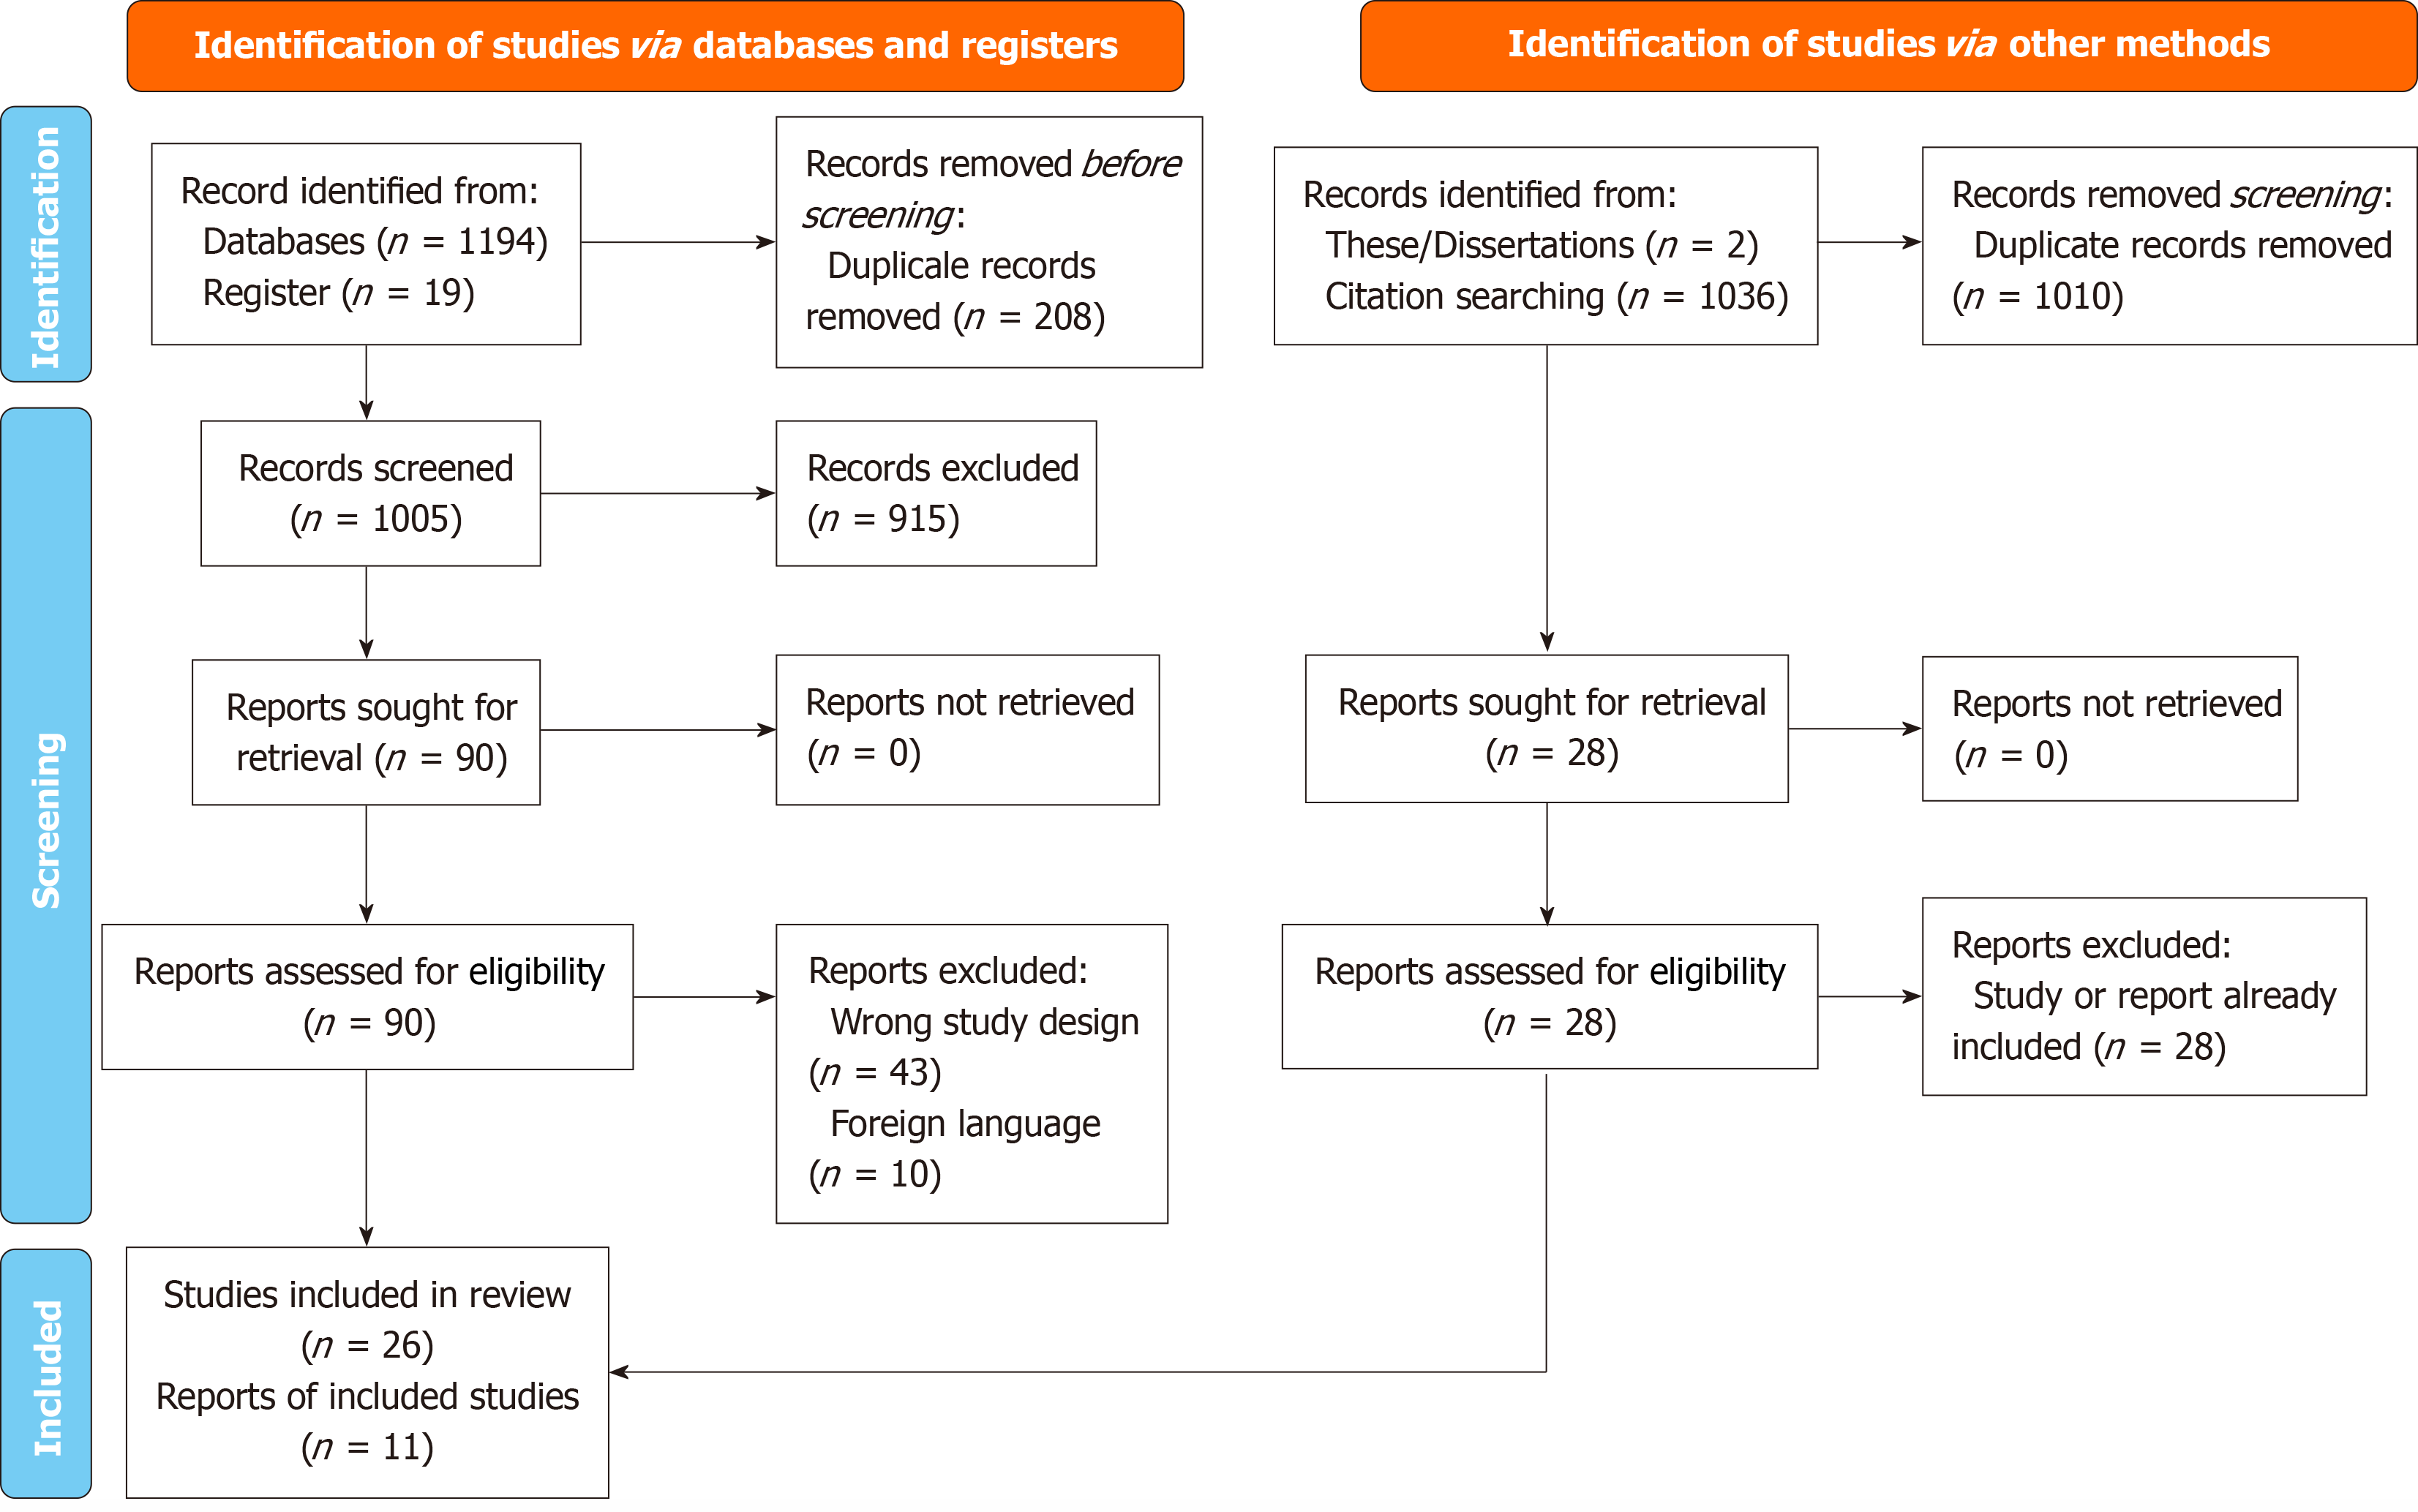
Figure 1 PRISMA 2020 flow diagram for new systematic reviews which included searches of databases, registers, and other sources.
Figure 2 Random-effects model.
A: Calculation of clinical benefit rates with denosumab therapy; B: Sensitivity analysis by methodological design of studies that evaluated clinical benefit; C: Subgroup analysis (number of doses) of studies that evaluated clinical benefit; D: Calculation of local recurrence rates with denosumab therapy; E: Sensitivity analysis by methodological design of studies that evaluated local recurrence; F: Subgroup analysis (number of doses) of studies that evaluated local recurrence; G: Calculation of imaging response rates with denosumab therapy; H: Sensitivity analysis by methodological design of studies that evaluated imaging response; I: Subgroup analysis(number of doses) of studies that evaluated imaging response.
- Citation: Barreto BG, Santili C, Guedes A, Moreira FD, Paz CLD. Denosumab regimens in the treatment of giant cell tumor of bone: A systematic review with meta-analysis. World J Orthop 2025; 16(3): 102520
- URL: https://www.wjgnet.com/2218-5836/full/v16/i3/102520.htm
- DOI: https://dx.doi.org/10.5312/wjo.v16.i3.102520


