


Published online Apr 24, 2026. doi: 10.5306/wjco.v17.i4.115851
Revised: December 10, 2025
Accepted: February 6, 2026
Published online: April 24, 2026
Processing time: 176 Days and 15.3 Hours
Patient-specific quality assurance (QA) is an essential component in the safe and precise delivery of radiotherapy, particularly in head and neck cancer cases where anatomical complexity and proximity to critical structures increase the risk of delivery deviations. As treatment techniques become more conformal and modu
To assess patient-specific QA performance, dosimetric accuracy, and long-term consistency using gamma analysis with statistical process control methods.
A retrospective analysis of intensity-modulated radiation therapy and volumetric modulated arc therapy head and neck treatment plans was performed using electronic portal imaging device-based gamma pass rates under global criteria. Individual and Moving Range charts were generated to assess QA stability and detect trends. Initial control limits were derived from 20 QA plans and validated on 350 QA plans. Tolerance limits (TL) and action limits (AL) were calculated. The resulting charts offered a robust framework for monitoring QA performance and identifying deviations.
The central line values decreased progressively with stricter gamma criteria, from 98.835% (3%/3 mm) to 94.4% (2%/2 mm). TL and AL narrowed correspondingly, with TL dropping from 97.869% to 93.672%. Exponentially Weighted Moving Average charts provided smoother detection of persistent small deviations compared to Individual and Moving Range charts, enhancing sensitivity. Across all criteria, QA processes remained statistically stable, although tighter thresholds reduced pass rates.
Gamma analysis is a reliable method for patient-specific QA in head and neck radiotherapy. The incorporation of statistical process control adds a valuable layer of continuous monitoring, supports site-specific tolerance/AL, and strengthens treatment accuracy.
Core Tip: This study shows that using gamma index-based patient-specific quality assurance, along with statistical process control, works well for head and neck radiotherapy. Long-term trends in dose delivery accuracy were tracked using Individual-Moving Range and Exponentially Weighted Moving Average charts, based on several global gamma index criteria. Even though stricter thresholds made it harder to pass, the quality assurance process stayed statistically stable, and statistical process control made it easier to find small differences sooner. This method helps make tolerance and action limits more reliable and makes treatment delivery more consistent overall.
- Citation: Singh P, Singh MK, Mishra A. Use of statistical process control to study the patient-specific quality assurance in head and neck cancer. World J Clin Oncol 2026; 17(4): 115851
- URL: https://www.wjgnet.com/2218-4333/full/v17/i4/115851.htm
- DOI: https://dx.doi.org/10.5306/wjco.v17.i4.115851
Treatment of cancer stands mainly on three pillars: Surgery, chemotherapy, and radiotherapy. Out of these three, radiotherapy alone or in combination with others is used in about 2/3 of cancer treatment cases[1]. Radiotherapy is further classified based on the site of the cancer, the intent of treatment, the technique used in treatment, etc. Head and neck cancer, in particular, accounts for 30% of all cancer cases, which include malignancies originating in the oral cavity, pharynx, larynx, sinuses, and salivary glands[1]. These cancers account for a substantial global disease burden, with an estimated 945000 new cases and over 500000 deaths worldwide in 2022, according to the latest GLOBOCAN statistics[2]. The complex anatomy of the head and neck region, coupled with the proximity of critical structures such as the spinal cord, brainstem, and salivary glands, presents significant challenges in delivering high-dose radiation safely and effectively. Consequently, high-precision radiotherapy techniques - such as intensity-modulated radiation therapy (IMRT) and volumetric modulated arc therapy (VMAT) - have become the standard of care[3,4]. These techniques allow for highly conformal dose distributions that maximize tumor coverage while sparing normal tissues. However, this increased complexity in treatment planning and delivery also heightens the risk of deviations, making robust quality assurance (QA) systems essential to ensure patient safety and treatment accuracy[5].
One of the cornerstone practices in radiotherapy QA is patient-specific quality assurance (PSQA). PSQA involves verifying, prior to treatment, that the planned dose distribution calculated by the treatment planning system can be accurately delivered by the linear accelerator. This verification is typically achieved using phantom-based measurements, including ion chamber readings for point dose validation and detector arrays or film for planar dose distribution checks, often assessed via gamma analysis[6]. In head and neck cancer cases, which frequently require multiple dose levels, complex beam modulation, and sharp dose gradients, the role of PSQA is especially critical. Any undetected discrepancies between planned and delivered doses could result in suboptimal tumor control or unintentional toxicity to organs at risk.
The increasing sophistication of radiotherapy techniques has resulted in vast amounts of QA data being generated routinely in clinical practice. Despite this, many institutions continue to rely on static, binary evaluation methods, such as the pass/fail interpretation of gamma analysis (e.g., 3%/3 mm with a 95% pass threshold). While useful for immediate plan verification, such methods do not capture evolving trends in system performance or subtle deviations from baseline that might signal the onset of errors[7]. These limitations are particularly concerning in the treatment of head and neck cancers, where small dosimetric inaccuracies may lead to disproportionately large clinical consequences due to the narrow therapeutic window and the sensitivity of adjacent critical structures[8].
A further challenge lies in process variability, which can originate from multiple sources: Inter-planner variability in contouring and plan optimization, differences in machine calibration and performance, anatomical changes in the patient over the treatment course (e.g., tumor shrinkage or weight loss), and environmental conditions affecting equipment sensitivity[9]. Without continuous monitoring of QA outcomes over time, such variability can accumulate unnoticed, potentially compromising long-term treatment quality. Therefore, a data-driven, longitudinal approach to QA is increasingly advocated in the field of medical physics.
In this context, statistical process control (SPC) offers a powerful toolset for enhancing QA practices through ongoing process monitoring and analysis. Originally developed for industrial quality control by Shewhart in the 1920s[10], SPC involves statistical techniques that assess the stability, predictability, and capability of a process. By plotting QA metrics over time using control charts - such as individual (I) charts, moving range (MR) charts, X-bar charts, and range (R) charts - SPC enables practitioners to detect shifts, trends, or cycles in process behavior that might not be apparent through standard pass/fail metrics[10]. This transition from a static to a dynamic QA framework represents a paradigm shift, moving QA from a reactive activity to a preventive and predictive discipline.
The utility of SPC in radiotherapy is increasingly recognized, with several studies demonstrating its effectiveness in monitoring machine output constancy, patient setup reproducibility, and PSQA metrics[11,12]. When applied to PSQA data in head and neck cancer radiotherapy, SPC can highlight out-of-control points that may indicate systematic errors, identify changes in system performance over time, and support evidence-based interventions. SPC also facilitates the establishment of institution-specific control limits based on actual process performance rather than arbitrary thresholds, offering a more realistic and individualized assessment of quality[13]. Furthermore, SPC supports process capability analysis, which evaluates whether a process consistently operates within defined specifications. By quantifying the variability of PSQA outcomes, SPC helps medical physicists determine whether their QA processes are not only in control but also capable of meeting clinical requirements consistently[14].
In light of these considerations, this study aims to investigate the application of SPC to PSQA data in head and neck radiotherapy. By analyzing QA outcomes across a series of patient plans and evaluating their process behaviour using SPC charts, we seek to determine the feasibility and value of integrating SPC into routine QA workflows. Specifically, this study will assess whether SPC can reliably detect outliers, identify trends, and enhance the interpretability of QA results beyond conventional binary evaluations. The overarching goal is to establish a framework that supports proactive quality management, ensuring that patients undergoing complex head and neck radiotherapy receive treatment with the highest possible level of safety and precision.
This retrospective study included a cohort of 350 patients diagnosed with head and neck cancer who underwent radiotherapy. All patients received radical or adjuvant radiotherapy using IMRT or VMAT techniques. Inclusion criteria were histopathologically confirmed squamous cell carcinoma, availability of complete PSQA data, and treatment delivered on a single linear accelerator.
Treatment plans were generated using the Eclipse treatment planning system (Varian Medical Systems, Palo Alto, CA, United States) version 17.0.1, with 6 MV photon beams. Dose prescriptions ranged from 60 Gy to 70 Gy in 30-35 fractions, depending on tumor stage and treatment intent. Plans were optimized with inverse planning anisotropic analytical algorithm dose calculation algorithm, and a 2.5 mm normal grid size. Before treatment, all plans underwent PSQA using a verification plan created using the portal dose image prediction module in the Eclipse treatment planning system. Verification plans replicated patient geometry using an electronic portal imaging device (EPID) for dose delivery comparison.
An aSi1000 EPID (Varian Medical Systems, Palo Alto, CA, United States) integrated on a linear accelerator (Unique Performance; Varian Medical Systems, Palo Alto, CA, United States) was used for pre-treatment dosimetric verification. The EPID images were acquired in cine mode and analyzed using the portal dosimetry algorithm. Gamma analysis was applied using global normalization at 3% dose difference and a 3 mm distance to agree with a 95% passing criterion. The EPID used in this study was the aS1000 system integrated with the Varian Unique Performance™ linear accelerator (Varian Medical Systems, Palo Alto, CA, United States). This EPID is an amorphous silicon flat panel detector with a gadolinium oxysulfide (Gd2O2S: Tb) scintillator, designed primarily for portal imaging and dosimetric verification. It features a pixel matrix of 1024 × 768 with a pixel pitch of 0.392 mm, resulting in an active imaging area of approximately 40 cm × 30 cm at a standard source-to-imager distance of 100 cm[15]. The EPID operates in both integrated and cine acquisition modes, offering a maximum frame rate of 10 frames per second in cine mode, and produces 16-bit grayscale images suitable for high-resolution analysis. Routine dark field and flood field calibrations were performed to ensure dosimetric accuracy. The system was employed for pre-treatment PSQA, with acquired EPID images analyzed using gamma evaluation criteria. In this study, global gamma analysis was used, according to the guidelines set forth by the American Association of Physicists in Medicine (AAPM) Task Group (TG) 218, where the dose difference is normalized to the maximum dose in the reference plan. This approach ensures consistency in evaluating clinically relevant regions of the dose distribution, especially when comparing high-gradient areas in complex head and neck treatment plans. Multiple global gamma criteria were assessed to evaluate the robustness of PSQA and the capability of the EPID-based system to resolve spatial and dosimetric discrepancies. The 3%/3 mm criterion was used as the clinical baseline, as it represents a standard threshold suitable for most IMRT and VMAT plans. The 3%/2 mm and 2%/3 mm criteria were employed to test spatial and dosimetric stringency independently. While the 2%/2 mm criterion was used for the most rigorous verification, typically applied in high-precision treatments such as stereotactic radiosurgery or treatments involving critical structures with steep dose gradients.
I-MR charts: The I-MR chart is a statistical quality control tool that monitors individual measurements and the variability between successive observations within a process. In patient-specific radiotherapy QA, it is used to track gamma passing index values for each treatment plan. The I chart visually represents each measurement, allowing detection of sudden shifts, large deviations, or outlying values that may indicate errors in treatment delivery or planning. The MR chart complements this by illustrating the variability or fluctuations between consecutive measurements, thus revealing instability or increased process noise. According to AAPM TG-218, employing I-MR charts allows the establishment of data-driven control limits, improving objectivity compared to arbitrary thresholds traditionally used in QA[16]. This method supports prompt identification of significant deviations, with universal recommended gamma passing criteria generally set at a tolerance limit of 95% and an action limit of 90% for 3%/2 mm analysis criteria.
Exponentially Weighted Moving Average charts: The Exponentially Weighted Moving Average (EWMA) chart is a sensitive statistical monitoring approach designed to detect small, gradual shifts in process performance by weighting recent observations more heavily than earlier ones. This weighting provides a “memory” effect, smoothing random fluctuations and emphasizing persistent trends over time. In radiotherapy PSQA, the EWMA chart tracks the gamma passing index across multiple treatment plans, enabling early identification of subtle and continuous drifts, such as those caused by slow machine calibration changes or systematic workflow issues. AAPM TG-218[16] endorses the use of EWMA charts as a complement to conventional control charts because of their superior sensitivity to small deviations that could precede notable clinical impact. The same universal tolerance and action limits apply, but EWMA charts improve the capacity for proactive intervention by highlighting deteriorations before they exceed established thresholds. This approach encourages a culture of continuous quality improvement and ensures high standards in dose delivery accuracy and patient safety.
Action limits and tolerance limits:
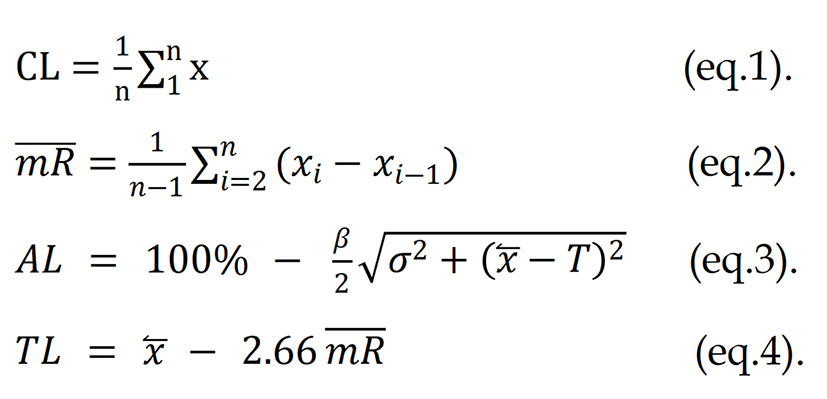
Raj et al[16] mentioned the above equations, where x stands for an individual gamma pass rate per cent. The calculation requires the following parameters: Central line, MR, variance (σ), where x̅ is the mean percent GP, and T can be considered a 100% (since the maximum percent GP is 100%). Eq. (1-4) β is a constant and its value can be 6 as per AAPM TG 218[16].
To establish the baseline performance of the control charts, data from the first twenty patients were analyzed using an I-MR chart. The initial control limits will be established using the first 20 data points. If any data point exceeds the initial control limits, it will be considered an outlier and will be excluded from the dataset, as predetermined. The control limits will then be recalculated based on the revised data. This process of identification, elimination, and recalculation will be repeated iteratively until all remaining data points fall within the updated control limits, thereby ensuring that the final charts will represent a statistically stable process.
This initial step was used to define the tolerance and action limits for the monitored parameters. Subsequently, an EWMA chart was applied to detect any subtle shifts or gradual drifts in the process that might not be evident in the I-MR chart alone. Once these control limits were established, the methodology was extended to a larger dataset comprising 350 observations of head and neck cancer patients. This allowed for robust monitoring of process behavior over a broader clinical population, ensuring the reliability and stability of the established control limits.
The calculated tolerance limits (TL) and action limits (AL) demonstrated a progressive decrease with stricter gamma criteria, reflecting the reduced margin for variation in PSQA for head-and-neck plans. For the 3%/3 mm criterion, the TL was 97.8694%, and the AL was 96.4844%, both closely aligned with the lower control limit (LCL), indicating a highly stable process. With the 3%/2 mm criterion, the TL reduced to 96.3936% and the AL to 92.2299%, while the 2%/3 mm criterion yielded TL and AL values of 94.6803% and 86.7638%, respectively. The most stringent 2%/2 mm criterion showed the lowest TL (93.6712%) and AL (83.1989%), highlighting the increased sensitivity of these limits to deviations in plan delivery accuracy. SPC methods were implemented to monitor the parameters measured by the EPID dosimetry system for 6 MV photon beams. Initially, I-MR charts were employed to detect significant deviations, followed by EWMA charts to validate the observations. This sequential approach resulted in the generation of two complementary control charts for each parameter under investigation.
Each control chart included a blue center line representing the process mean, with red upper and LCLs/bounds. Data points within the control limits were displayed in blue, while those outside were marked in red, allowing for immediate visual identification of variations.
Control charts (I-MR and EWMA) were constructed for global gamma criteria, including 3%/3 mm, 3%/2 mm, 2%/3 mm, and 2%/2 mm. The corresponding I-MR charts are presented in Figures 1 and 2 for the EWMA charts corresponding to the first 20 patients. In contrast, Figures 3 and 4 show I-MR and EWMA charts for 350 patients, respectively, with global gamma 3%/3 mm, 3%/2 mm, 2%/3 mm, and 2%/2 mm criteria. The I-MR and EWMA control chart results for the head and neck site under various gamma criteria provide insight into the consistency and performance of PSQA processes. For the 3%/3 mm global gamma criterion, the I-chart shows a central line of 98.835% with an LCL of 97.869%. The MR is 1.187 with an average MR of 0.363. The EWMA chart for this criterion indicates a central line of 98.835%, with control limits ranging from 98.5131% (LCL) to 99.1569% upper control limit (UCL), reflecting excellent consistency and narrow variation in QA performance.


Under the stricter 3%/2 mm criterion, the central line decreases slightly to 97.415% on the I-chart, with an LCL of 96.393% and UCL of 98.437%. The MR is 1.255 with an average MR of 0.384. In the EWMA chart, the central line is 97.415%, with LCL and UCL values of 97.0744% and 97.7556%, respectively. This shows a tighter distribution, maintaining process control within a slightly lower but acceptable pass rate. For the 2%/3 mm gamma criterion, the central line on the I-chart is 95.59%, with LCL of 94.68% and UCL of 96.5%, with an MR of 1.545 and an average MR of 0.473. The EWMA chart for this setting shows a central line of 95.59%, with control limits ranging from 95.2867% to 95.8933%, indicating a controlled but reduced QA pass rate due to the stricter criterion. Lastly, at the most stringent 2%/2 mm level, the I-chart reflects a central line of 94.4% and an LCL of 93.672%, with UCL at 95.128%, with an MR of 0.894 and an average MR of 0.274. The EWMA chart presents a central line of 94.4%, with control limits from 94.1574% to 94.6426%, demonstrating stable process performance even at tight tolerances, although the pass rates are understandably lower (Table 1).
| Criteria | Individual charts | Moving-range charts | Exponentially Weighted Moving Average charts | Tolerance limit | Action limit | ||||||
| Upper control limit | Central line | Lower control limit | Upper control limit | Central line | Lower control limit | Upper control limit | Central line | Lower control limit | |||
| 3%, 3 mm | 99.801 | 98.835 | 97.869 | 1.187 | 0.363 | 0 | 99.1569 | 98.835 | 98.5131 | 97.8694 | 96.4844 |
| 3%, 2 mm | 98.437 | 97.415 | 96.393 | 1.255 | 0.384 | 0 | 97.7556 | 97.415 | 97.0744 | 96.3936 | 92.2299 |
| 2%, 3 mm | 96.5 | 95.59 | 94.68 | 1.118 | 0.342 | 0 | 95.8933 | 95.59 | 95.2867 | 94.6803 | 86.7638 |
| 2%, 2 mm | 95.128 | 94.4 | 93.672 | 0.894 | 0.274 | 0 | 94.6426 | 94.4 | 94.1574 | 93.6712 | 83.1989 |
PSQA was performed as a critical procedure for IMRT and RapidArc, particularly for the head and neck site, which presents significant challenges in planning and delivery. In this study, SPC techniques were applied to PSQA gamma passing rates across four global gamma criteria: 3%/3 mm, 3%/2 mm, 2%/3 mm, and 2%/2 mm. The analysis of control limits, TL, and AL derived from historical QA data demonstrated a clear trend: As gamma criteria became more stringent, both the central line and the LCLs decreased. For instance, the central line reduced from 98.835% (3%/3 mm) to 94.4% (2%/2 mm), consistent with earlier reports[13] that tighter gamma thresholds increase the likelihood of false rejections. The TL and AL followed the same trend, with values of 97.8694% and 96.4844% for 3%/3 mm, decreasing progressively to 93.6712% and 83.1989% at 2%/2 mm. The narrowing margin between TL and AL reflects reduced tolerance for variation under stricter criteria, aligning with findings by Pal et al[17] and Yu et al[18], respectively, which emphasize the need for heightened sensitivity in highly modulated head and neck plans. The close alignment of TL with CL across all gamma criteria confirms a stable QA process, while the sharp decline in AL - especially between 3%/2 mm and 2%/

Analysis of the I-MR charts reinforced these observations. For the 3%/3 mm criterion, the process appeared highly stable, with the majority of points clustered tightly around the central line. However, outliers were detected at points 210 (I-chart) and 222, 286 (MR chart), demonstrating isolated deviations from an otherwise stable process. The 3%/2 mm criterion showed reduced central line (97.415%) and a corresponding LCL (96.393%). These indicate increased sensitivity to variation compared to 3%/3 mm. At the 2%/3 mm criterion, the central line dropped further to 95.59%, with failures at points 180 and 210 on the I-chart, and at point 213 on the EWMA chart. Interestingly, this criterion showed a positive upward deviation, suggesting either simplified plan modulation or improved delivery accuracy for some patients. The most stringent 2%/2 mm criterion demonstrated the lowest central line (94.4%) and frequent approaches toward its LCL (93.672%). The MR chart flagged a failure at point 195, while the EWMA chart highlighted subtle drifts close to the LCL, underscoring increased vulnerability to small deviations in plan delivery.
The EWMA charts provided complementary insights to the I-MR charts. While the central lines remained consistent with I-charts (e.g., 98.835% for 3%/3 mm, 94.4% for 2%/2 mm), EWMA smoothing produced narrower control bands: LCL = 98.5131% at 3%/3 mm, 97.0744% at 3%/2 mm, 95.2867% at 2%/3 mm, and 94.1574% at 2%/2 mm. These results confirmed that EWMA was more sensitive to persistent small shifts compared to I-MR charts. This was particularly evident at 2%/3 mm and 2%/2 mm, where gradual drifts eventually culminated in control limit violations.
Clinically, SPC provides medical physicists with a structured, data-driven method to monitor long-term stability of treatment delivery, detect small deviations before they become clinically significant, and ensure consistent adherence to institutional and international QA standards. I-MR charts enable rapid identification of sudden variations caused by mechanical issues, calibration drift, or planning inconsistencies, supporting timely corrective actions during routine machine QA or plan verification. Meanwhile, EWMA charts enhance sensitivity to gradual, systematic shifts that may not exceed conventional TL but could compromise dose accuracy over several fractions.
For institutions seeking to adopt SPC-based QA, the results demonstrate that establishing site-specific control limits and periodically validating them with large datasets improves QA reliability compared to using fixed thresholds like 95%. Hospitals can incorporate SPC within existing EPID-based workflows without additional equipment, using automated charting to streamline trend analysis and enhance decision-making in clinical radiotherapy practice. Together, these methods provided a comprehensive monitoring framework for PSQA in head and neck IMRT/VMAT, highlighting the necessity of applying SPC-based control limits tailored to site-specific process capability. Compared to institutional thresholds (often set at 95%), the SPC-derived ALs in this study were more stringent, supporting recommendations for adopting dynamic, data-driven QA thresholds[17,19].
These results mirror literature reports[14,20] linking head and neck QA variability to steep dose gradients, multiple target volumes, and small field sizes. Incorporating SPC in this context not only provides early detection of trends but also supports adaptive QA baselines. As proposed by Xiao et al[21], integrating modulation complexity scores may further refine these control limits, while artificial intelligence-assisted SPC monitoring[22] could automate deviation detection, reduce false positives, and provide real-time feedback to planners. Overall, the SPC metrics derived in this study validate prior evidence on the importance of site-specific QA thresholds. The combined use of EWMA and I-MR charts improved detection sensitivity for head and neck radiotherapy, enhancing patient safety and treatment quality by enabling proactive intervention before clinical tolerances are breached.
This study offers meaningful insights into the systematic and random variations encountered during PSQA and presents a practical approach for establishing tolerance and AL using EPID-based portal dosimetry in accordance with AAPM TG-218 guidelines[16]. By applying I-MR and EWMA control charts, we were able to monitor the performance of PSQA of head and neck patients across various gamma criteria with a high degree of sensitivity. The I-MR charts proved effective in detecting abrupt deviations from expected behavior, while the EWMA charts were particularly useful in identifying gradual trends that might otherwise go unnoticed. Together, these tools provided a reliable statistical framework for ensuring that the process remained within clinically acceptable limits.
Importantly, our findings highlight the need for regular and proactive monitoring of PSQA processes using data-driven methods. Institutions need to develop their site- and technique-specific tolerance and AL, while also considering guidance from established international standards. This work demonstrates the value of integrating SPC into routine clinical practice, moving beyond experience-based judgments toward objective, reproducible, and safer decision-making in radiotherapy. Future investigations should explore the application of these limits across different dosimetry systems to support broader clinical adoption and standardization.
We would like to express our sincere gratitude to the entire team of the Department of Physics, GLA University, and the Department of Radiation Oncology, Mahatma Gandhi Medical College Hospital, for providing their continuous academic encouragement and support. Special thanks are extended to our medical physics colleagues and technical staff for their assistance.
| 1. | Chin D, Boyle GM, Porceddu S, Theile DR, Parsons PG, Coman WB. Head and neck cancer: past, present and future. Expert Rev Anticancer Ther. 2006;6:1111-1118. [RCA] [PubMed] [DOI] [Full Text] [Cited by in Crossref: 190] [Cited by in RCA: 180] [Article Influence: 9.0] [Reference Citation Analysis (0)] |
| 2. | Bray F, Laversanne M, Sung H, Ferlay J, Siegel RL, Soerjomataram I, Jemal A. Global cancer statistics 2022: GLOBOCAN estimates of incidence and mortality worldwide for 36 cancers in 185 countries. CA Cancer J Clin. 2024;74:229-263. [RCA] [PubMed] [DOI] [Full Text] [Cited by in Crossref: 16785] [Cited by in RCA: 15788] [Article Influence: 7894.0] [Reference Citation Analysis (23)] |
| 3. | Cozzi L, Dinshaw KA, Shrivastava SK, Mahantshetty U, Engineer R, Deshpande DD, Jamema SV, Vanetti E, Clivio A, Nicolini G, Fogliata A. A treatment planning study comparing volumetric arc modulation with RapidArc and fixed field IMRT for cervix uteri radiotherapy. Radiother Oncol. 2008;89:180-191. [RCA] [PubMed] [DOI] [Full Text] [Cited by in Crossref: 324] [Cited by in RCA: 302] [Article Influence: 16.8] [Reference Citation Analysis (0)] |
| 4. | Nutting CM, Morden JP, Harrington KJ, Urbano TG, Bhide SA, Clark C, Miles EA, Miah AB, Newbold K, Tanay M, Adab F, Jefferies SJ, Scrase C, Yap BK, A'Hern RP, Sydenham MA, Emson M, Hall E; PARSPORT trial management group. Parotid-sparing intensity modulated versus conventional radiotherapy in head and neck cancer (PARSPORT): a phase 3 multicentre randomised controlled trial. Lancet Oncol. 2011;12:127-136. [RCA] [PubMed] [DOI] [Full Text] [Cited by in Crossref: 1481] [Cited by in RCA: 1277] [Article Influence: 85.1] [Reference Citation Analysis (0)] |
| 5. | Mashhour K, Kamaleldin M, Hashem W. RapidArc vs Conventional IMRT for Head and Neck Cancer Irradiation: Is Faster Necessary Better? Asian Pac J Cancer Prev. 2018;19:207-211. [RCA] [PubMed] [DOI] [Full Text] [Cited by in RCA: 8] [Reference Citation Analysis (0)] |
| 6. | Nelms BE, Zhen H, Tomé WA. Per-beam, planar IMRT QA passing rates do not predict clinically relevant patient dose errors. Med Phys. 2011;38:1037-1044. [RCA] [PubMed] [DOI] [Full Text] [Full Text (PDF)] [Cited by in Crossref: 379] [Cited by in RCA: 339] [Article Influence: 22.6] [Reference Citation Analysis (0)] |
| 7. | Hussein M, Clark CH, Nisbet A. Challenges in calculation of the gamma index in radiotherapy - Towards good practice. Phys Med. 2017;36:1-11. [RCA] [PubMed] [DOI] [Full Text] [Cited by in Crossref: 172] [Cited by in RCA: 125] [Article Influence: 13.9] [Reference Citation Analysis (0)] |
| 8. | International Commission on Radiation Units and Measurements. ICRU Report 83: Prescribing, Recording, and Reporting Photon Beam Therapy (Supplement to ICRU Report 50). J ICRU. 2010;10:NP.2-NP. [DOI] [Full Text] |
| 9. | Yan D, Wong J, Vicini F, Michalski J, Pan C, Frazier A, Horwitz E, Martinez A. Adaptive modification of treatment planning to minimize the deleterious effects of treatment setup errors. Int J Radiat Oncol Biol Phys. 1997;38:197-206. [RCA] [PubMed] [DOI] [Full Text] [Cited by in Crossref: 188] [Cited by in RCA: 158] [Article Influence: 5.4] [Reference Citation Analysis (0)] |
| 10. | Breen SL, Moseley DJ, Zhang B, Sharpe MB. Statistical process control for IMRT dosimetric verification. Med Phys. 2008;35:4417-4425. [RCA] [PubMed] [DOI] [Full Text] [Cited by in Crossref: 80] [Cited by in RCA: 68] [Article Influence: 3.8] [Reference Citation Analysis (0)] |
| 11. | Pawlicki T, Whitaker M, Boyer AL. Statistical process control for radiotherapy quality assurance. Med Phys. 2005;32:2777-2786. [RCA] [PubMed] [DOI] [Full Text] [Cited by in Crossref: 135] [Cited by in RCA: 113] [Article Influence: 5.4] [Reference Citation Analysis (0)] |
| 12. | Tan HQ, Lew KS, Wong YM, Chong WC, Koh CWY, Chua CGA, Yeap PL, Ang KW, Lee JCL, Park SY. Detecting outliers beyond tolerance limits derived from statistical process control in patient-specific quality assurance. J Appl Clin Med Phys. 2024;25:e14154. [RCA] [PubMed] [DOI] [Full Text] [Full Text (PDF)] [Cited by in Crossref: 4] [Cited by in RCA: 3] [Article Influence: 1.5] [Reference Citation Analysis (0)] |
| 13. | Sanghangthum T, Suriyapee S, Srisatit S, Pawlicki T. Statistical process control analysis for patient-specific IMRT and VMAT QA. J Radiat Res. 2013;54:546-552. [RCA] [PubMed] [DOI] [Full Text] [Full Text (PDF)] [Cited by in Crossref: 58] [Cited by in RCA: 50] [Article Influence: 3.8] [Reference Citation Analysis (0)] |
| 14. | Raveendran V, Ganapathi Raman R, Niyas P, Aflah P. Statistical Process Control in Monitoring Radiotherapy Quality Assurance Program: An Institutional Experience. Iran J Med Phys. 2022;19:189-198. [DOI] [Full Text] |
| 15. | Cai B, Goddu SM, Yaddanapudi S, Caruthers D, Wen J, Noel C, Mutic S, Sun B. Normalize the response of EPID in pursuit of linear accelerator dosimetry standardization. J Appl Clin Med Phys. 2018;19:73-85. [RCA] [PubMed] [DOI] [Full Text] [Full Text (PDF)] [Cited by in Crossref: 15] [Cited by in RCA: 10] [Article Influence: 1.3] [Reference Citation Analysis (0)] |
| 16. | Raj S, Saminathan S, Prakasam K. Setting the Tolerance and Action Limit for Patient-specific Quality Assurance of Craniospinal Irradiation Volumetric Modulated Arc Therapy: Based on AAPM TG-218 Report. J Med Phys. 2025;50:155-159. [RCA] [PubMed] [DOI] [Full Text] [Full Text (PDF)] [Cited by in Crossref: 1] [Cited by in RCA: 1] [Article Influence: 1.0] [Reference Citation Analysis (0)] |
| 17. | Pal B, Pal A, Das S, Palit S, Sarkar P, Mondal S, Mallik S, Goswami J, Das S, Sen A, Mondol M. Retrospective study on performance of constancy check device in Linac beam monitoring using Statistical Process Control. Rep Pract Oncol Radiother. 2020;25:91-99. [RCA] [PubMed] [DOI] [Full Text] [Full Text (PDF)] [Cited by in Crossref: 11] [Cited by in RCA: 10] [Article Influence: 1.7] [Reference Citation Analysis (0)] |
| 18. | Yu L, Tang TLS, Cassim N, Livingstone A, Cassidy D, Kairn T, Crowe SB. Analysis of dose comparison techniques for patient-specific quality assurance in radiation therapy. J Appl Clin Med Phys. 2019;20:189-198. [RCA] [PubMed] [DOI] [Full Text] [Full Text (PDF)] [Cited by in Crossref: 19] [Cited by in RCA: 16] [Article Influence: 2.3] [Reference Citation Analysis (0)] |
| 19. | Cui T, Peng JX, Jin XL, Chu XG, Zhang J, Cui LZ, Xing XF. Improving intensity-modulated radiation therapy quality assurance by adopting statistical process control. Cancer Radiother. 2022;26:427-432. [RCA] [PubMed] [DOI] [Full Text] [Cited by in Crossref: 3] [Cited by in RCA: 4] [Article Influence: 1.0] [Reference Citation Analysis (0)] |
| 20. | Bailey DW, Nelms BE, Attwood K, Kumaraswamy L, Podgorsak MB. Statistical variability and confidence intervals for planar dose QA pass rates. Med Phys. 2011;38:6053-6064. [RCA] [PubMed] [DOI] [Full Text] [Cited by in Crossref: 47] [Cited by in RCA: 42] [Article Influence: 2.8] [Reference Citation Analysis (0)] |
| 21. | Xiao Q, Bai S, Li G, Yang K, Bai L, Li Z, Chen L, Xian L, Hu Z, Zhong R. Statistical process control and process capability analysis for non-normal volumetric modulated arc therapy patient-specific quality assurance processes. Med Phys. 2020;47:4694-4702. [RCA] [PubMed] [DOI] [Full Text] [Cited by in Crossref: 28] [Cited by in RCA: 24] [Article Influence: 4.0] [Reference Citation Analysis (0)] |
| 22. | Zhang H, Lu W, Cui H, Li Y, Yi X. Assessment of Statistical Process Control Based DVH Action Levels for Systematic Multi-Leaf Collimator Errors in Cervical Cancer RapidArc Plans. Front Oncol. 2022;12:862635. [RCA] [PubMed] [DOI] [Full Text] [Full Text (PDF)] [Cited by in Crossref: 4] [Cited by in RCA: 7] [Article Influence: 1.8] [Reference Citation Analysis (0)] |