Published online Nov 24, 2020. doi: 10.5306/wjco.v11.i11.918
Peer-review started: June 24, 2020
First decision: September 18, 2020
Revised: October 6, 2020
Accepted: October 20, 2020
Article in press: October 20, 2020
Published online: November 24, 2020
Processing time: 147 Days and 10.3 Hours
Oral cancer is the sixth most prevalent cancer worldwide. Public knowledge in oral cancer risk factors and survival is limited.
To come up with machine learning (ML) algorithms to predict the length of survival for individuals diagnosed with oral cancer, and to explore the most important factors that were responsible for shortening or lengthening oral cancer survival.
We used the Surveillance, Epidemiology, and End Results database from the years 1975 to 2016 that consisted of a total of 257880 cases and 94 variables. Four ML techniques in the area of artificial intelligence were applied for model training and validation. Model accuracy was evaluated using mean absolute error (MAE), mean squared error (MSE), root mean squared error (RMSE), R2 and adjusted R2.
The most important factors predictive of oral cancer survival time were age at diagnosis, primary cancer site, tumor size and year of diagnosis. Year of diagnosis referred to the year when the tumor was first diagnosed, implying that individuals with tumors that were diagnosed in the modern era tend to have longer survival than those diagnosed in the past. The extreme gradient boosting ML algorithms showed the best performance, with the MAE equaled to 13.55, MSE 486.55 and RMSE 22.06.
Using artificial intelligence, we developed a tool that can be used for oral cancer survival prediction and for medical-decision making. The finding relating to the year of diagnosis represented an important new discovery in the literature. The results of this study have implications for cancer prevention and education for the public.
Core Tip: Oral cancer is the sixth most prevalent cancer worldwide. The goal of this study was to come up with machine learning algorithms to predict the length of oral cancer survival and to explore the most important factors that were responsible for it. Age at diagnosis, primary cancer site, tumor size and year of diagnosis were found to be the most important factors predictive of oral cancer survival. Year of diagnosis represents an important new discovery in the literature. Using artificial intelligence, we developed a tool that can be used for oral cancer survival prediction and for medical decision making.
- Citation: Hung M, Park J, Hon ES, Bounsanga J, Moazzami S, Ruiz-Negrón B, Wang D. Artificial intelligence in dentistry: Harnessing big data to predict oral cancer survival. World J Clin Oncol 2020; 11(11): 918-934
- URL: https://www.wjgnet.com/2218-4333/full/v11/i11/918.htm
- DOI: https://dx.doi.org/10.5306/wjco.v11.i11.918
To minimize the occurrence of oral cancer and improve one’s quality of life, it is imperative to conduct screenings for early detection of head and neck carcinomas (HNC) on all high-risk dental patients. HNC, which is the umbrella term that includes oral cancer, are often located within the oral and nasal cavities, upper/lower pharynx, larynx, and the maxillary sinus[1-3]. Early screenings for identification of dysplastic tissue in the head and neck region are within the scope of care of the dental health providers. Oral cancer may be curable if detected early[4]. However, more than one-half of all oral and pharyngeal cancers in the United States were detected at late stages[4,5], thus the overall United States five-year survival rate for oral cancer was only 52 percent[6]. In 2012, there were 145000 deaths in the United States attributed to oral cancers[2]. Throughout the world, approximately 563826 diagnoses of oral cancer were reported, rendering it the sixth most common type of cancer in the world[7-10]. Although there is a downward trend in oral cancer incidence due to the rising awareness in the risks associated with tobacco use and alcohol consumption in the United States, a general lack of public awareness of the symptoms and other risk factors of oral cancer remains[4]. In 2016, a total of 48330 oral cavity and oropharyngeal cancer incidents were reported[11], and an increase of 225% of human papillomavirus-related oropharynx cancer was recorded[11]. Altogether, the need to address additional risk factors and increases in early screenings of oral cancers are key factors to improving cancer survival[12].
Among those with an oral cancer diagnosis, stage of tumor at time of diagnosis and treatment have been associated with survival[10,13]. Specifically, in a study by Sargeran et al[13] the survival rates were higher in patients with stages I or II cancer than those with stage III cancer at the time of the diagnosis. They further concluded that patients who had undergone radiotherapy alone had a lower survival rate than patients with a combination of surgery and radiotherapy, and that age and sex were not associated with survival. However, Warnakulasuriya et al[10] found that younger age was associated with higher 5-year relative survival rate.
Additionally, race has been associated with varying level of survival rates. A study using 1973-2002 data from Surveillance, Epidemiology, and End Results (SEER-18)[14] by Shiboski et al[15] revealed that the stage at diagnosis was related to 5-year relative survival rate among Whites and Blacks. The results indicated that Blacks had a significantly higher rate of cancer, mainly located on the tongue, with tumors larger than 4 cm in diameter at the time of diagnosis. Black men experienced lower 5-year relative survival rates compared to White men, especially for tongue cancer. Shiboski et al[15] explained that the differences in survivals across different races may be due to differences in access to, and utilization of healthcare services.
Due to the limited understanding of the disparities seen across cancer survivors and public knowledge on risk factors and symptoms, investigators in the past have suggested for primary care providers to put greater weight on initial screening and comprehensive soft-tissue exams[15]. Having a tool to accurately predict the survival time of oral cancer patients could help regulate the effects of psychological distress on physical and mental health outcomes after diagnosis. Medical decision-making tools based on fuzzy and soft set theories and artificial intelligence are effective for determination of cancer survival and enhancing disease awareness[16]. Awareness of the disease can lessen the burden of the disease on the survivors and their caretakers, and assist with medical and dental decision-making moving forward. The main purpose of this study was to apply artificial intelligence to build a model to predict the length of survival for those diagnosed with oral cancer as accurately and precisely as possible based on 40 plus years-worth of data representative of the United States’ population. The secondary purpose was to explore the most important factors that were influencing the longevity of oral cancer survival.
Data from the SEER-18 database[14] were used to conduct this study. The SEER-18 database is a population-based registry that contains cancer-related data on individuals diagnosed with cancer from hospitals and laboratories in the United States[14]. The SEER-18 database does not contain data from Louisiana during hurricanes Katrina and Rita from July to December in 2005[14]. Institutional review board approval was not required for this study since the SEER-18 data were deidentified and publicly available online. The data that support the findings of this study are openly available at https://seer.cancer.gov/.
Oral cancer cases from the years 1975 to 2016 in the SEER-18 database[17] were identified by the International Classification of Diseases for Oncology, 3rd Edition (ICD-O-3) site codes (https://training.seer.cancer.gov/head-neck/abstract-code-stage/codes.html)[18]. Table 1 contains a list of all ICD-O-3 site codes that were identified for the oral cancer cases utilized in this study[18-20].
| ICD-O-3 codes | Sites | Number of cases |
| C000 | External upper lip | 413 |
| C001 | External lower lip | 2444 |
| C002 | External lip, NOS | 92 |
| C003 | Mucosa of upper lip | 104 |
| C004 | Mucosa of lower lip | 567 |
| C005 | Mucosa of lip, NOS | 29 |
| C006 | Commissure of lip | 85 |
| C008 | Overlapping lesion of lip | 46 |
| C009 | Lip, NOS (excludes skin of lip C44.0) | 153 |
| C019 | Base of tongue, NOS | 10840 |
| C020 | Dorsal surface of tongue, NOS | 652 |
| C021 | Border of tongue | 2632 |
| C022 | Ventral surface of tongue, NOS | 1688 |
| C023 | Anterior 2/3 of tongue, NOS | 2807 |
| C024 | Lingual tonsil | 170 |
| C028 | Overlapping lesion of tongue | 581 |
| C029 | Tongue, NOS | 3050 |
| C030 | Upper gum | 821 |
| C031 | Lower gum | 1680 |
| C039 | Gum, NOS | 210 |
| C040 | Anterior floor of mouth | 1362 |
| C041 | Lateral floor of mouth | 352 |
| C048 | Overlapping lesion of floor of mouth | 136 |
| C049 | Floor of mouth, NOS | 2284 |
| C050 | Hard palate | 1155 |
| C051 | Soft palate, NOS (excludes nasopharyngeal surface of soft palate C11.3) | 1301 |
| C052 | Uvula | 180 |
| C058 | Overlapping lesion of palate | 206 |
| C059 | Palate, NOS | 154 |
| C060 | Cheek mucosa | 1787 |
| C061 | Vestibule of mouth | 134 |
| C062 | Retromolar area | 1413 |
| C068 | Overlapping lesion of other and unspecified parts of mouth | 142 |
| C069 | Mouth, NOS | 487 |
| C079 | Parotid gland | 7111 |
| C080 | Submandibular gland | 1149 |
| C081 | Sublingual gland | 94 |
| C088 | Overlapping lesion of major salivary glands | 6 |
| C089 | Major salivary gland, NOS (excludes minor salivary gland, NOS C06.9) | 287 |
| C090 | Tonsillar fossa | 1735 |
| C091 | Tonsillar pillar | 888 |
| C098 | Overlapping lesion of tonsil | 109 |
| C099 | Tonsil, NOS (excludes lingual tonsil C02.4 and pharyngeal tonsil C11.1) | 9521 |
| C100 | Vallecula | 282 |
| C101 | Anterior surface of epiglottis | 88 |
| C102 | Lateral wall of oropharynx | 184 |
| C103 | Posterior wall of oropharynx | 246 |
| C104 | Branchial cleft (site of neoplasm) | 37 |
| C108 | Overlapping lesion of oropharynx | 277 |
| C109 | Oropharynx, NOS | 940 |
| C129 | Pyriform sinus | 1707 |
| C130 | Postcricoid region | 78 |
| C131 | Hypopharyngeal aspect of aryepiglottic fold, NOS (excludes laryngeal aspect of aryepiglottic fold C32.1) | 214 |
| C132 | Posterior wall of hypopharynx | 250 |
| C138 | Overlapping lesion of hypopharynx | 113 |
| C139 | Hypopharynx, NOS | 816 |
| C739 | Thyroid gland | 111425 |
The outcome of interest for this study was oral cancer survival time. Survival time represented the time of survival in months from the date of cancer diagnosis to the date of last contact[21,22].
Descriptive statistics of demographics and cancer characteristics (such as primary site, tumor size, laterality, etc.) were analyzed. Prediction of oral cancer survival time was modeled by using four machine learning (ML) algorithms: linear regression, decision tree, random forest, and extreme gradient boosting (XGBoost). ML is a computer algorithm-based method that can efficiently detect relationships between variables with unrecognizable trends in large and complex data. The process takes into account historical trends to come up with models in predicting outcome of interest (e.g., oral cancer survival time), and then validates the models with actual or current data. The performance of the various models from the validation process will be compared, and the more parsimonious model with better performance is generally the preferred model. The ML techniques included in this study were chosen due to their ability to prevent over-fitting, being commonly used in similar studies, and their ease of interpretation in medical settings. To compare the different techniques, model accuracy was evaluated using mean absolute error (MAE)[1,13], mean squared error (MSE), root mean squared error (RMSE), R2 and adjusted R2. All analyses were conducted using Python 3.7.4 (Python Software Foundation).
There was a total of 257880 oral cancer cases and 94 variables (i.e., features) in the dataset. Cases with missing data on the outcome variable (i.e., oral cancer survival time) were dropped, and responses that were marked as not applicable were excluded. All variables with more than 40% of missing values were also excluded. Further data processing was conducted to remove null features, constant features (i.e., features with same values for the outcome), quasi-constant features (i.e., features with variance less than 0.01), and highly correlated features (i.e., features with correlation higher than 0.9). These features were removed prior to data analysis as they would not contribute to the prediction of outcome and can often cause errors in the prediction. Outliers were detected by plotting distributions of each variable and they were replaced by mean, mode, and quantile as appropriate. Features with more than 90% the values that were the same were dropped.
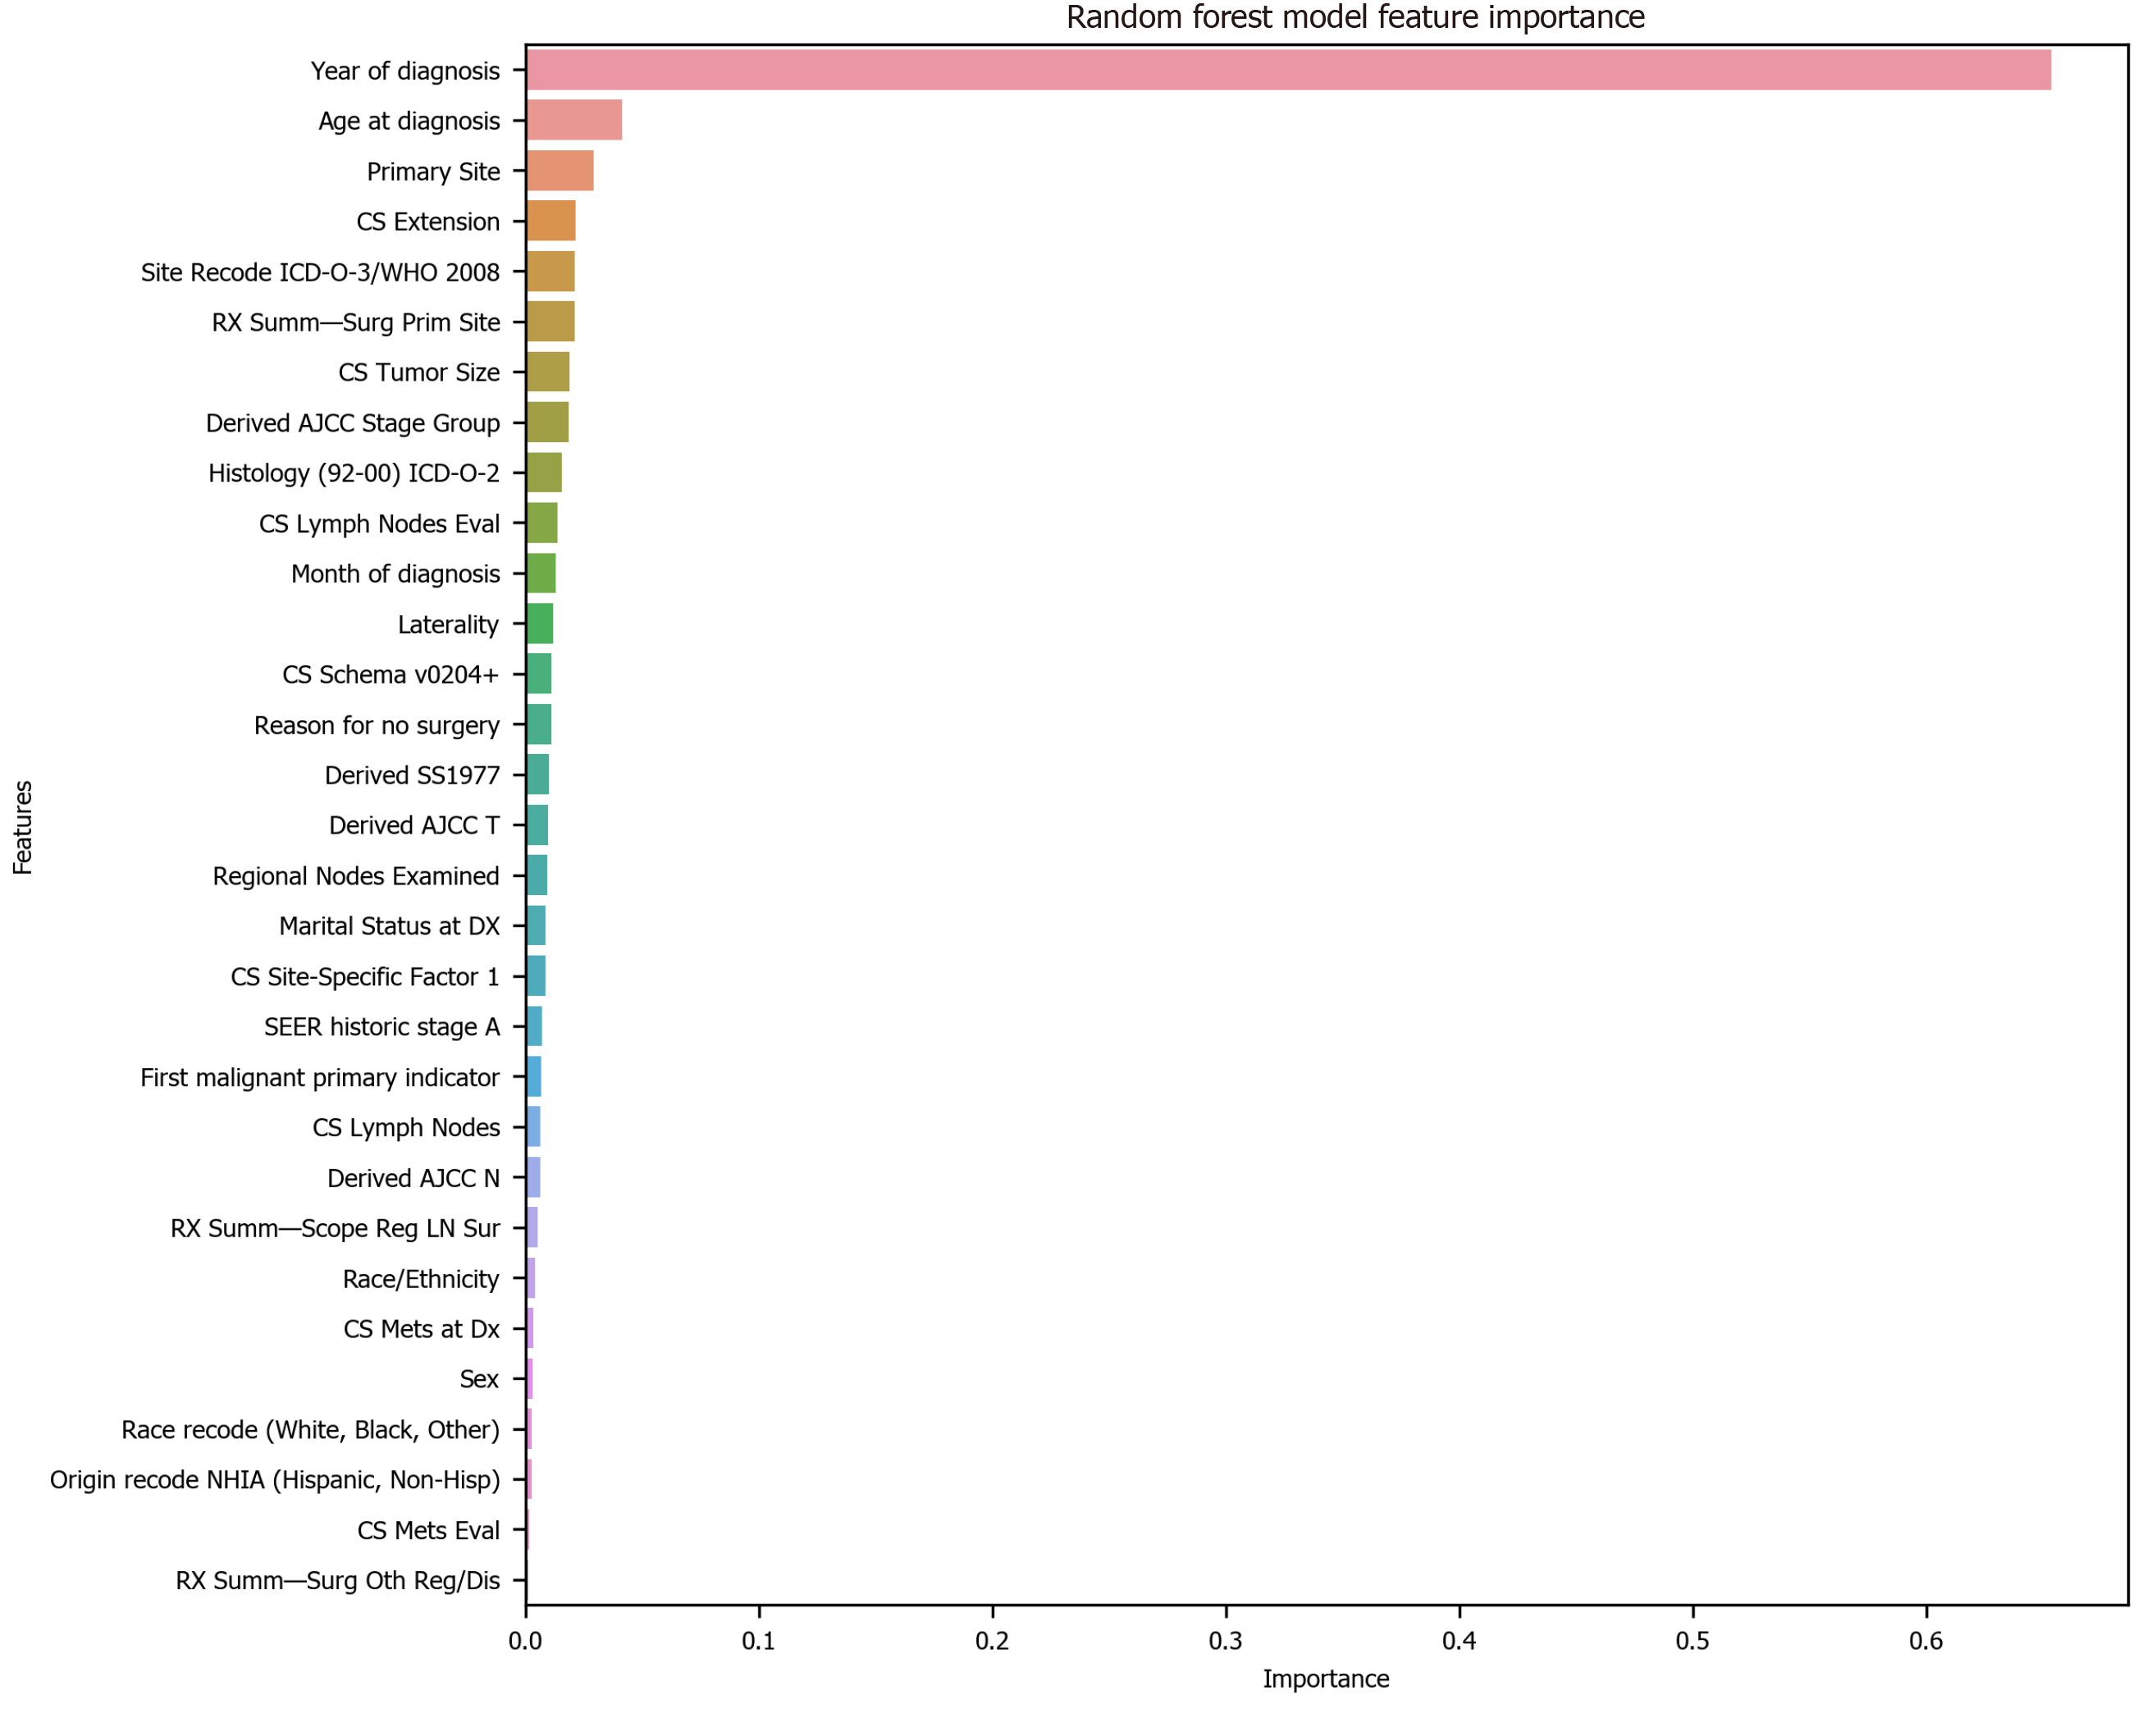
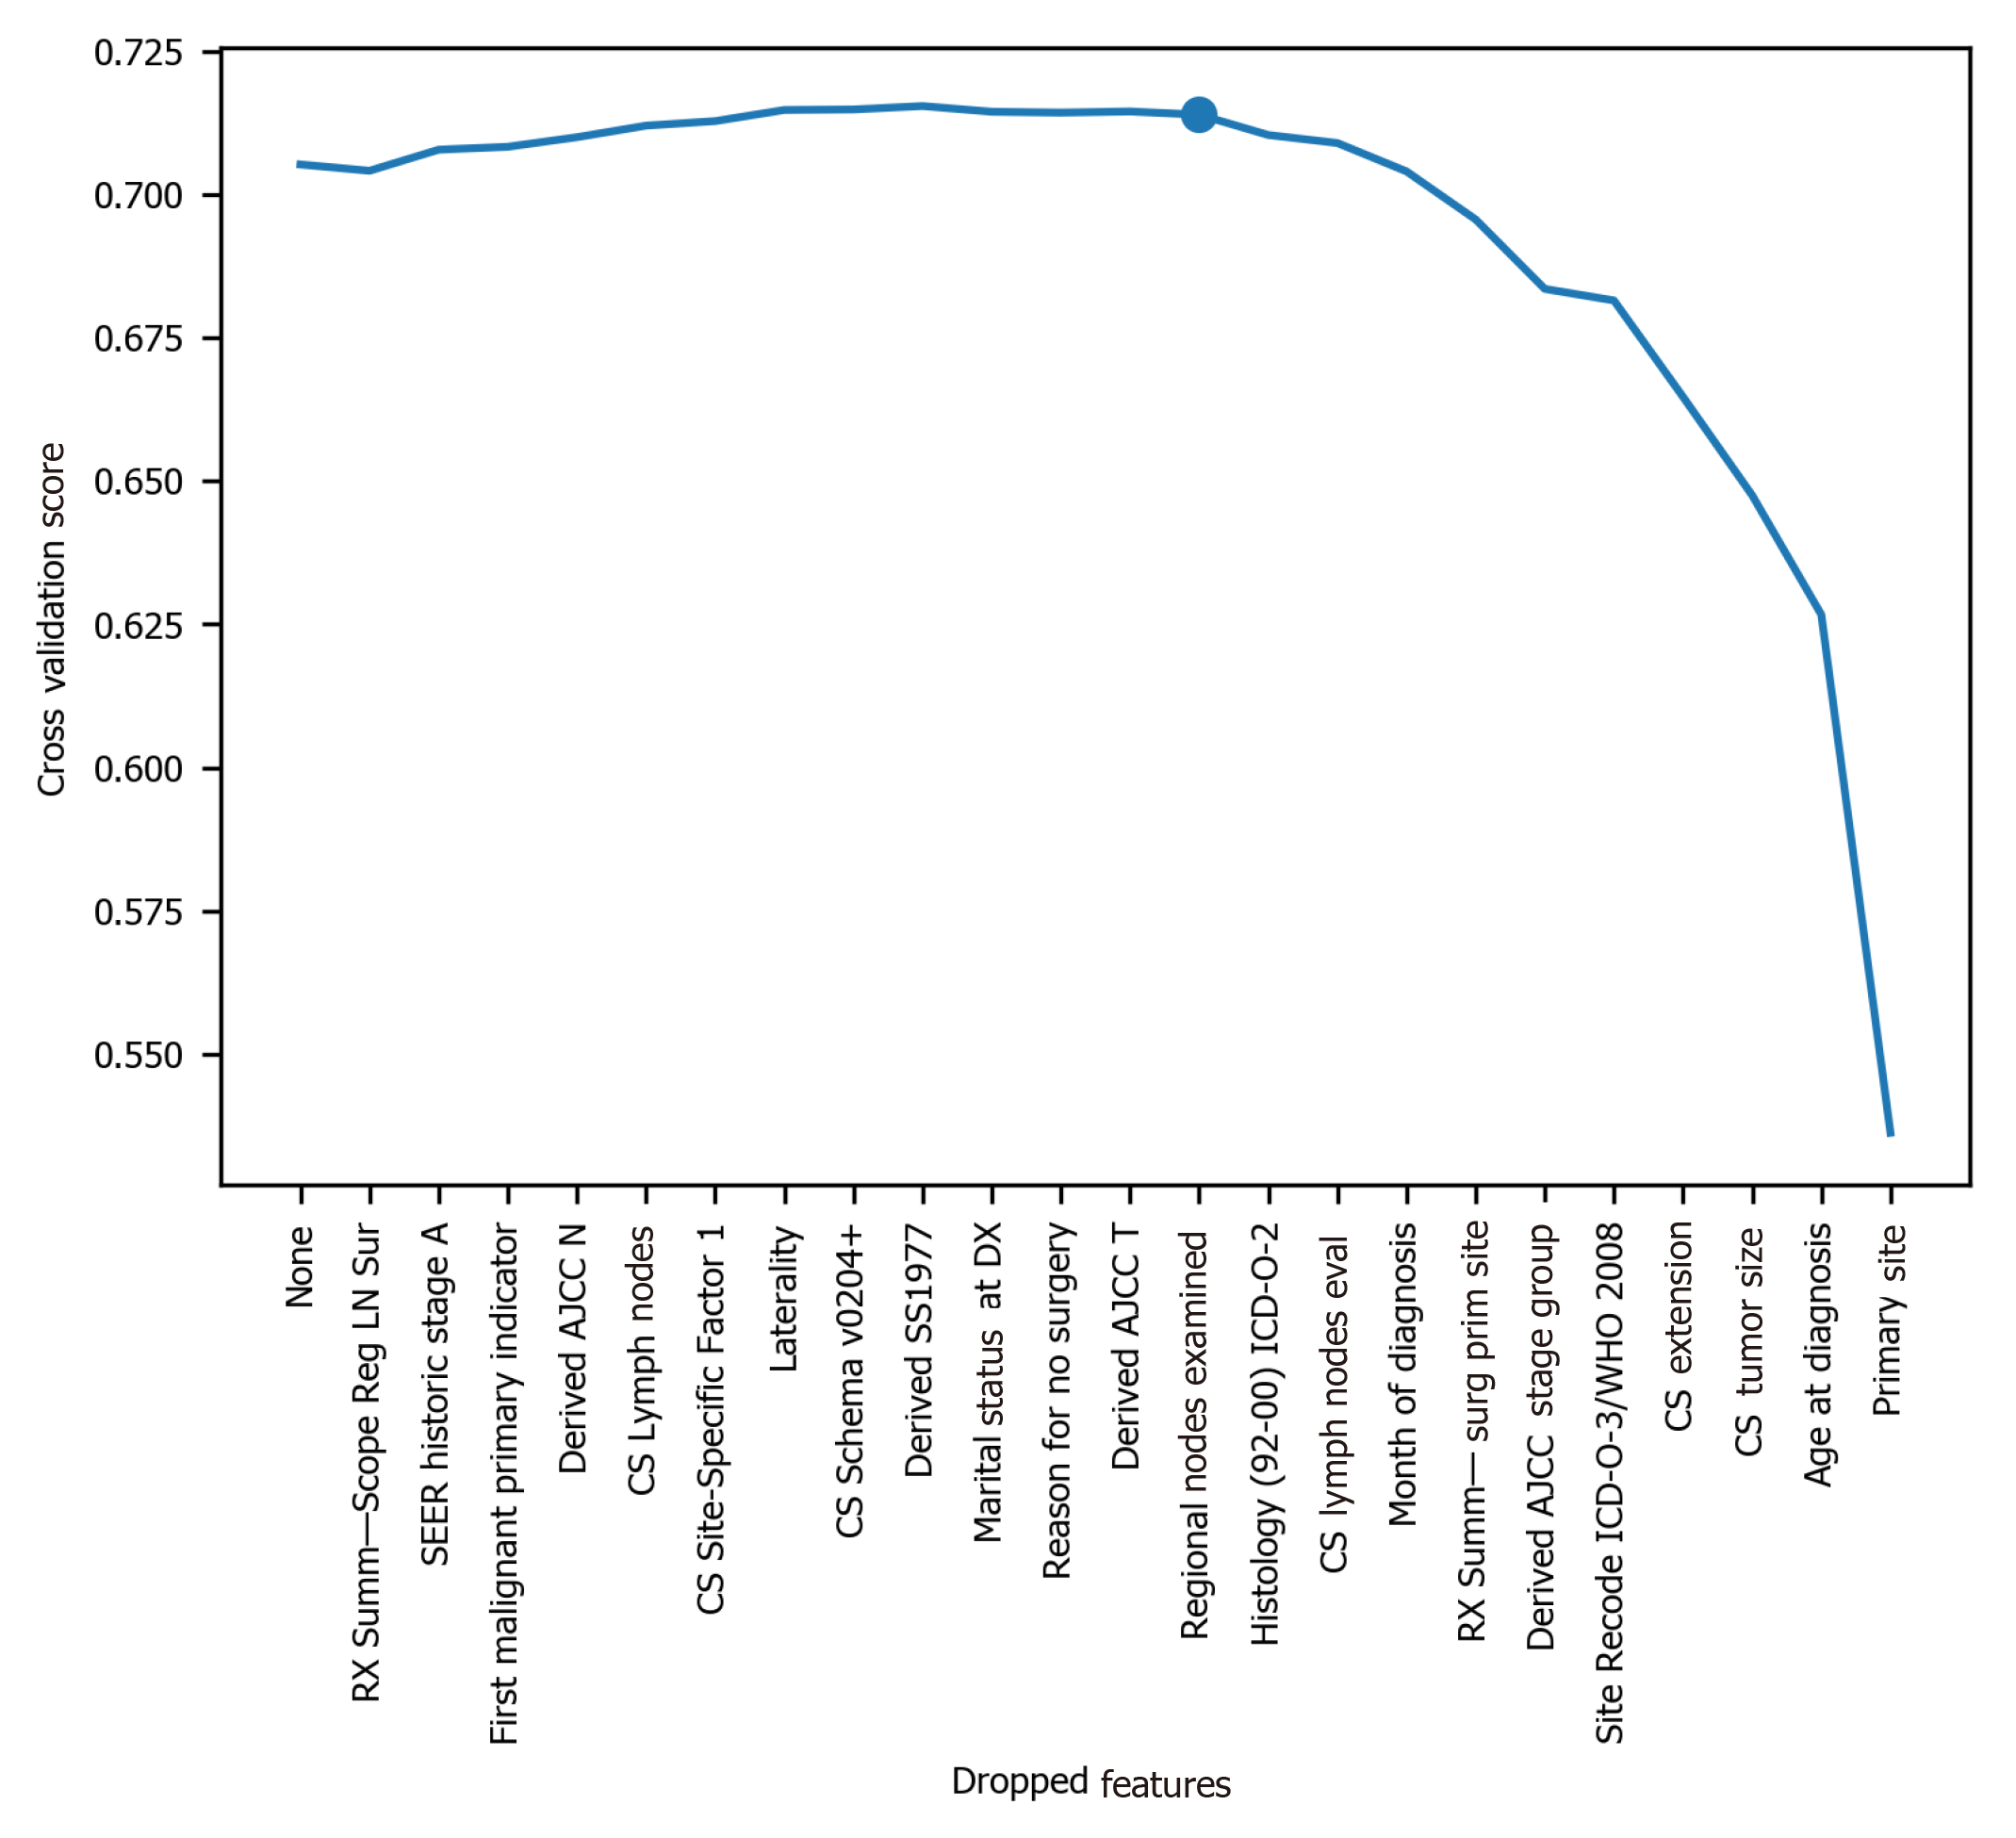
To avoid the impracticality of including too many variables, further feature selection was performed using random forest. We aimed to narrow down the variables as much as possible without losing prediction accuracy. The random forest model showed that many features are of little importance (Figure 1). We dropped 7 features that were of less importance in terms of their importance scores, and a step backward feature selection method with random forest was then applied to select the best number of features. The cross-validation scores were then plotted (Figure 2) and the most important 10 features were kept to create a parsimony model. The cross-validation scores did not change much even after deleting the less significant features. The selected 10 features were: Year of diagnosis; primary site; age at diagnosis; CS tumor size; CS extension; CS lymph nodes eval; RX Summ-surg prim site; derived AJCC stage group; site recode ICD-O-3/WHO 2008; and month of diagnosis.
The final dataset used for model prediction from linear regression, decision tree, random forest, and XGBoost had an effective sample size of 177714 cases with a total of 10 variables. Most of the values were categorized and given numerical code values. Table 2 lists all of the variables. Data were randomly split into training set and testing set. The training set contained 75% of the data and were used to build models. The testing set contained 25% of the data and were used to validate the models built from the training data. Detailed model parameter tuning set up is available upon request from the authors.
| Variables | Variable description |
| Age at diagnosis | This data item represents the age of the patient at diagnosis for this cancer. The code is three digits and represents the patient’s actual age in years |
| Year of diagnosis | The year of diagnosis is the year the tumor was first diagnosed by a recognized medical practitioner, whether clinically or microscopically confirmed |
| Month of diagnosis | The month of diagnosis is the month the tumor was first diagnosed by a recognized medical practitioner, whether clinically or microscopically confirmed |
| Primary site | This data item identifies the site in which the primary tumor originated. See the International Classification of Diseases for Oncology, 3rd Edition (ICD-O-3)[18] for topography codes. The decimal point is eliminated |
| CS tumor size | Information on tumor size. Available for 2004-2015 diagnosis years. Earlier cases may be converted and new codes added which weren't available for use prior to the current version of CS. For more information, see http://seer.cancer.gov/seerstat/variables/seer/ajcc-stage[19] |
| CS extension | Information on extension of the tumor. Available for 2004-2015 diagnosis years. Earlier cases may be converted and new codes added which weren't available for use prior to the current version of CS. For more information, see http://seer.cancer.gov/seerstat/variables/seer/ajcc-stage[19] |
| CS lymph nodes eval | Available for 2004-2015, but not required for the entire timeframe. Will be blank in cases not collected. For more information, see http://seer.cancer.gov/seerstat/variables/seer/ajcc-stage[19] |
| Derived AJCC stage group | This is the AJCC “Stage Group” component that is derived from CS detailed site-specific codes, using the CS algorithm, effective with 2004-2015 diagnosis years. See the CS site-specific schema for details (http://seer.cancer.gov/seerstat/variables/seer/ajcc-stage)[19] |
| RX Summ-surg prim site | Surgery of primary site describes a surgical procedure that removes and/or destroys tissue of the primary site performed as part of the initial work-up or first course of therapy |
| Site recode ICD-O-3/WHO 2008 | A recode based on primary site and ICD-O-3 Histology in order to make analyses of site/histology groups easier. For example, the lymphomas are excluded from stomach and Kaposi and mesothelioma are separate categories based on histology. For more information, see http://seer.cancer.gov/siterecode/icdo3_dwhoheme/index.html[20] |
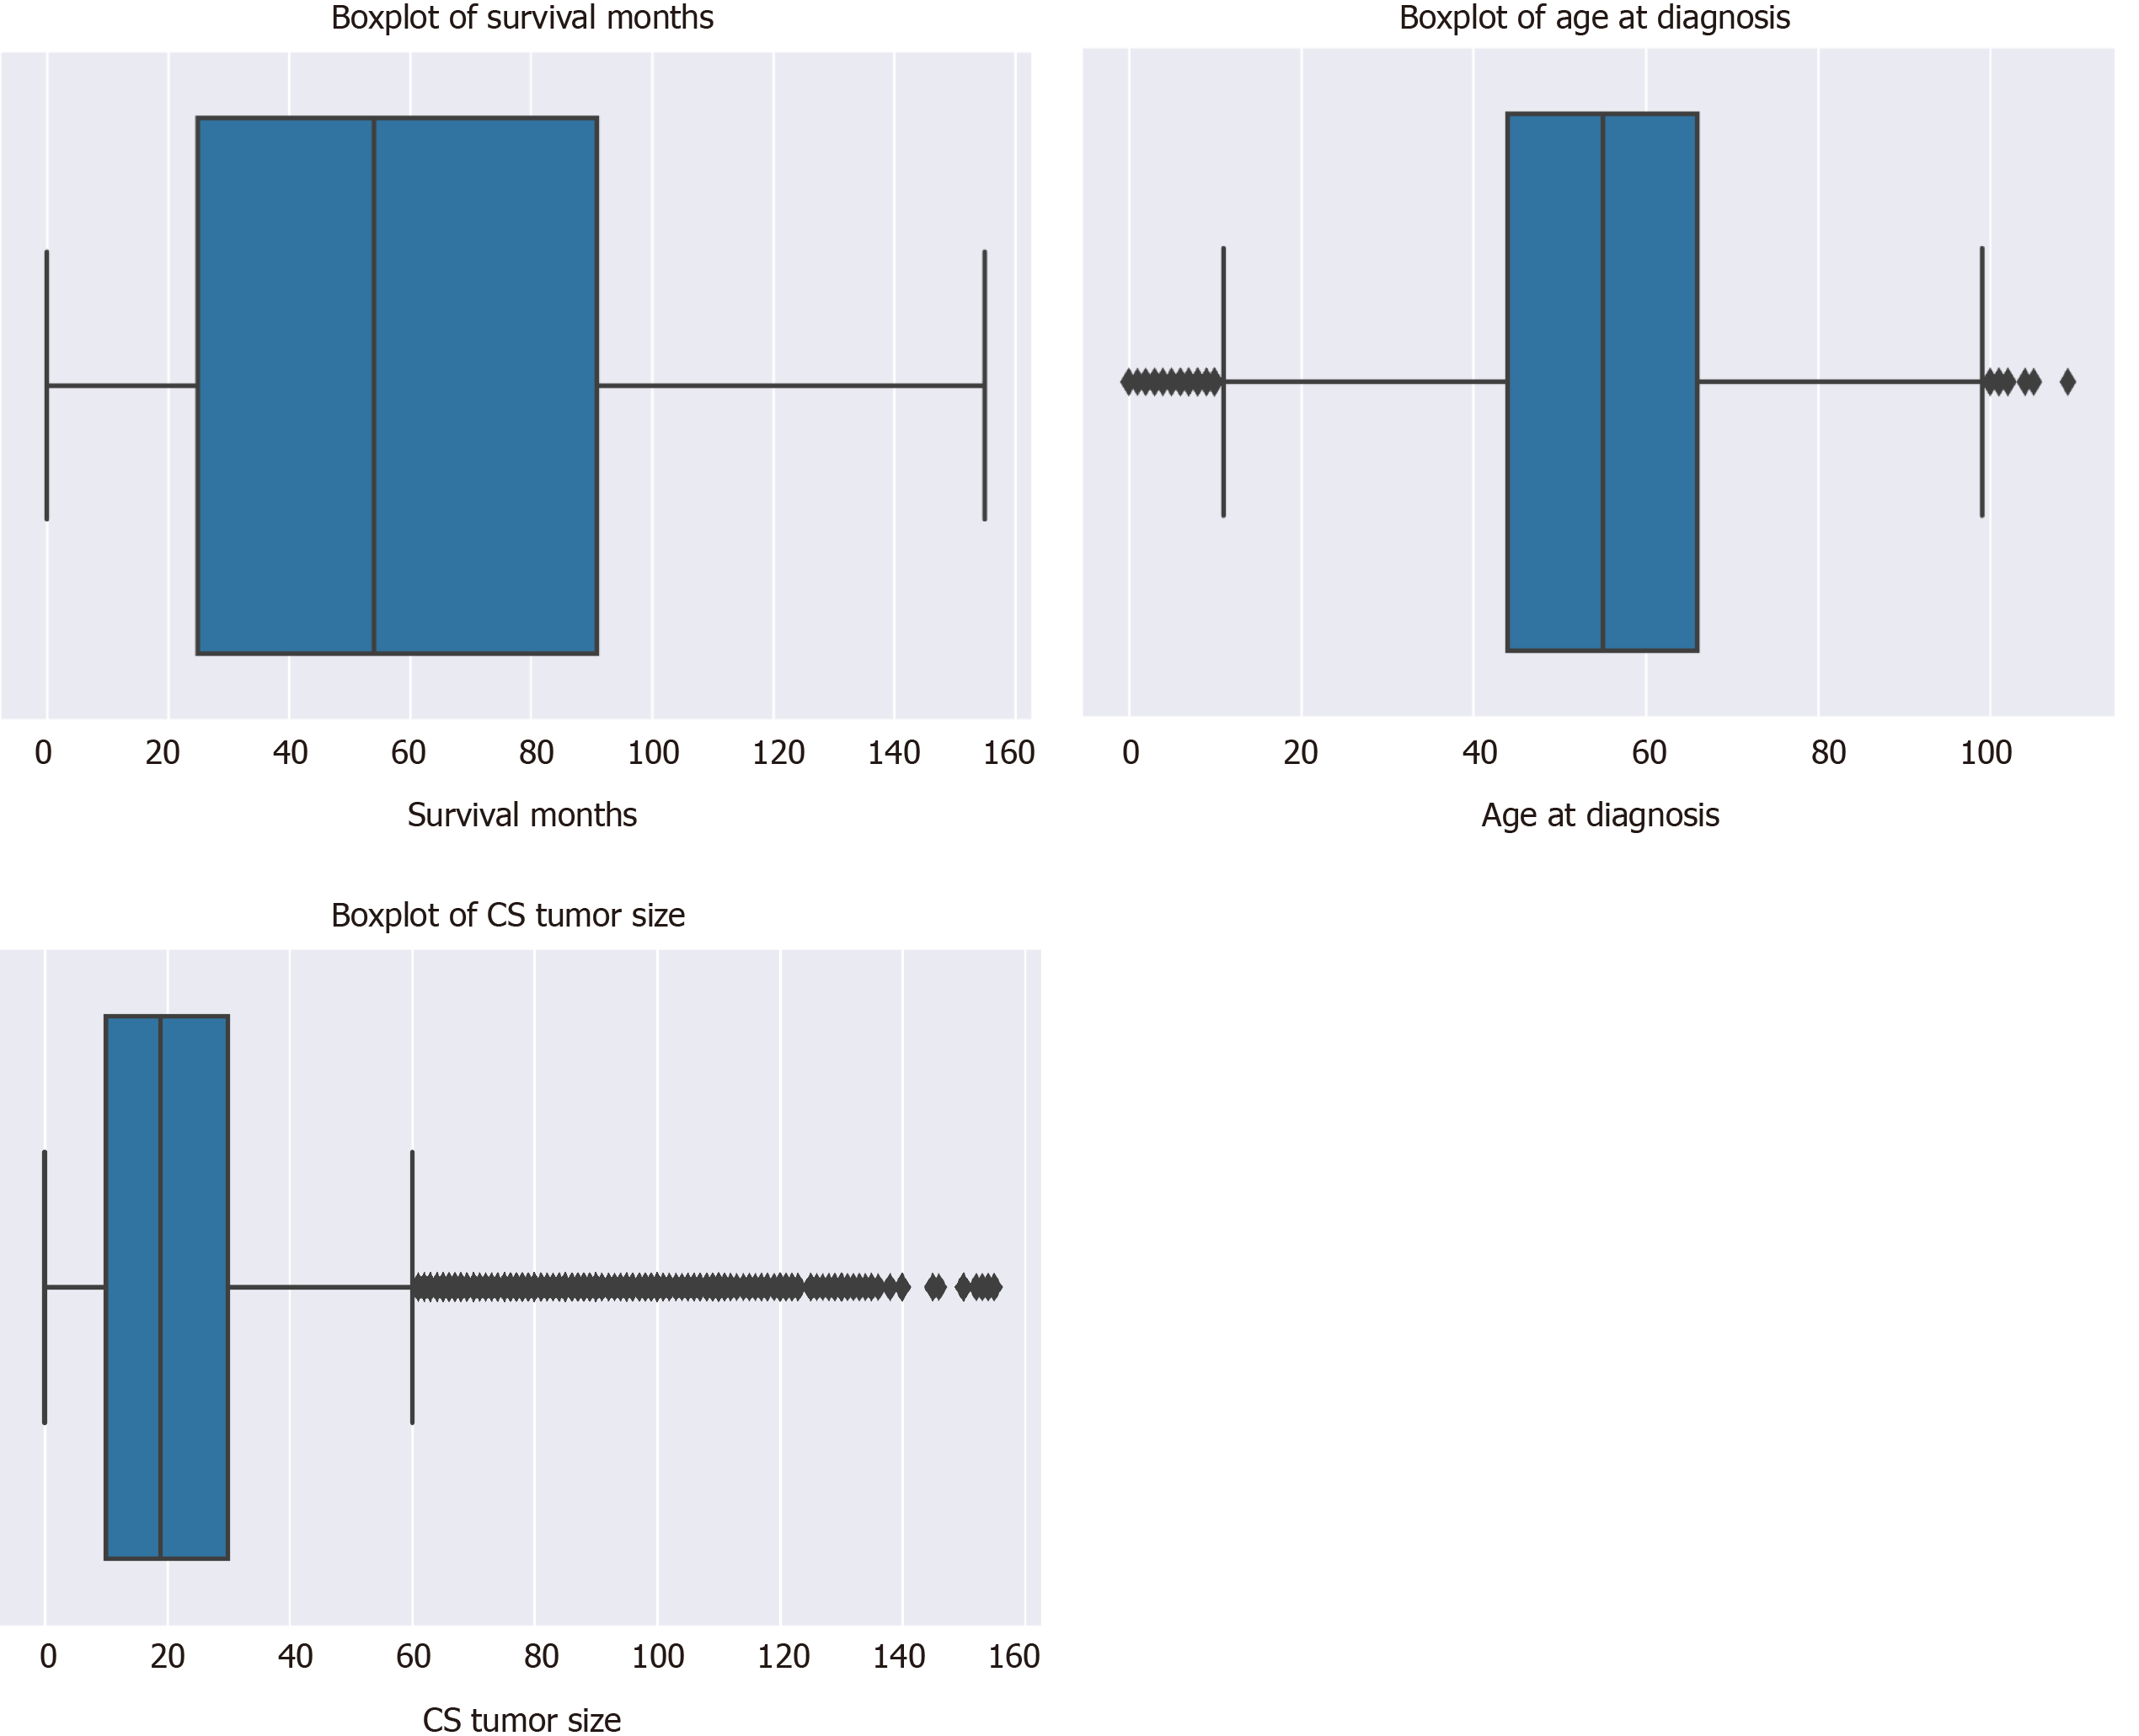
There was a total of 177714 oral cancer cases included in the study, of which 63111 were oropharyngeal cancer cases and 114603 were laryngeal cancer cases. The nasopharyngeal cancer cases did not make it to the final sample since there was very few of these cases and all of them had a large number of missing values. Oropharynx cancer included anatomical positions at the base of tongue, lingual tonsil, soft palate, uvula, tonsil, orpharynx, Waldeyer ring, and histology sites[23]. Laryngeal cancer included areas at the larynx, which comprises of the epiglottis, supraglottis, vocal cord, glottis, and subglottis[24]. The sample consisted of 40.62% (n = 72179) males. The average age at diagnosis was 54.6 years old (range: 0-109) (Figure 3). Nearly 40% of the sample were 60 years or older at the time of oral cancer diagnosis (Table 3).
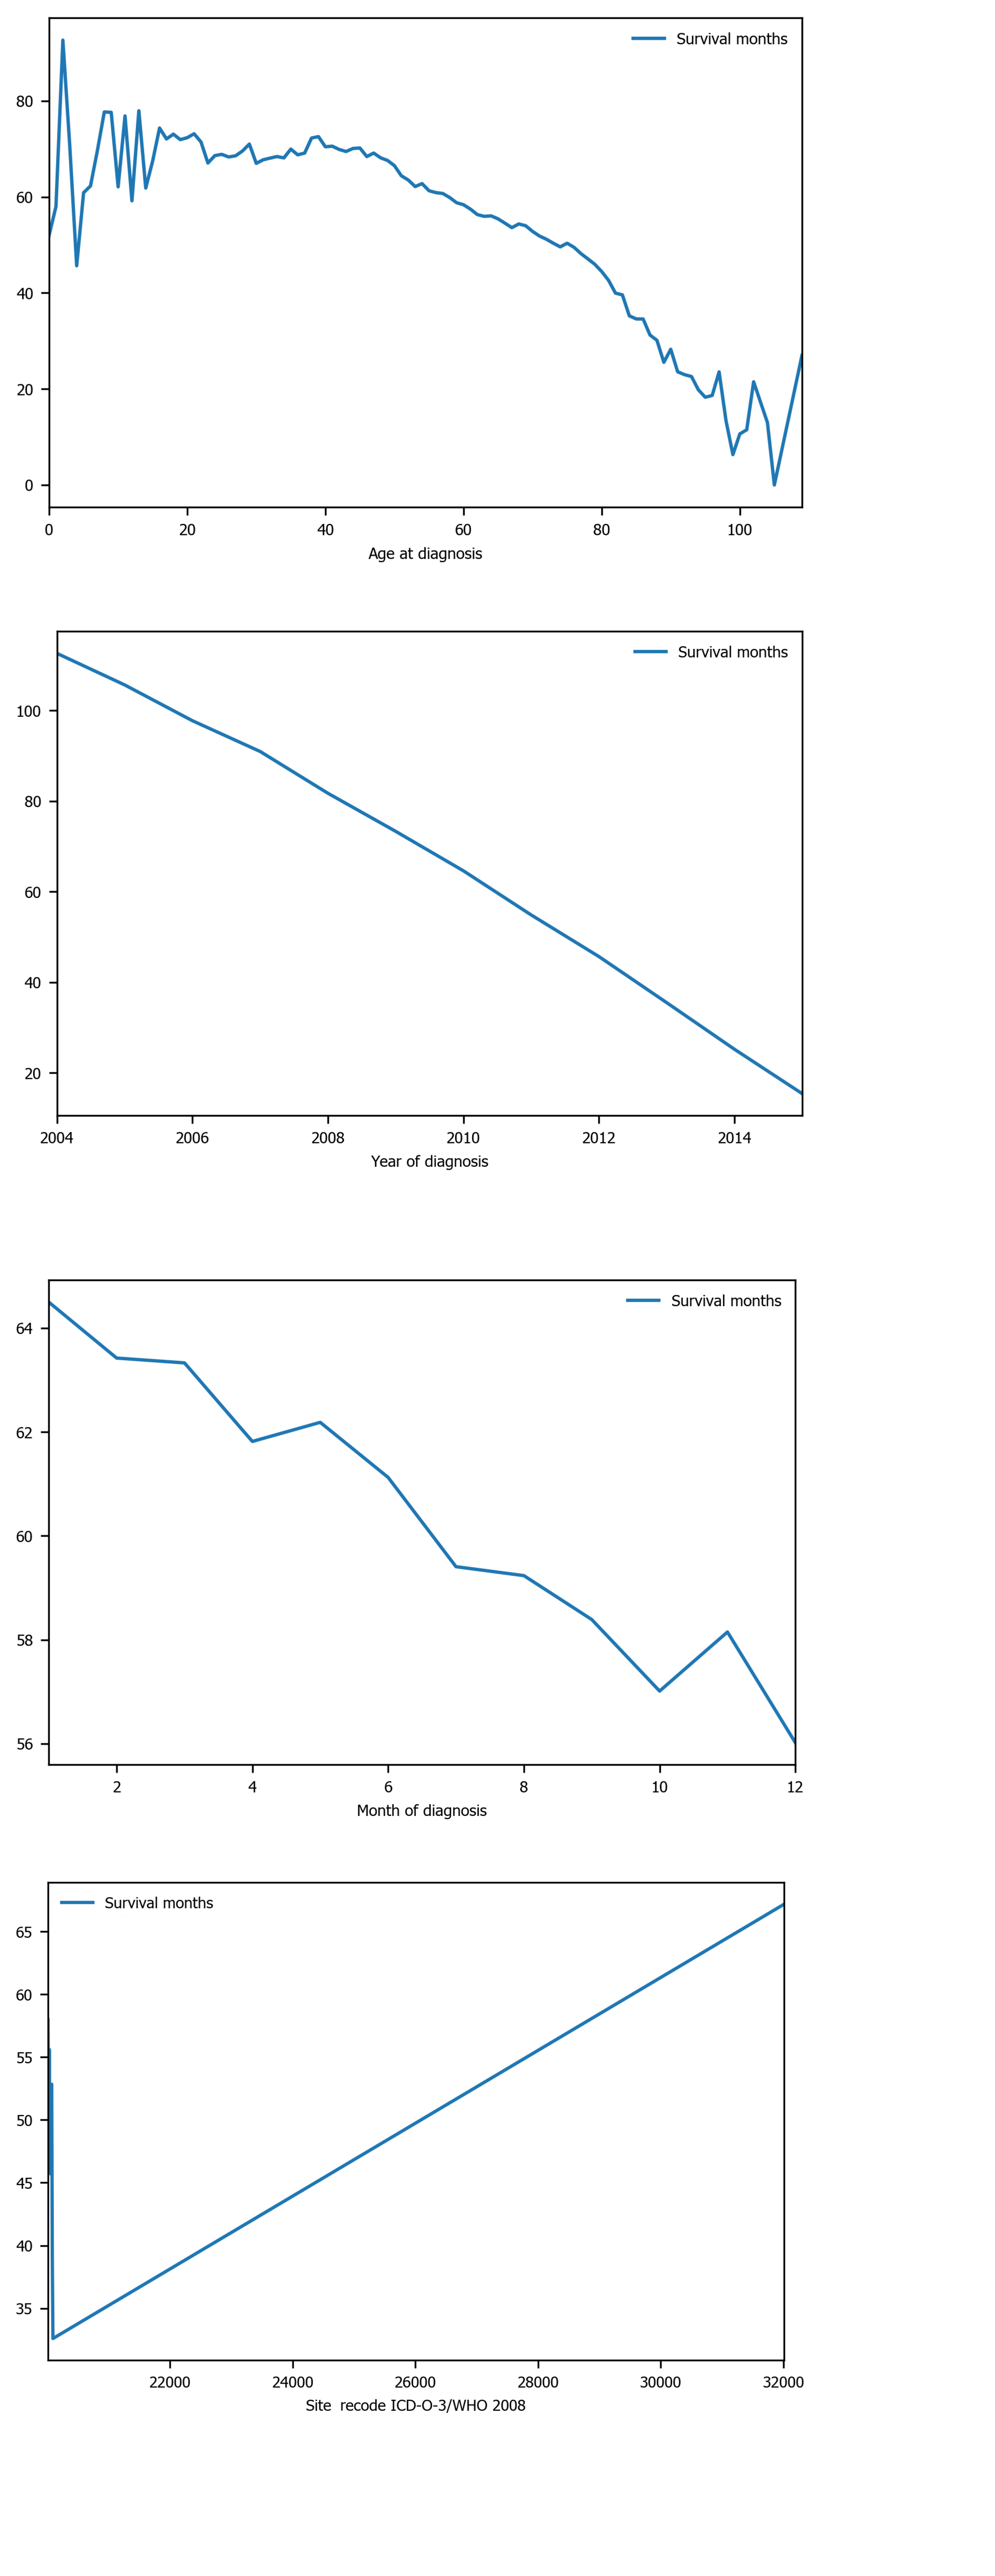
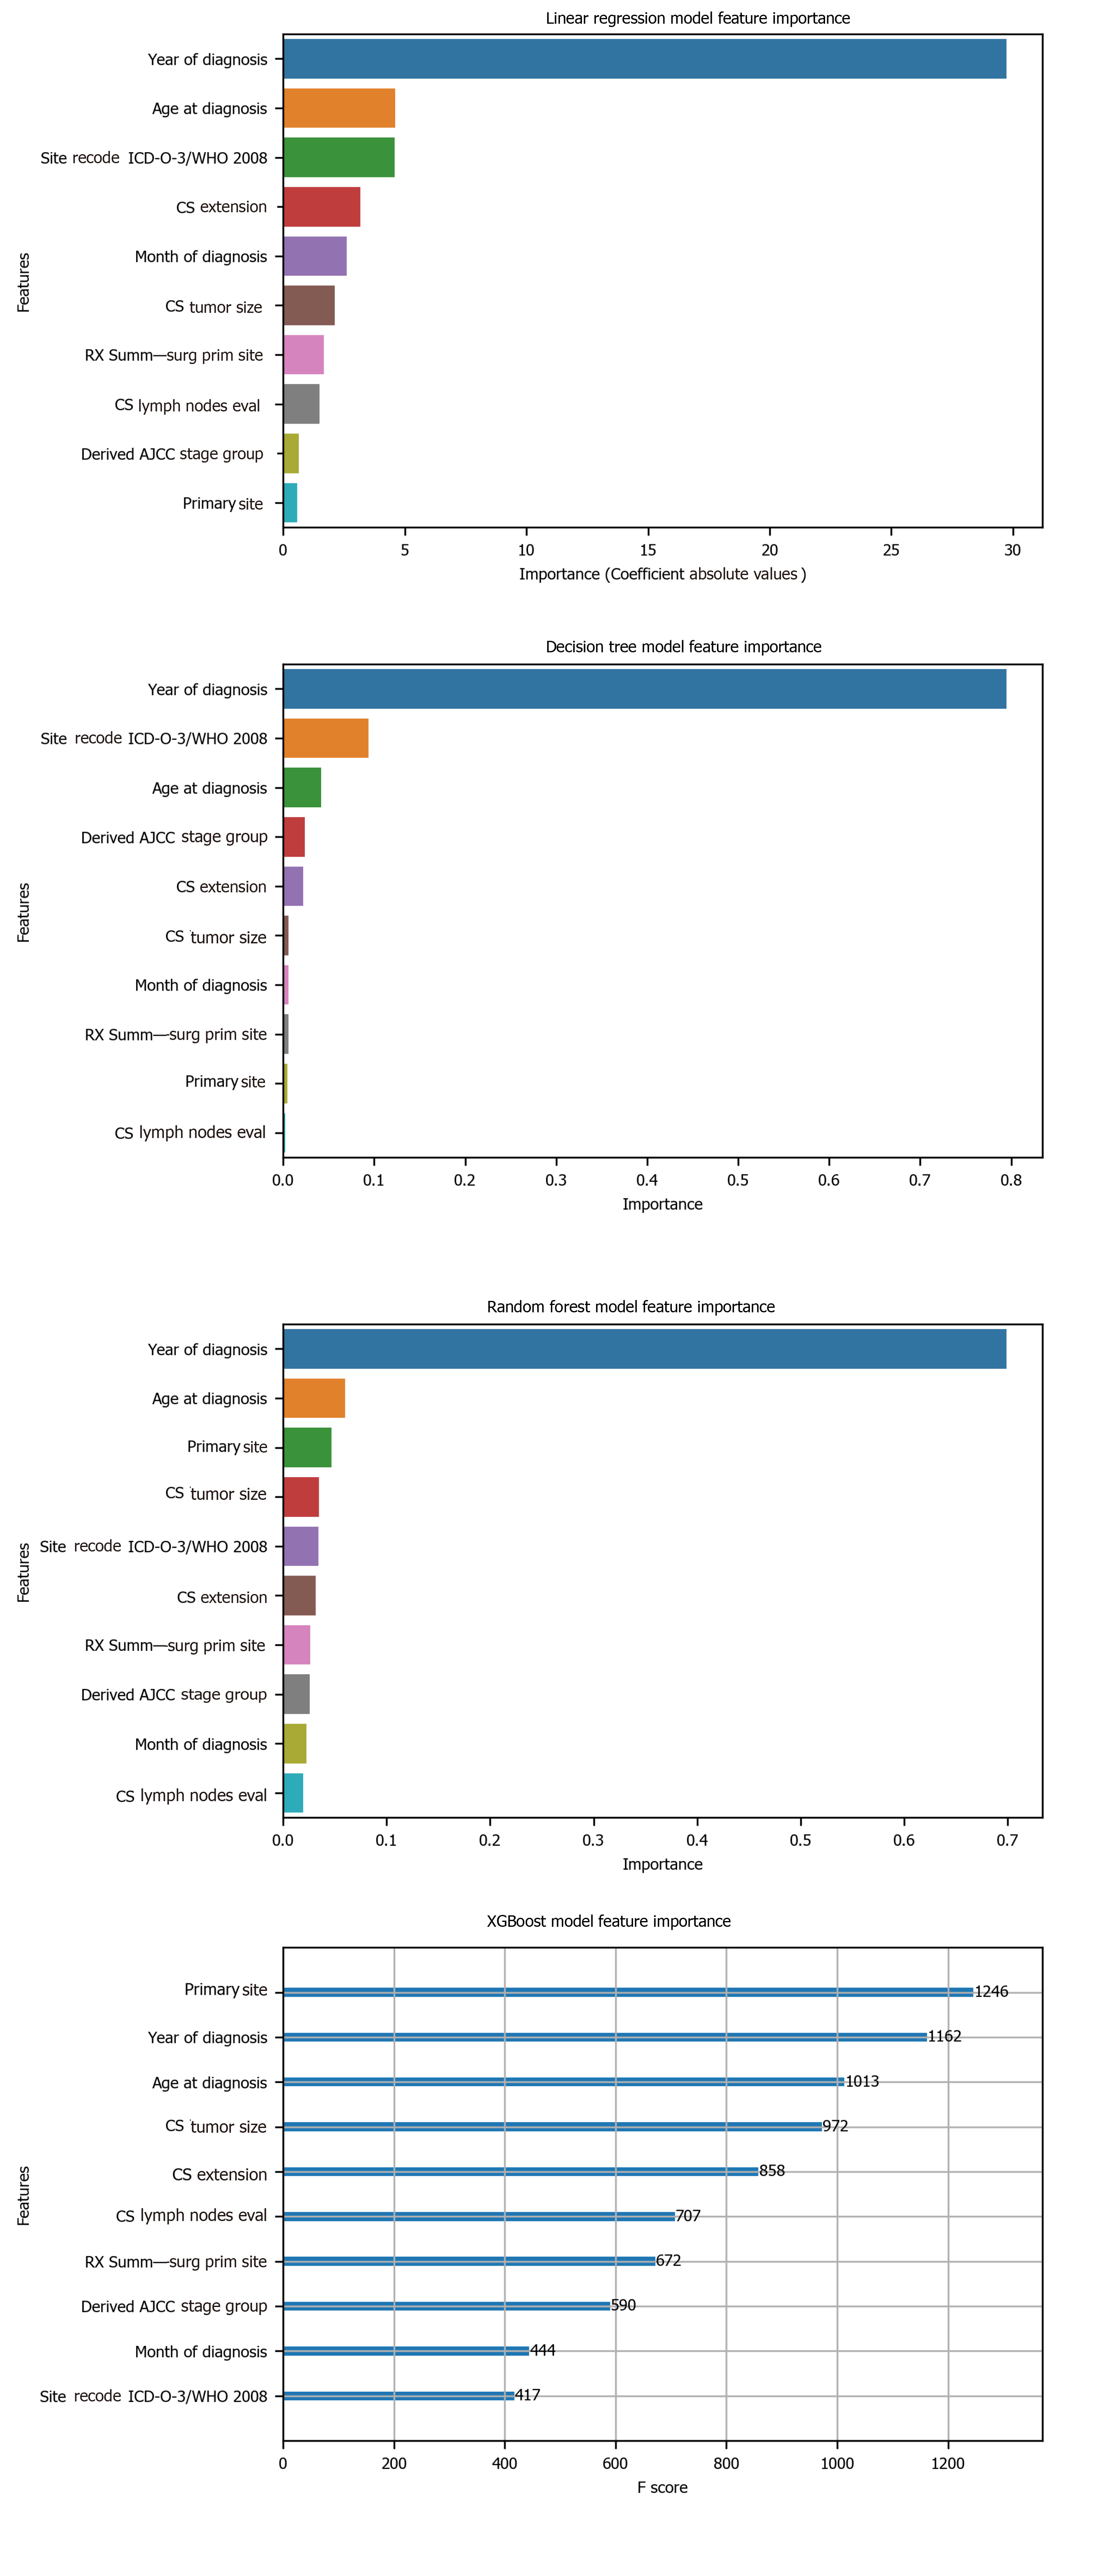
Among the 10 features, several of them showed strong linear relation with survival time (Figure 4). Hence a linear regression model was used to predict outcome. The feature importance can be visualized in Figure 4 showing year of diagnosis as the most important variable. The performance of linear regression was MSE = 647.49, RMSE = 25.45, MAE = 18.21, R2 = 0.620 and adjusted R2 = 0.620 (Table 4).
Decision tree regression, a ML method, was used to determine the top features (i.e., variables) that were predictive of oral cancer survival time. Relative variable importance scores were computed to identify the top predictors. The usage of the decision tree regression was ideal as it doesn’t require linear relationship between features and target variable. Year of diagnosis was found as the most important variable (Figure 5). The performance of the decision tree was MSE = 538.30, RMSE = 23.20, MAE[1] = 14.45, R2 = 0.681 and adjusted R2 = 0.681 (Table 4).
| Variable | Mean | SD | Median | n | % |
| Survival months/mo | 60.35 | 40.98 | 54.00 | ||
| Age at diagnosis/yr | 54.62 | 16.10 | 55.00 | ||
| Tumor size/(ID, cm) | 22.56 | 21.74 | 19.00 | ||
| Marital status | |||||
| Single | 35688 | 20.08 | |||
| Married | 110480 | 62.17 | |||
| Separated | 1746 | 0.98 | |||
| Divorced | 16401 | 9.23 | |||
| Widowed | 13055 | 7.35 | |||
| Unmarried or domestic partner | 344 | 0.19 | |||
| Sex | |||||
| Male | 72179 | 40.62 | |||
| Female | 105535 | 59.38 | |||
| Race | |||||
| White | 148556 | 83.60 | |||
| Black | 16051 | 9.03 | |||
| Other | 13107 | 7.38 |
Among the 10 features, several of them showed strong linear relation with survival time (Figure 4). Hence a linear regression model was used to predict outcome. The feature importance can be visualized in Figure 4 showing year of diagnosis as the most important variable. The performance of linear regression was MSE = 647.49, RMSE = 25.45, MAE = 18.21, R2 = 0.620 and adjusted R2 = 0.620 (Table 4).
| Performance indicators | Linear regression | Decision tree | Random forest | XGBoost |
| MSE | 647.49 | 538.30 | 489.58 | 486.55 |
| RMSE | 25.45 | 23.20 | 22.13 | 22.06 |
| MAE | 18.21 | 14.45 | 13.63 | 13.55 |
| R2 score | 0.620 | 0.681 | 0.709 | 0.711 |
| Adjusted R2 score | 0.620 | 0.681 | 0.709 | 0.711 |
Random forest method was also conducted to develop predictive model. It was appropriate for data with one strong predictor and some moderate predictors. The feature importance for random forest is shown in Figure 4 with year of diagnosis as the most important variable. The performance of the random forest was MSE = 489.58, RMSE = 22.13, MAE = 13.63, R2 = 0.709 and adjusted R2 = 0.709 (Table 4).
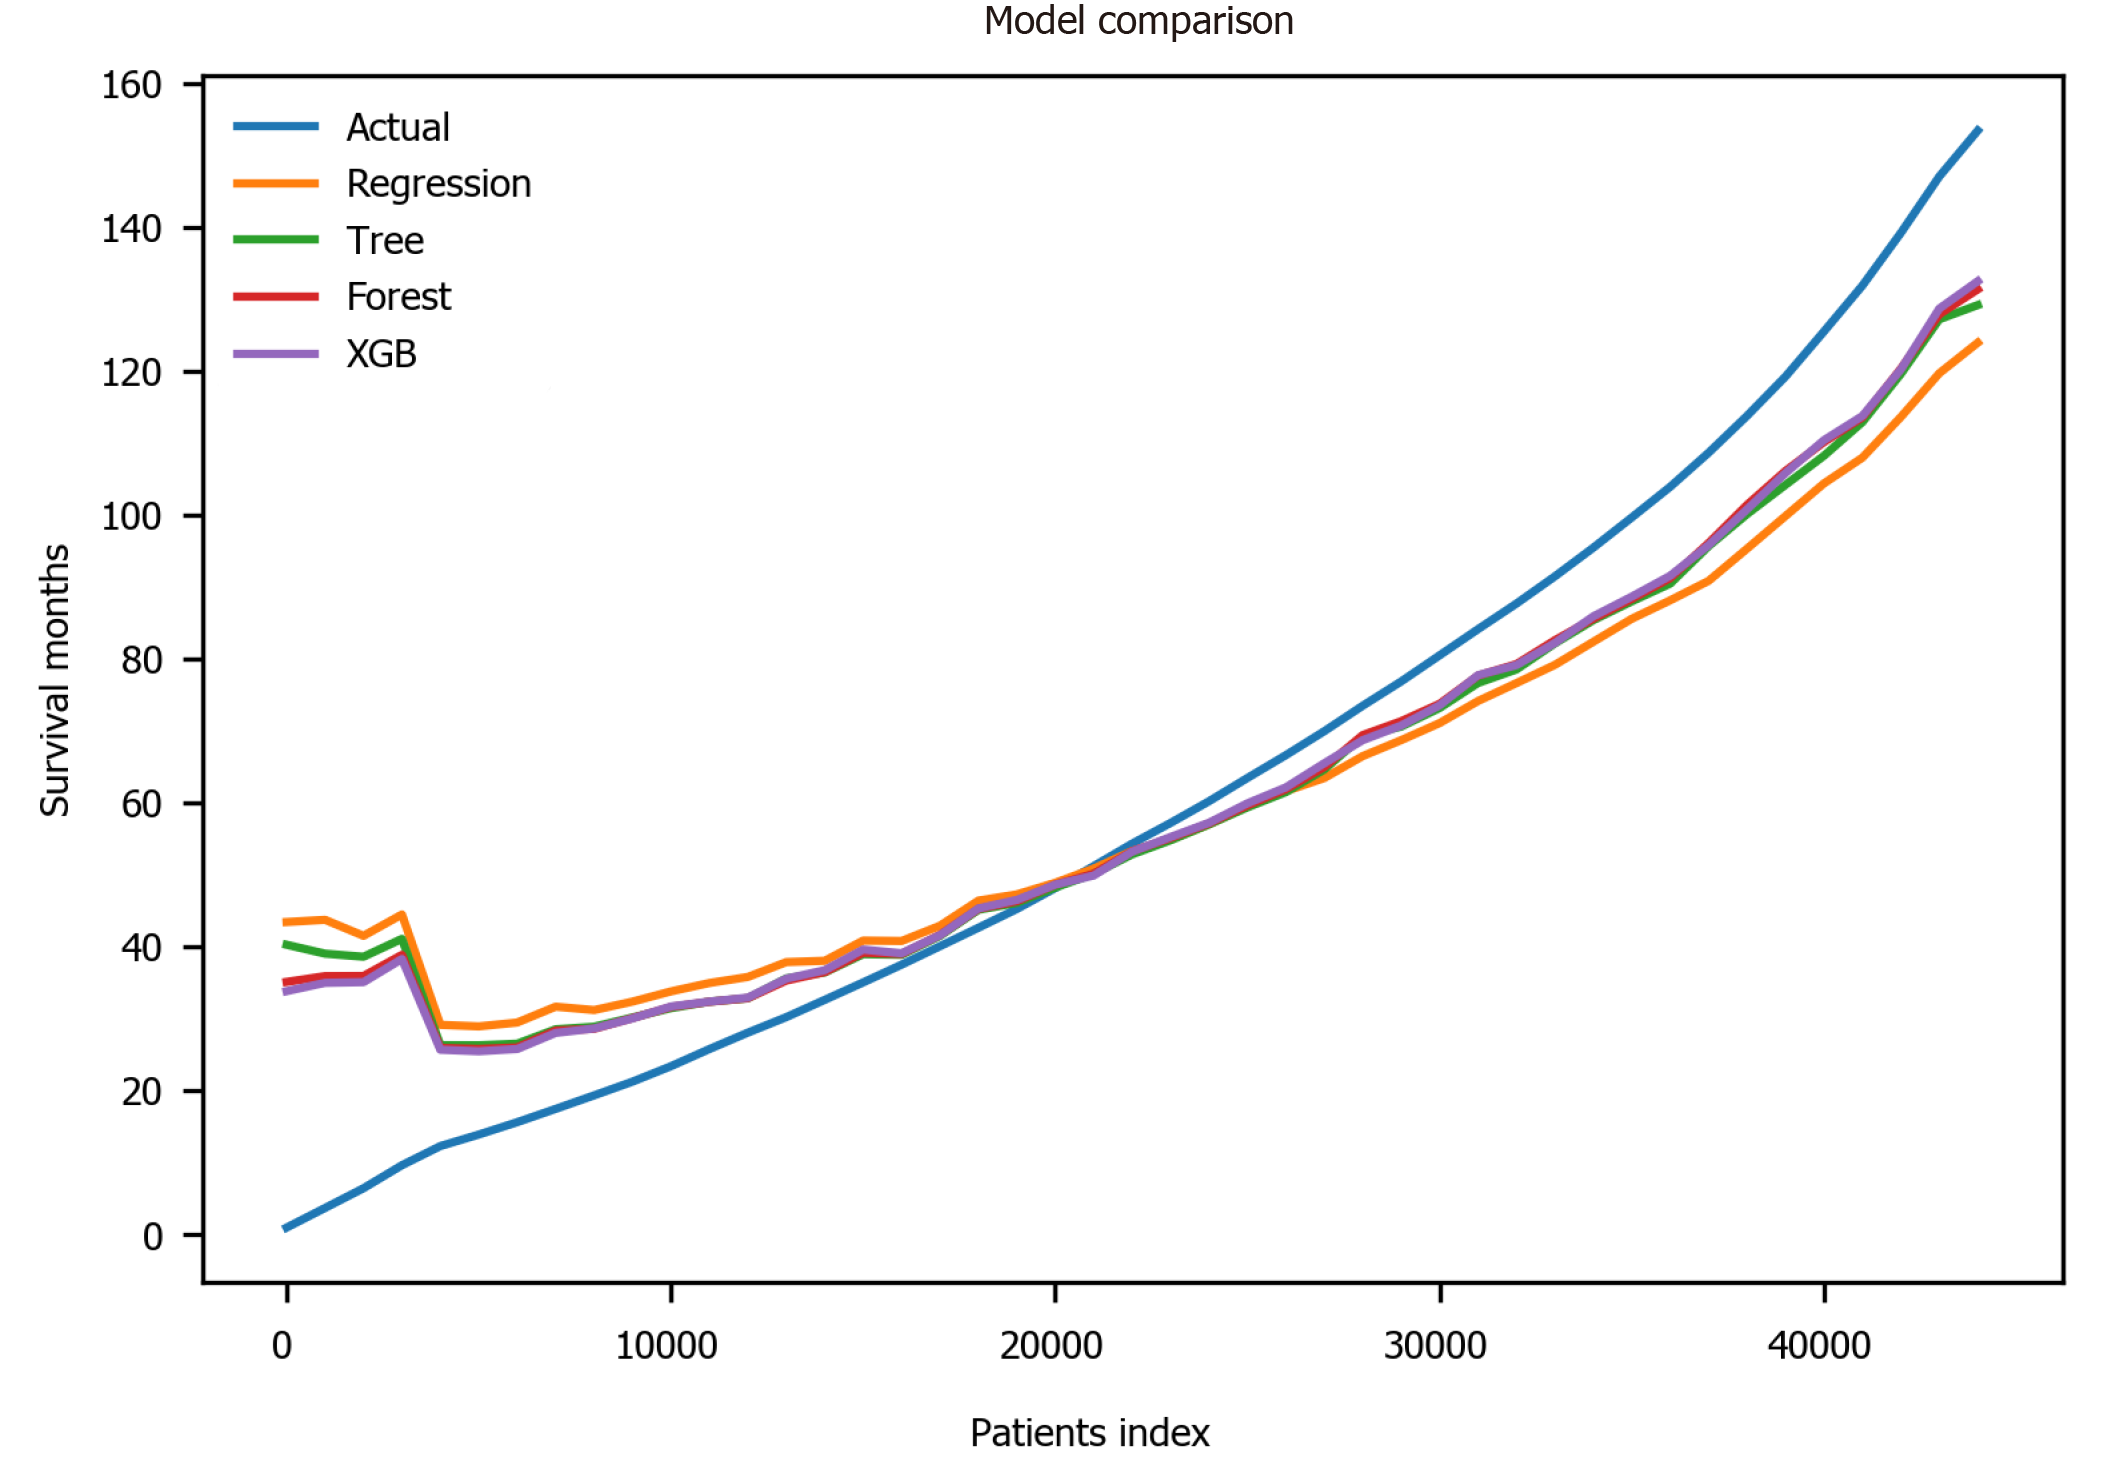
Finally, the XGBoost model was used. The performance of the XGBoost was MSE = 486.55, RMSE = 22.06, MAE = 13.55, R2 = 0.711 and adjusted R2 = 0.711 (Table 4). The feature importance for the XBoost model is presented in Figure 4 showing primary cancer site and year of diagnosis as the top two most important variables for prediction of oral cancer survival. Figure 6 presents a comparison of the prediction of oral cancer survival time from all models against the actual survival time. All model predictions were very similar and close to the actual outcomes. When the survival time was between 40 mo and 60 mo, the predictions were on target with the actual survival time. When it was under 40 mo, the predicted survival time for all models were slightly higher than the actual survival time. However, when it was over 60 mo, the predicted survival time for all models were slightly lower than the actual survival.
The goal of this study was two-fold: (1) To build a ML model predictive of the length of survival for those diagnosed with oral cancer, and (2) To establish the most important factors that predict oral cancer survival. Our results showed that XGBoost was the best model in terms of accuracy. XGBoost’s performance exceeded all other ML methods, with linear regression’s performance slightly trailing behind all models. The average length of survival for all patients was 60.35 mo. Furthermore, age at diagnosis, primary cancer site, tumor size and year of diagnosis were the most important factors related to oral cancer survival. Year of diagnosis was consistently ranking as the top feature across all models. Year of diagnosis was not the number of years nor the amount of time since the tumor was initially diagnosed. Rather, year of diagnosis referred to the year when the tumor was first diagnosed, implying that individuals with tumors that were diagnosed in the modern era tend to have longer survival than those diagnosed in the past.
To our knowledge, this study is the first of its kind to use ML techniques to predict length of survival for those diagnosed with oral cancer. Previous research is consistent with some of our findings. Tumor size, specifically thickness among other tumor size parameters, has been found to be a significant predictor of oral tongue carcinoma survival[25,26]. Younger patients with oral cavity squamous cell cancer[27] and squamous cell carcinoma of the oral tongue[28] have been found to have a higher survival rate in the past which is also consistent with our findings. For cases of squamous cell carcinoma of the oral tongue, a ten-year increase in age was associated with an 18% increase in risk of death[27,28]. However, year of diagnosis was a unique and novel predictive factor that has not been reported in the literature. Considering that our study included 40 plus years-worth of data and incorporated ML for precise prediction, this perhaps makes it possible for discovering new knowledge. It is possible that more recent year of diagnosis leads to the better survival outcomes due to improved oral cancer treatments and public awareness.
This study also revealed some conflicting findings that need further exploration. Although race and ethnicity have been identified as predictors to oral cancer survival in past literature[15], our study using recent data showed low importance of these features, so race and ethnicity were eventually dropped from the model. Given that our study included 40 plus year-worth of data and consisted of recent data, we may see that race and ethnicity are not associated with oral cancer survival over time. Improvements in access to, and utilization of healthcare services among race could also be reasons leading to no or low racial disparities in oral care in the 21st century. Additional large-scale studies using recent data are needed to evaluate these findings.
A primary limitation of this study was that the data did not include psychological factors that could explain survivors’ quality of life. In a future study, we can explore other databases and incorporate surveys to explain the psychological state of oral cancer survivors and overall perspective on the disease. Over 50% of diagnosed oral cancer cases still remain a lethal disease annually[10], early detection and accessibility to regular head and neck examination is key.
This study is particularly important and appropriate for the field of dentistry as the prediction of oral cancer survival can assist dentists, patients and caregivers in disease management and treatment plan development. Identifying oral cancer and gaining a more in depth understanding of the length of survival for those diagnosed with oral cancer and establishing important factors that predict oral cancer survival will better equip health care providers on how to best manage such diagnoses. This study serves as a steppingstone for future exploration using ML and artificial intelligence to uncover the full potential for the management of oral cancers and to reduce healthcare disparities around the globe.
Oral cancer is highly prevalent in the world, yet there is a limited understanding of oral cancer risk factors and survival.
To increase one’s quality of life, it is important to be able to predict oral cancer survival.
The objectives of this study were to build an accurate model to precisely predict the length of oral cancer survival and to explore the most important factors that determine the longevity of oral cancer survivors.
Oral cancer data were obtained from the years 1975 to 2016 in the Surveillance, Epidemiology, and End Results database. Methods from the field of artificial intelligence were applied to build and validate prediction models from 40+ years of oral cancer data representative of the United States’ population.
Age at diagnosis, primary cancer site, tumor size and year of diagnosis were the most important factors related to oral cancer survival. Individuals with tumors that were diagnosed in the modern era tend to have longer survival than those diagnosed in the past, which was a novel finding that had not been reported in the literature.
Machine learning algorithms were developed this study to predict the length of oral cancer survival that can be readily deployed to clinical settings.
This study was the first of its kind to use methods from artificial intelligence to examine the length of survival for individuals diagnosed with oral cancer. The outcome of this study has the potential to reduce healthcare disparities and improve the quality of life for oral cancer survivors and their friends and families around the world.
The authors sincerely thank the Clinical Outcomes Research and Education at College of Dental Medicine, Roseman University of Health Sciences for supporting this study.
| 1. | Xu Z, Neoh KG, Amaechi B, Kishen A. Monitoring bacterial-demineralization of human dentine by electrochemical impedance spectroscopy. J Dent. 2010;38:138-148. [RCA] [PubMed] [DOI] [Full Text] [Cited by in Crossref: 10] [Cited by in RCA: 11] [Article Influence: 0.6] [Reference Citation Analysis (0)] |
| 2. | Mourad M, Jetmore T, Jategaonkar AA, Moubayed S, Moshier E, Urken ML. Epidemiological Trends of Head and Neck Cancer in the United States: A SEER Population Study. J Oral Maxillofac Surg. 2017;75:2562-2572. [RCA] [PubMed] [DOI] [Full Text] [Cited by in Crossref: 148] [Cited by in RCA: 233] [Article Influence: 25.9] [Reference Citation Analysis (0)] |
| 3. | National Cancer Institute: Surveillance, Epidemiology, and End Results Program. SEER*Stat Databases: November 2019 Submission; Incidence - SEER Research Data, 9 Registries, Nov 2019 Sub (1975-2017). 2019. Available from: https://seer.cancer.gov/data-software/documentation/seerstat/nov2019/. |
| 4. | Cruz GD, Le Geros RZ, Ostroff JS, Hay JL, Kenigsberg H, Franklin DM. Oral cancer knowledge, risk factors and characteristics of subjects in a large oral cancer screening program. J Am Dent Assoc. 2002;133:1064-1071. [RCA] [PubMed] [DOI] [Full Text] [Cited by in Crossref: 53] [Cited by in RCA: 54] [Article Influence: 2.3] [Reference Citation Analysis (0)] |
| 5. | McGurk M, Chan C, Jones J, O'regan E, Sherriff M. Delay in diagnosis and its effect on outcome in head and neck cancer. Br J Oral Maxillofac Surg. 2005;43:281-284. [RCA] [PubMed] [DOI] [Full Text] [Cited by in Crossref: 114] [Cited by in RCA: 130] [Article Influence: 6.2] [Reference Citation Analysis (0)] |
| 6. | Swango PA. Cancers of the oral cavity and pharynx in the United States: an epidemiologic overview. J Public Health Dent. 1996;56:309-318. [RCA] [PubMed] [DOI] [Full Text] [Cited by in Crossref: 109] [Cited by in RCA: 94] [Article Influence: 3.1] [Reference Citation Analysis (0)] |
| 7. | Ferlay J, Soerjomataram I, Dikshit R, Eser S, Mathers C, Rebelo M, Parkin DM, Forman D, Bray F. Cancer incidence and mortality worldwide: sources, methods and major patterns in GLOBOCAN 2012. Int J Cancer. 2015;136:E359-E386. [RCA] [PubMed] [DOI] [Full Text] [Cited by in Crossref: 20108] [Cited by in RCA: 20718] [Article Influence: 1883.5] [Reference Citation Analysis (23)] |
| 8. | Dhanuthai K, Rojanawatsirivej S, Thosaporn W, Kintarak S, Subarnbhesaj A, Darling M, Kryshtalskyj E, Chiang CP, Shin HI, Choi SY, Lee SS, Aminishakib P. Oral cancer: A multicenter study. Med Oral Patol Oral Cir Bucal. 2018;23:e23-e29. [RCA] [PubMed] [DOI] [Full Text] [Full Text (PDF)] [Cited by in Crossref: 48] [Cited by in RCA: 120] [Article Influence: 15.0] [Reference Citation Analysis (0)] |
| 9. | Parkin DM, Bray F, Ferlay J, Pisani P. Global cancer statistics, 2002. CA Cancer J Clin. 2005;55:74-108. [RCA] [PubMed] [DOI] [Full Text] [Cited by in Crossref: 13286] [Cited by in RCA: 13561] [Article Influence: 645.8] [Reference Citation Analysis (3)] |
| 10. | Warnakulasuriya S. Global epidemiology of oral and oropharyngeal cancer. Oral Oncol. 2009;45:309-316. [RCA] [PubMed] [DOI] [Full Text] [Cited by in Crossref: 1802] [Cited by in RCA: 2224] [Article Influence: 123.6] [Reference Citation Analysis (0)] |
| 11. | Osazuwa-Peters N, Adjei Boakye E, Hussaini AS, Sujijantarat N, Ganesh RN, Snider M, Thompson D, Varvares MA. Characteristics and predictors of oral cancer knowledge in a predominantly African American community. PLoS One. 2017;12:e0177787. [RCA] [PubMed] [DOI] [Full Text] [Full Text (PDF)] [Cited by in Crossref: 17] [Cited by in RCA: 23] [Article Influence: 2.6] [Reference Citation Analysis (0)] |
| 12. | Ogden GR. Factors Affecting Survival for Oral Cancer. In: Warnakulasuriya S, Greenspan JS. Textbook of Oral Cancer. Textbooks in Contemporary Dentistry. Cham: Springer, 2020: 327-342. [RCA] [DOI] [Full Text] [Cited by in Crossref: 3] [Cited by in RCA: 3] [Article Influence: 0.5] [Reference Citation Analysis (0)] |
| 13. | Sargeran K, Murtomaa H, Safavi SMR, Vehkalahti MM, Teronen O. Survival after diagnosis of cancer of the oral cavity. Br J Oral Maxillofac Surg. 2008;46:187-191. [RCA] [PubMed] [DOI] [Full Text] [Cited by in Crossref: 55] [Cited by in RCA: 55] [Article Influence: 2.9] [Reference Citation Analysis (0)] |
| 14. | National Cancer Institute: Surveillance, Epidemiology, and End Results Program. SEER*Stat Databases: November 2018 Submission, Dictionary of SEER*Stat Variables. 2018. Available from: https://seer.cancer.gov/data-software/documentation/seerstat/nov2018/seerstat-variable-dictionary-nov2018.pdf. |
| 15. | Shiboski CH, Schmidt BL, Jordan RC. Racial disparity in stage at diagnosis and survival among adults with oral cancer in the US. Community Dent Oral Epidemiol. 2007;35:233-240. [RCA] [PubMed] [DOI] [Full Text] [Cited by in Crossref: 57] [Cited by in RCA: 68] [Article Influence: 3.6] [Reference Citation Analysis (0)] |
| 16. | Alcantud JCR, Varela G, Santos-Buitrago B, Santos-García G, Jiménez MF. Analysis of survival for lung cancer resections cases with fuzzy and soft set theory in surgical decision making. PLoS One. 2019;14:e0218283. [RCA] [PubMed] [DOI] [Full Text] [Full Text (PDF)] [Cited by in Crossref: 30] [Cited by in RCA: 19] [Article Influence: 2.7] [Reference Citation Analysis (0)] |
| 17. | National Cancer Institute: Surveillance, Epidemiology, and End Results Program. About the SEER Registries. 2020. Available from: https://seer.cancer.gov/registries/. |
| 18. | National Cancer Institute: Surveillance, Epidemiology, and End Results Program. ICD-O-3 Site Codes. 2020. Available from: https://training.seer.cancer.gov/head-neck/abstract-code-stage/codes.html. |
| 19. | National Cancer Institute: Surveillance, Epidemiology, and End Results Program. SEER Combined/AJCC Cancer Staging. 2020. Available from: http://seer.cancer.gov/seerstat/variables/seer/ajcc-stage. |
| 20. | National Cancer Institute: Surveillance, Epidemiology, and End Results Program. Site Recode ICD-O-3/WHO 2008 Definition. 2020. Available from: http://seer.cancer.gov/siterecode/icdo3_dwhoheme/index.html. |
| 21. | National Cancer Institute: Surveillance, Epidemiology, and End Results Program. Months Survived Based on Complete Dates, Calculation of Survival Time Fields. 2013. Available from: https://seer.cancer.gov/survivaltime/SurvivalTimeCalculation.pdf. |
| 22. | National Cancer Institute: Surveillance, Epidemiology, and End Results Program. Months Survived Based on Complete Dates. 2013. Available from: https://seer.cancer.gov/survivaltime/. |
| 23. | Tshering Vogel DW, Zbaeren P, Thoeny HC. Cancer of the oral cavity and oropharynx. Cancer Imaging. 2010;10:62-72. [RCA] [PubMed] [DOI] [Full Text] [Full Text (PDF)] [Cited by in Crossref: 37] [Cited by in RCA: 52] [Article Influence: 3.3] [Reference Citation Analysis (0)] |
| 24. | National Cancer Institute: Surveillance, Epidemiology, and End Results Program. Cancer Stat Facts: Laryngeal Cancer. 2020. Available from: https://seer.cancer.gov/statfacts/html/laryn.html. |
| 25. | Gonzalez-Moles MA, Esteban F, Rodriguez-Archilla A, Ruiz-Avila I, Gonzalez-Moles S. Importance of tumour thickness measurement in prognosis of tongue cancer. Oral Oncol. 2002;38:394-397. [RCA] [PubMed] [DOI] [Full Text] [Cited by in Crossref: 95] [Cited by in RCA: 96] [Article Influence: 4.0] [Reference Citation Analysis (0)] |
| 26. | Yuen AP, Lam KY, Wei WI, Lam KY, Ho CM, Chow TL, Yuen WF. A comparison of the prognostic significance of tumor diameter, length, width, thickness, area, volume, and clinicopathological features of oral tongue carcinoma. Am J Surg. 2000;180:139-143. [RCA] [PubMed] [DOI] [Full Text] [Cited by in Crossref: 157] [Cited by in RCA: 153] [Article Influence: 5.9] [Reference Citation Analysis (0)] |
| 27. | Goldenberg D, Brooksby C, Hollenbeak CS. Age as a determinant of outcomes for patients with oral cancer. Oral Oncol. 2009;45:e57-e61. [RCA] [PubMed] [DOI] [Full Text] [Cited by in Crossref: 32] [Cited by in RCA: 34] [Article Influence: 2.0] [Reference Citation Analysis (0)] |
| 28. | Davidson BJ, Root WA, Trock BJ. Age and survival from squamous cell carcinoma of the oral tongue. Head Neck. 2001;23:273-279. [RCA] [PubMed] [DOI] [Full Text] [Cited by in Crossref: 62] [Cited by in RCA: 59] [Article Influence: 2.4] [Reference Citation Analysis (0)] |
Open-Access: This article is an open-access article that was selected by an in-house editor and fully peer-reviewed by external reviewers. It is distributed in accordance with the Creative Commons Attribution NonCommercial (CC BY-NC 4.0) license, which permits others to distribute, remix, adapt, build upon this work non-commercially, and license their derivative works on different terms, provided the original work is properly cited and the use is non-commercial. See: http://creativecommons.org/Licenses/by-nc/4.0/
Manuscript source: Unsolicited manuscript
Specialty type: Oncology
Country/Territory of origin: United States
Peer-review report’s scientific quality classification
Grade A (Excellent): A
Grade B (Very good): 0
Grade C (Good): 0
Grade D (Fair): 0
Grade E (Poor): 0
P-Reviewer: Santos-García G S-Editor: Chen XF L-Editor: A P-Editor: Wang LL
Figure legends
Figure
Figure
Figure
Figure
Figure
Figure


