©The Author(s) 2016.
World J Clin Oncol. Apr 10, 2016; 7(2): 234-242
Published online Apr 10, 2016. doi: 10.5306/wjco.v7.i2.234
Published online Apr 10, 2016. doi: 10.5306/wjco.v7.i2.234
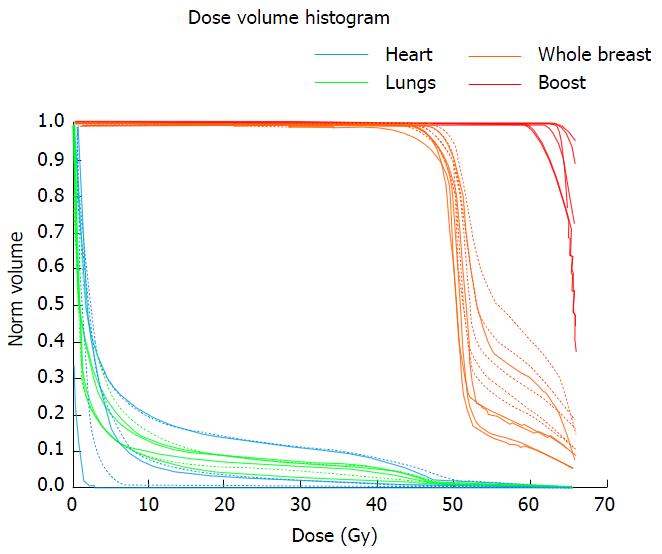
Figure 1 Dose-volume histograms for patients treated with a single boost (continuous lines) and with a double boost (dashed lines).
The percentage of breast receiving 60 Gy or more with a single boost varies from 10% to 29% (median 15%, mean 16%) and with a double boost from 19% to 39% (median 25%, mean 27%).
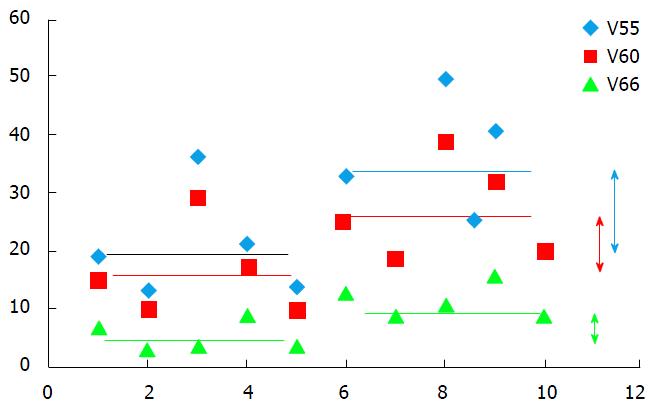
Figure 2 Volume of whole breast receiving an increased dose according to the dose-level.
On the left side of the figure are reported the amount of breast receiving 66 Gy (green), 60 Gy (red) or 55 Gy (blue), in patients treated with a single boost (first 5 patients); on the right side of the figure are reported the amount of breast receiving 66 Gy, 60 Gy or 55 Gy, in patients treated with a double boost. The double arrows show the magnitude of increasing dose from single to double boost, according to dose level.
- Citation: Houvenaeghel G, Tallet A, Jalaguier-Coudray A, Cohen M, Bannier M, Jauffret-Fara C, Lambaudie E. Is breast conservative surgery a reasonable option in multifocal or multicentric tumors? World J Clin Oncol 2016; 7(2): 234-242
- URL: https://www.wjgnet.com/2218-4333/full/v7/i2/234.htm
- DOI: https://dx.doi.org/10.5306/wjco.v7.i2.234


