
















Copyright: ©Author(s) 2026.
World J Clin Oncol. Aug 24, 2026; 17(8): 122421
Published online Aug 24, 2026. doi: 10.5306/wjco.122421
Published online Aug 24, 2026. doi: 10.5306/wjco.122421
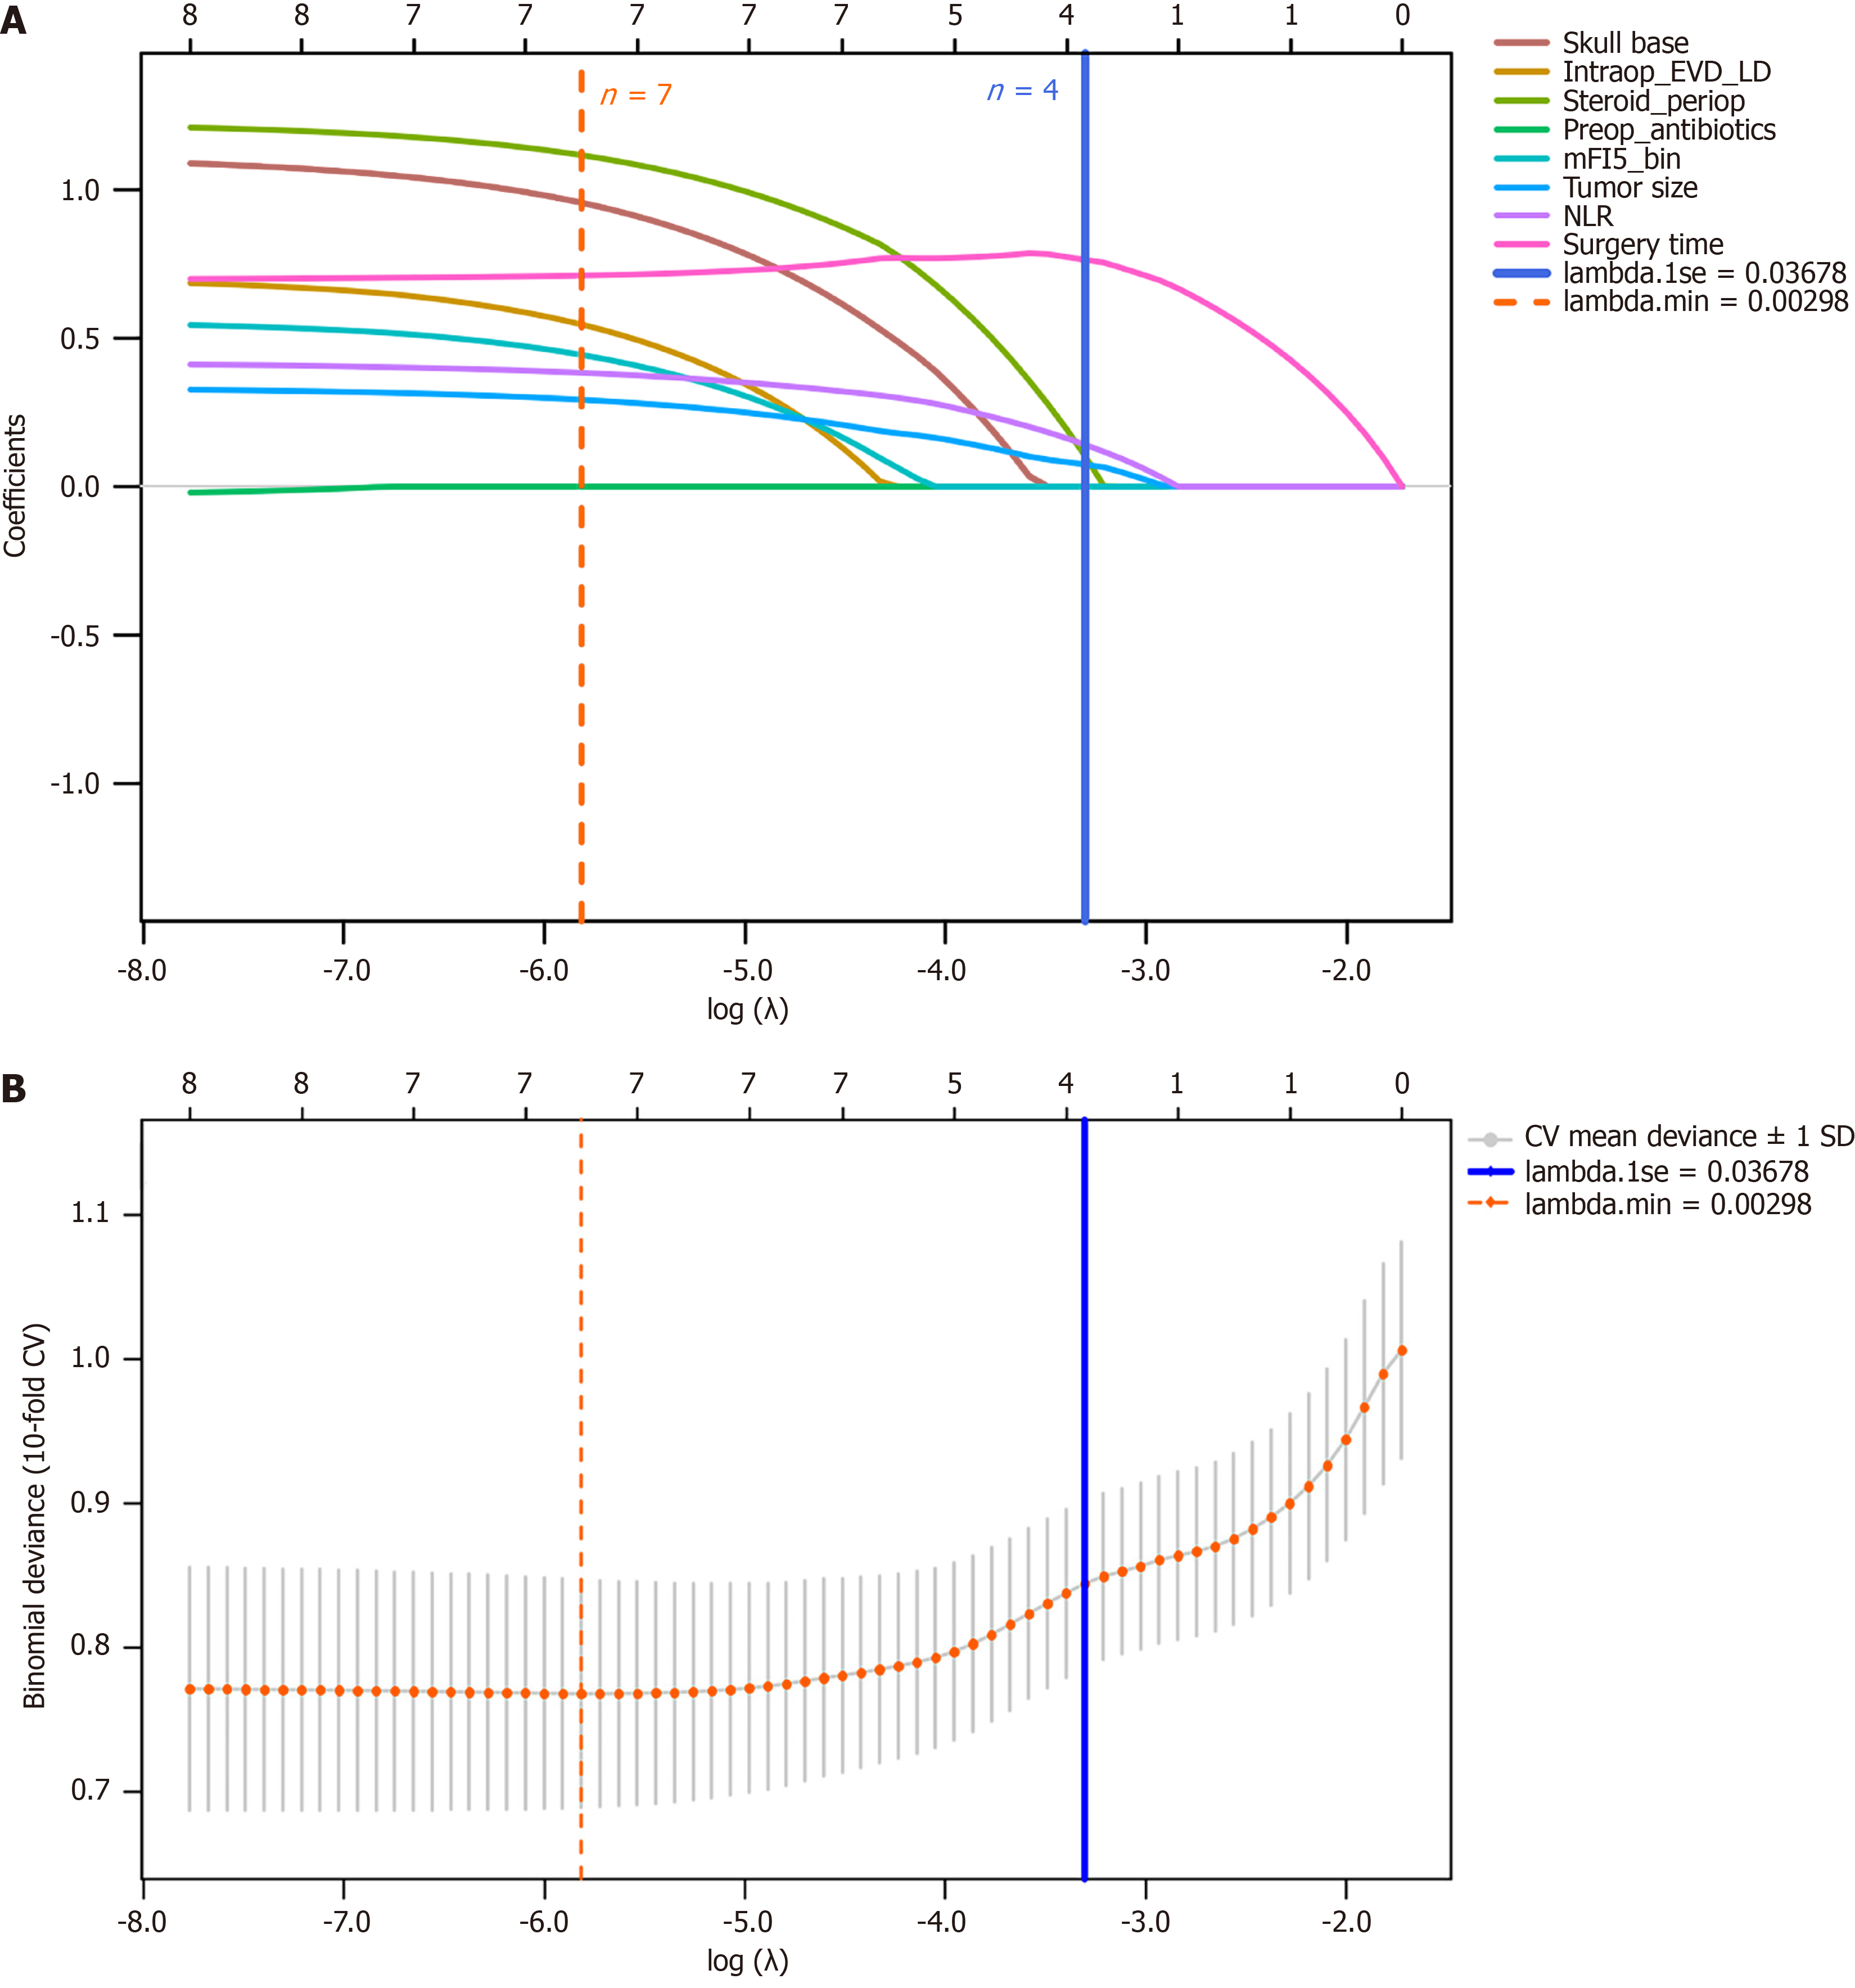
Figure 1 Variable selection by Least Absolute Shrinkage and Selection Operator regression (representative results from imputed dataset 1).
A: Least Absolute Shrinkage and Selection Operator coefficient profiles across the regularization path; B: Cross-validation curve for tuning the penalty parameter; 7 variables were selected under the minimum criterion and 4 under the 1-standard-error criterion. Final model variables were determined by selection frequency across all 10 imputed datasets (Supplementary Figure 1). lambda.min: Lambda. minimum; lambda.1se: Lambda. 1-standard-error; NLR: Nutritional risk index.
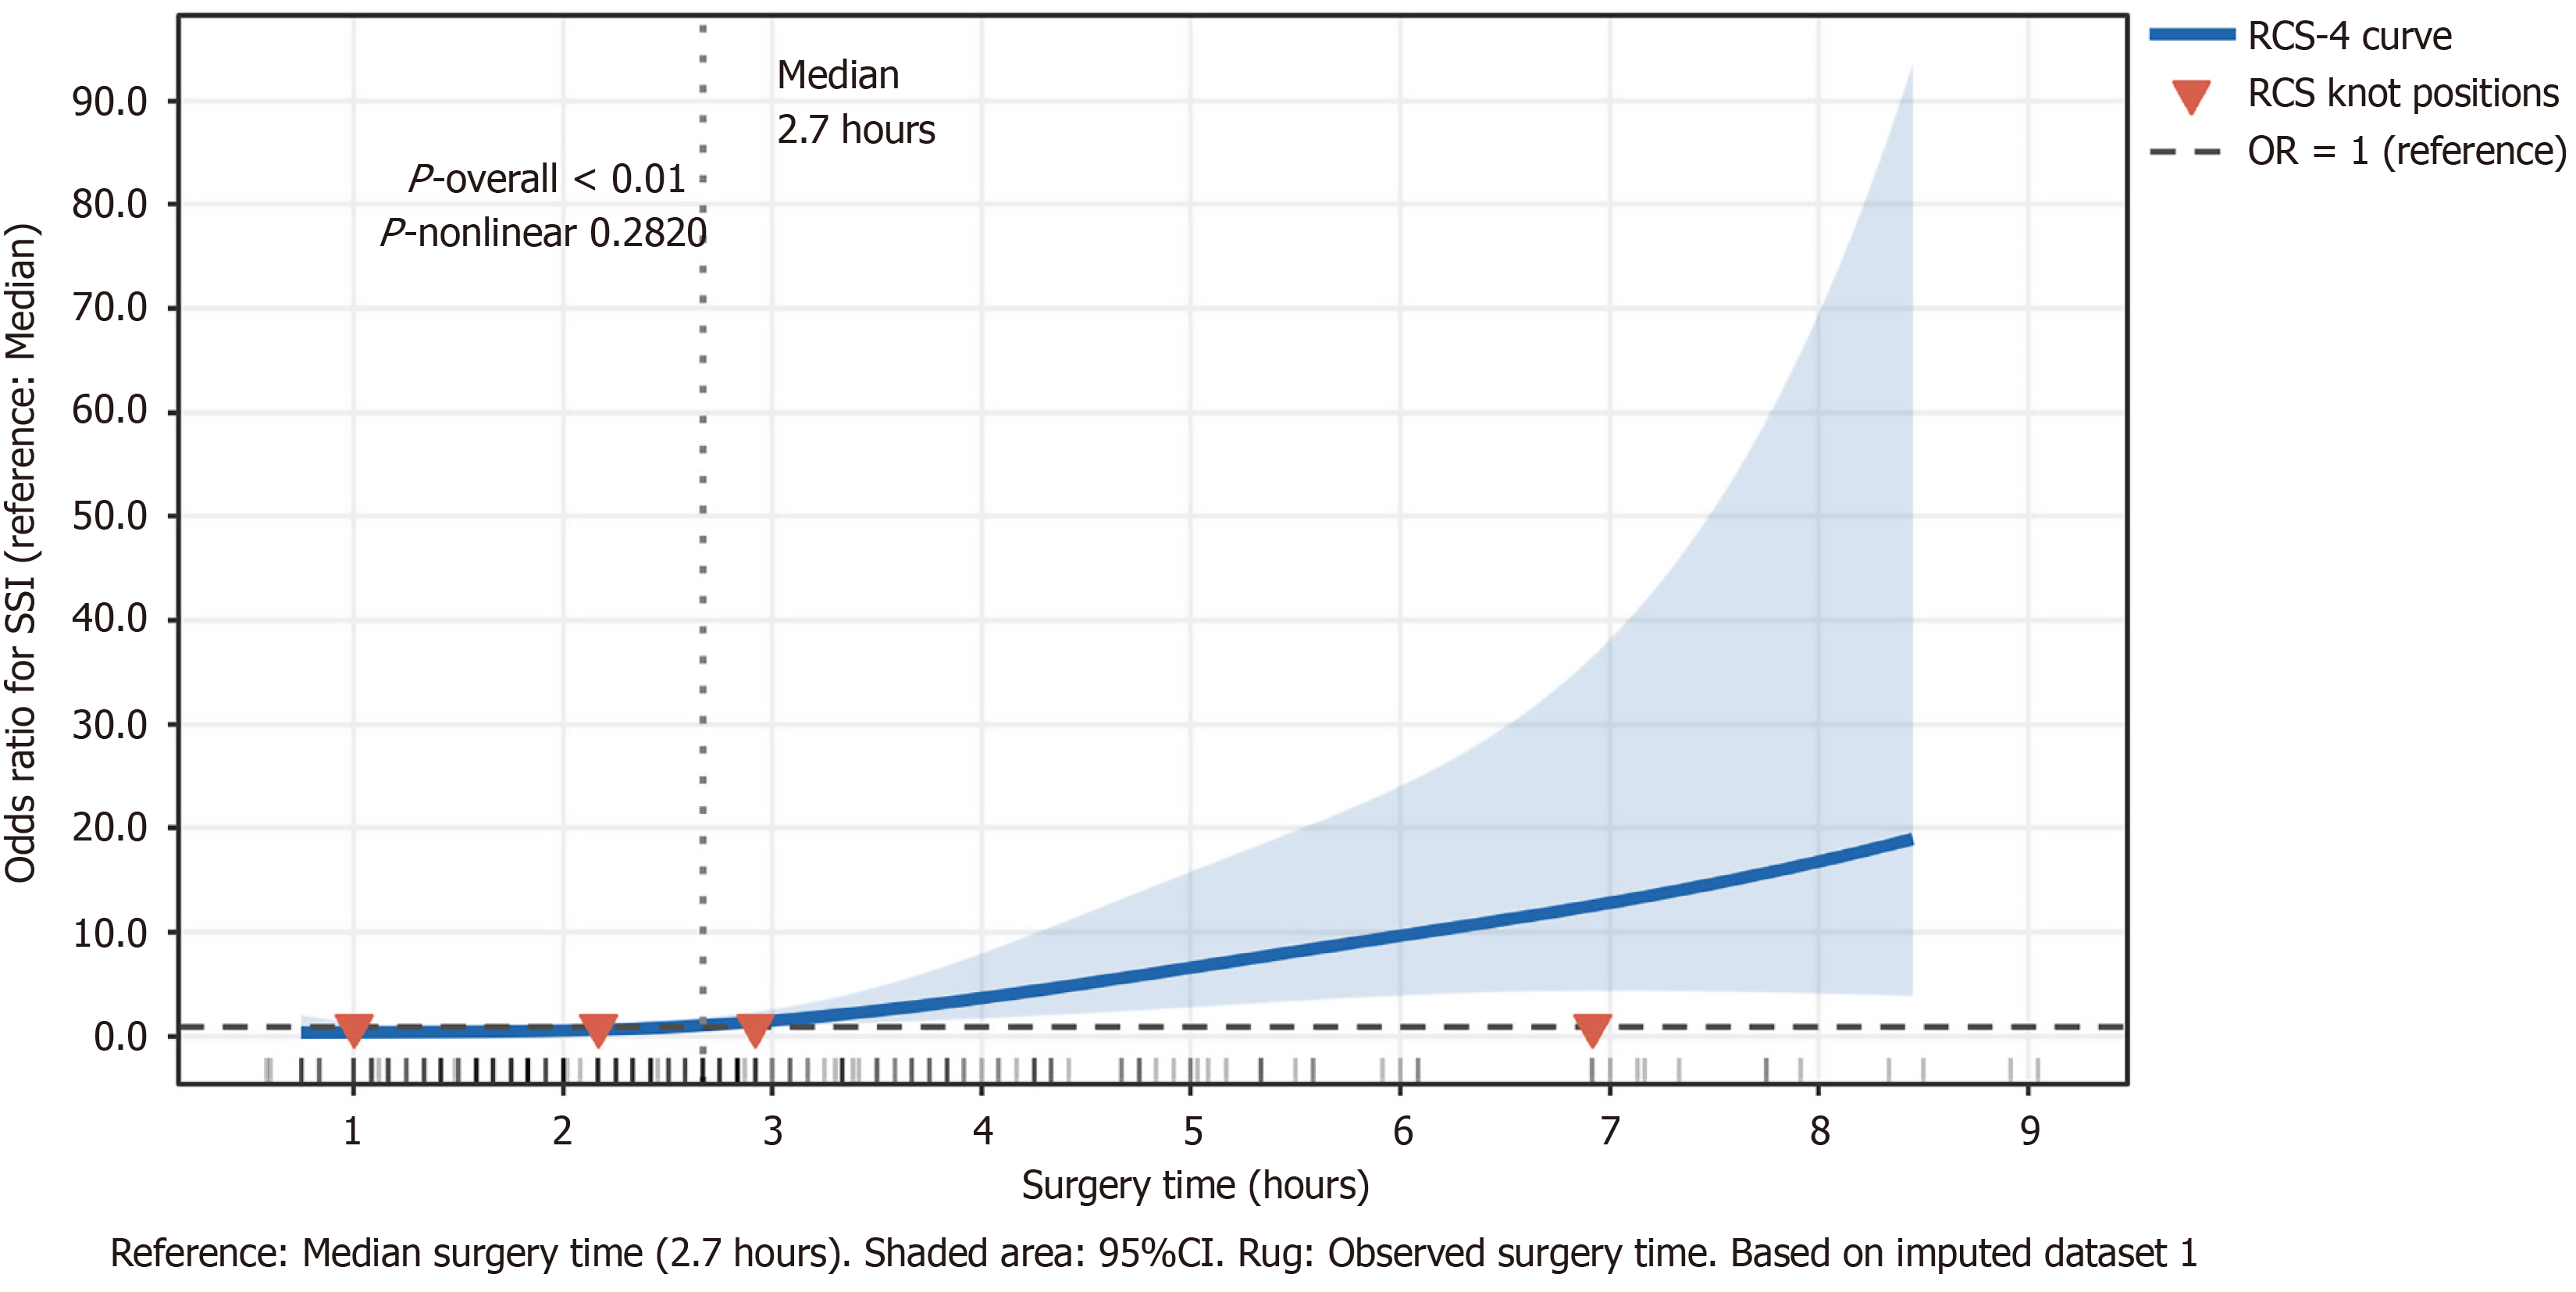
Figure 2 Restricted cubic spline of the association between surgery time (hours) and surgical site infection risk.
The solid line indicates the estimated odds ratio and the shaded area the 95% confidence interval. SSI: Surgical site infection; RCS: Restricted cubic splines; OR: Odds ratio; CI: Confidence interval; Rug: Rug marks.
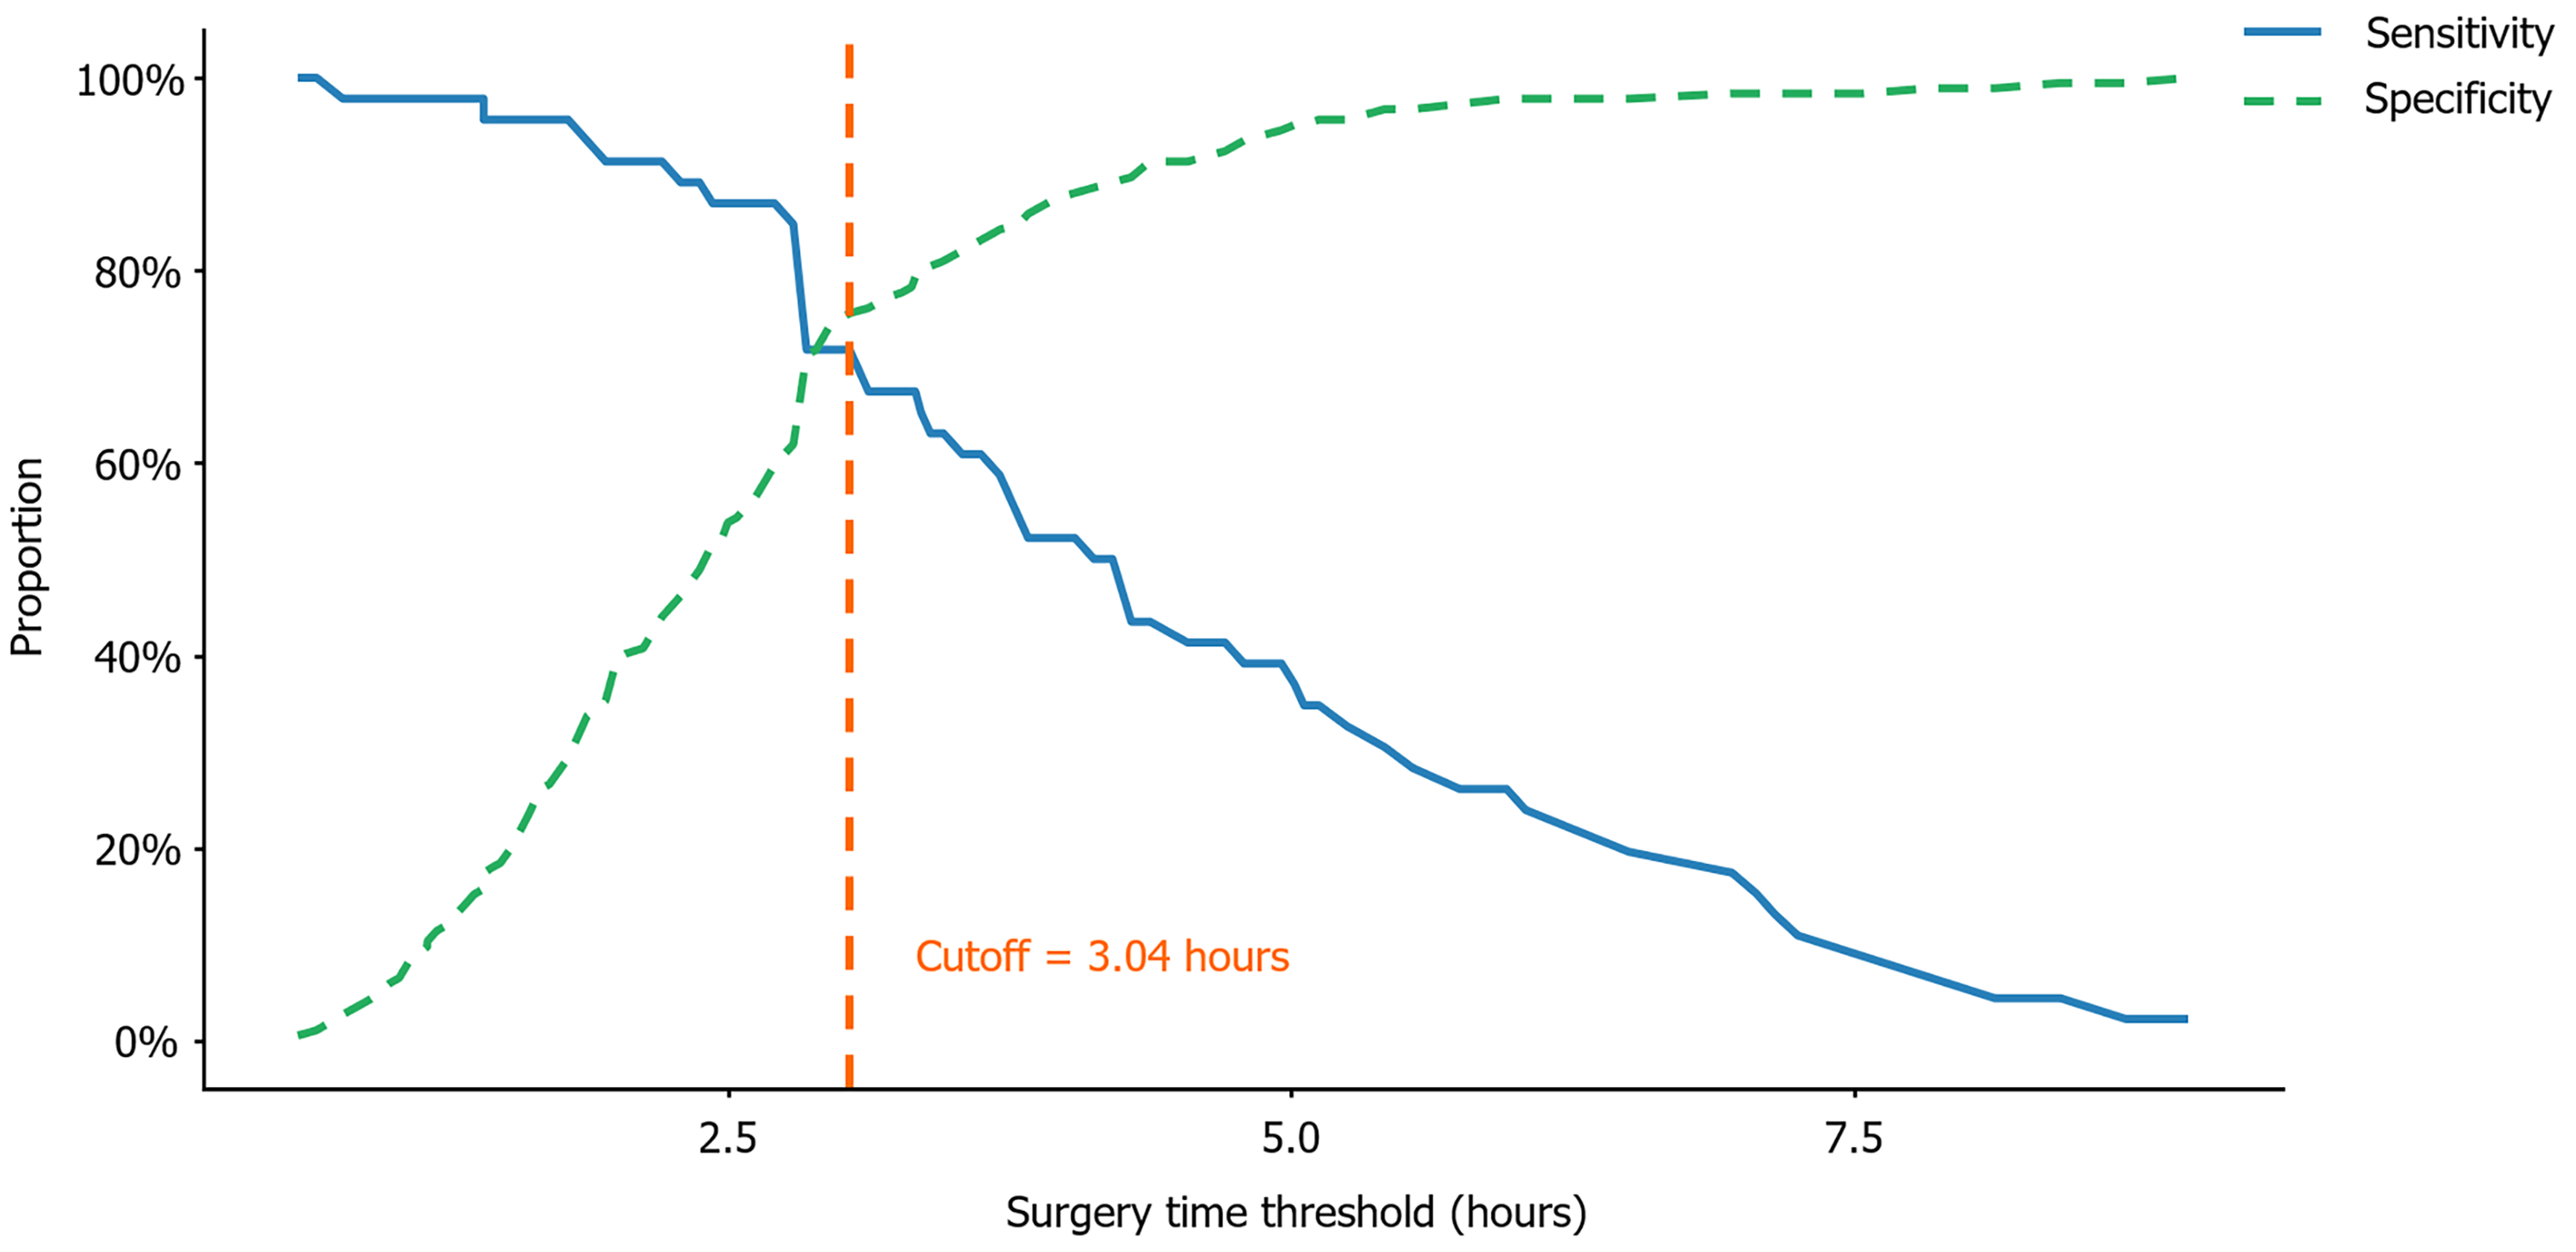
Figure 3
Sensitivity and specificity across surgery time thresholds.
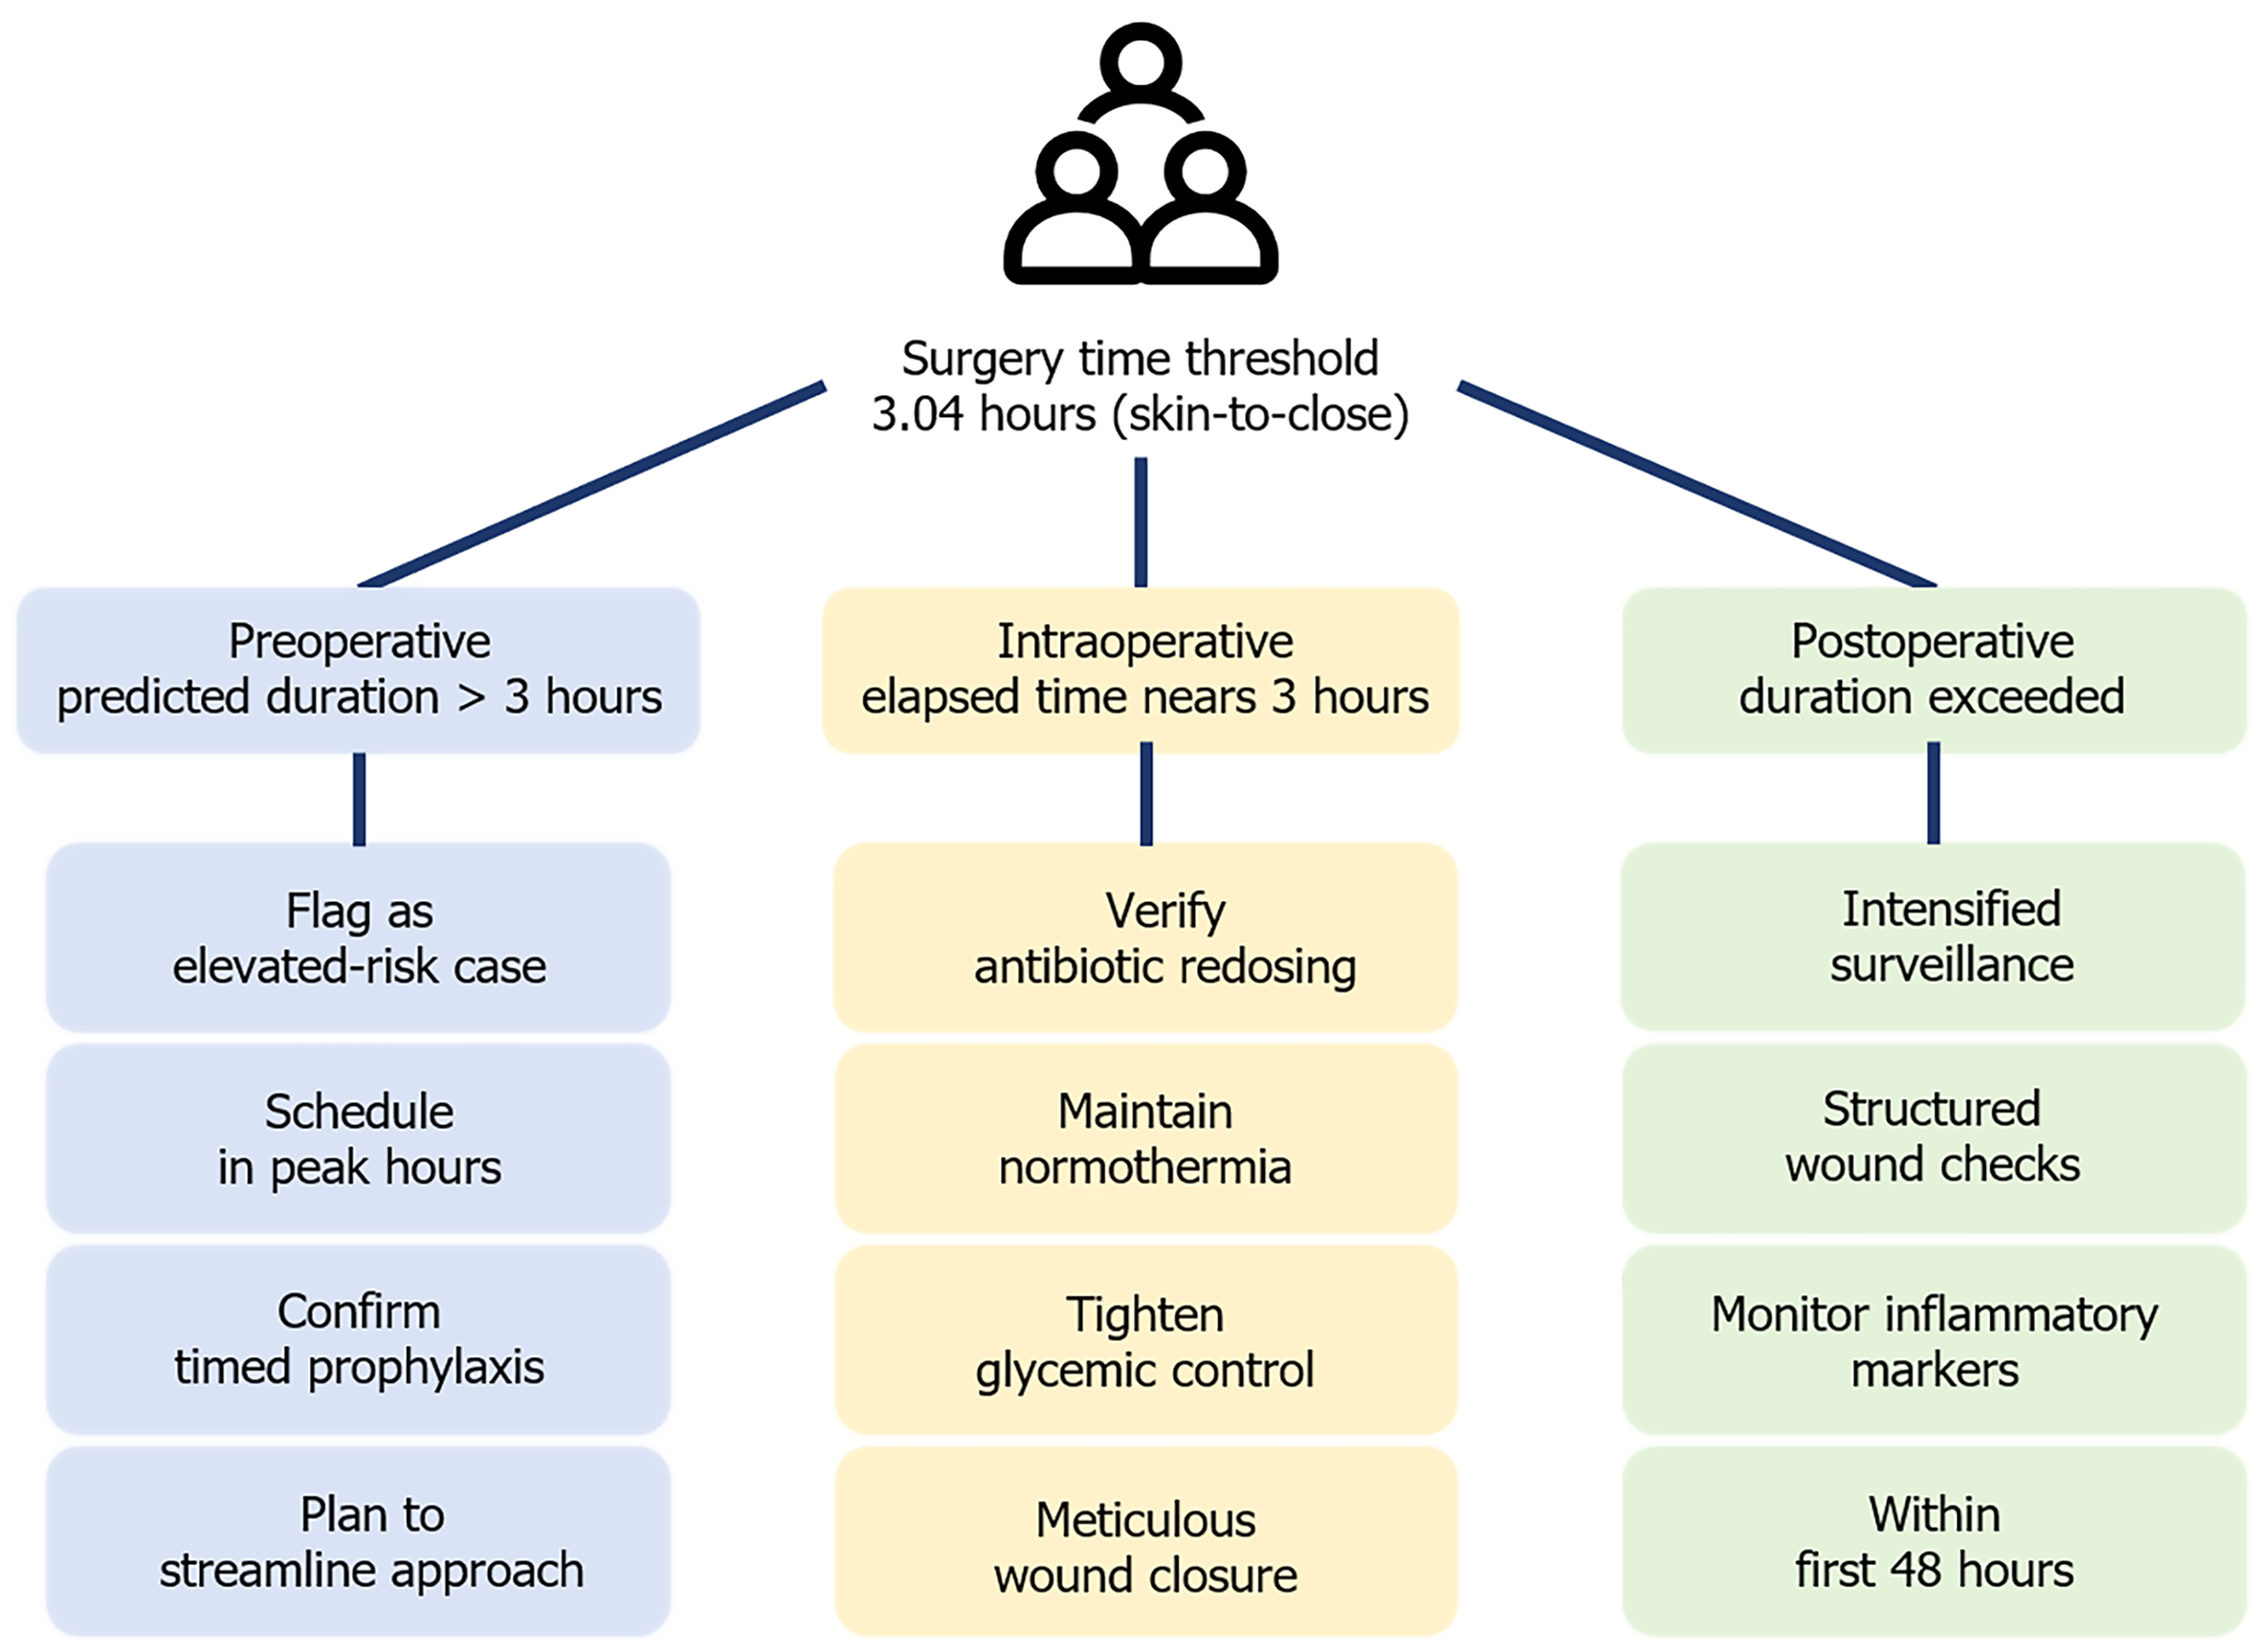
Figure 4
Proposed perioperative workflow for the 304-hour surgery-time threshold (illustrative; pending prospective validation).
- Citation: Wang H, He YL, Gao Y, Gao XR, Sun LY, Yan JC, Lu Q, Ni KW. Risk factors for surgical site infection after craniotomy for meningioma resection in a tertiary hospital in China. World J Clin Oncol 2026; 17(8): 122421
- URL: https://www.wjgnet.com/2218-4333/full/v17/i8/122421.htm
- DOI: https://dx.doi.org/10.5306/wjco.122421