©The Author(s) 2025.
World J Clin Oncol. May 24, 2025; 16(5): 105881
Published online May 24, 2025. doi: 10.5306/wjco.v16.i5.105881
Published online May 24, 2025. doi: 10.5306/wjco.v16.i5.105881
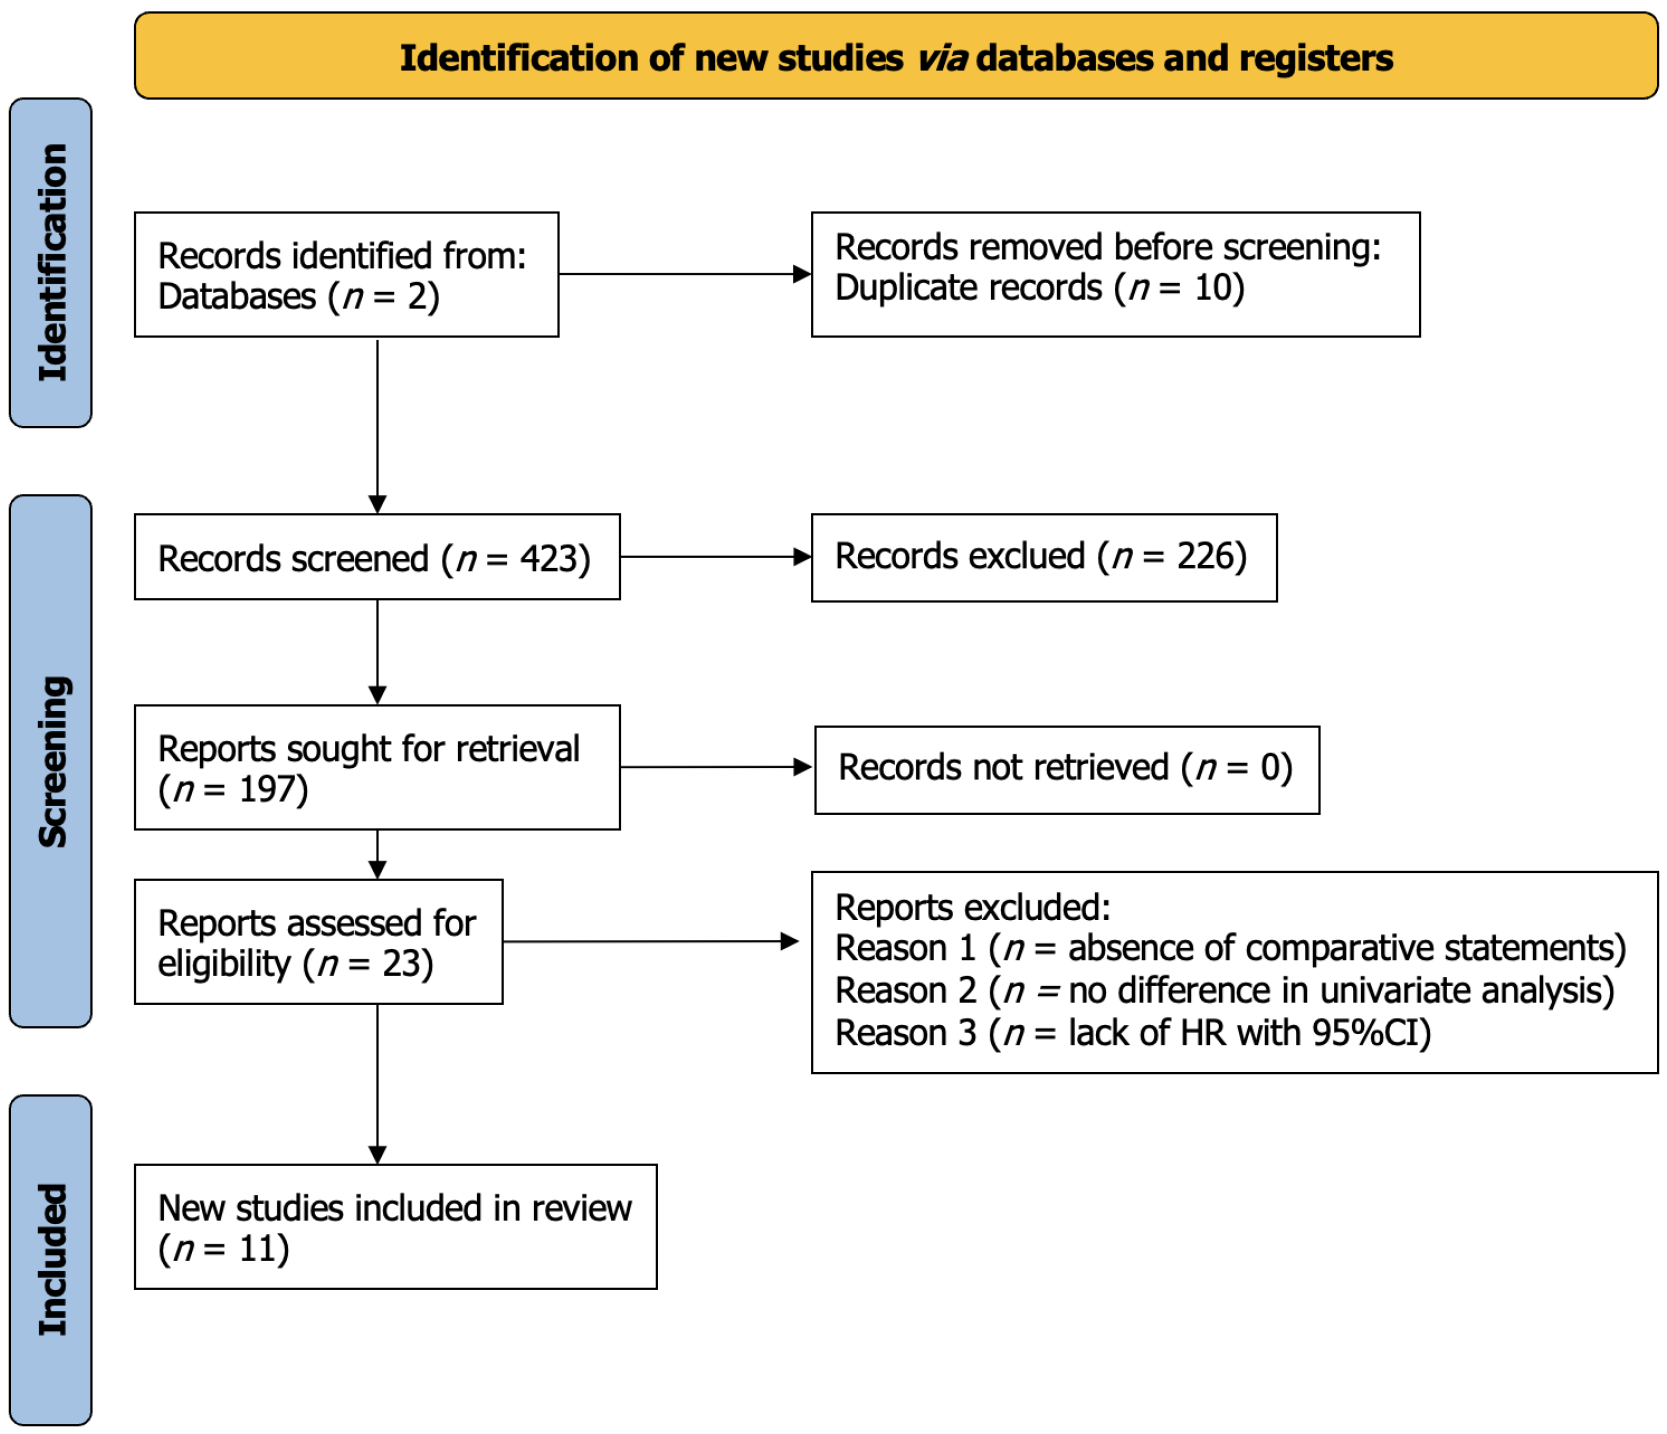
Figure 1 Preferred reporting items for systematic reviews and meta-analyses flow diagram for study selection process.
Flowchart depicting the selection process of studies included in the meta-analysis. The diagram outlines the number of records identified, screened, assessed for eligibility, and ultimately included in the final analysis, with reasons for exclusion specified. HR: Hazard ratio; CI: Confidence interval.
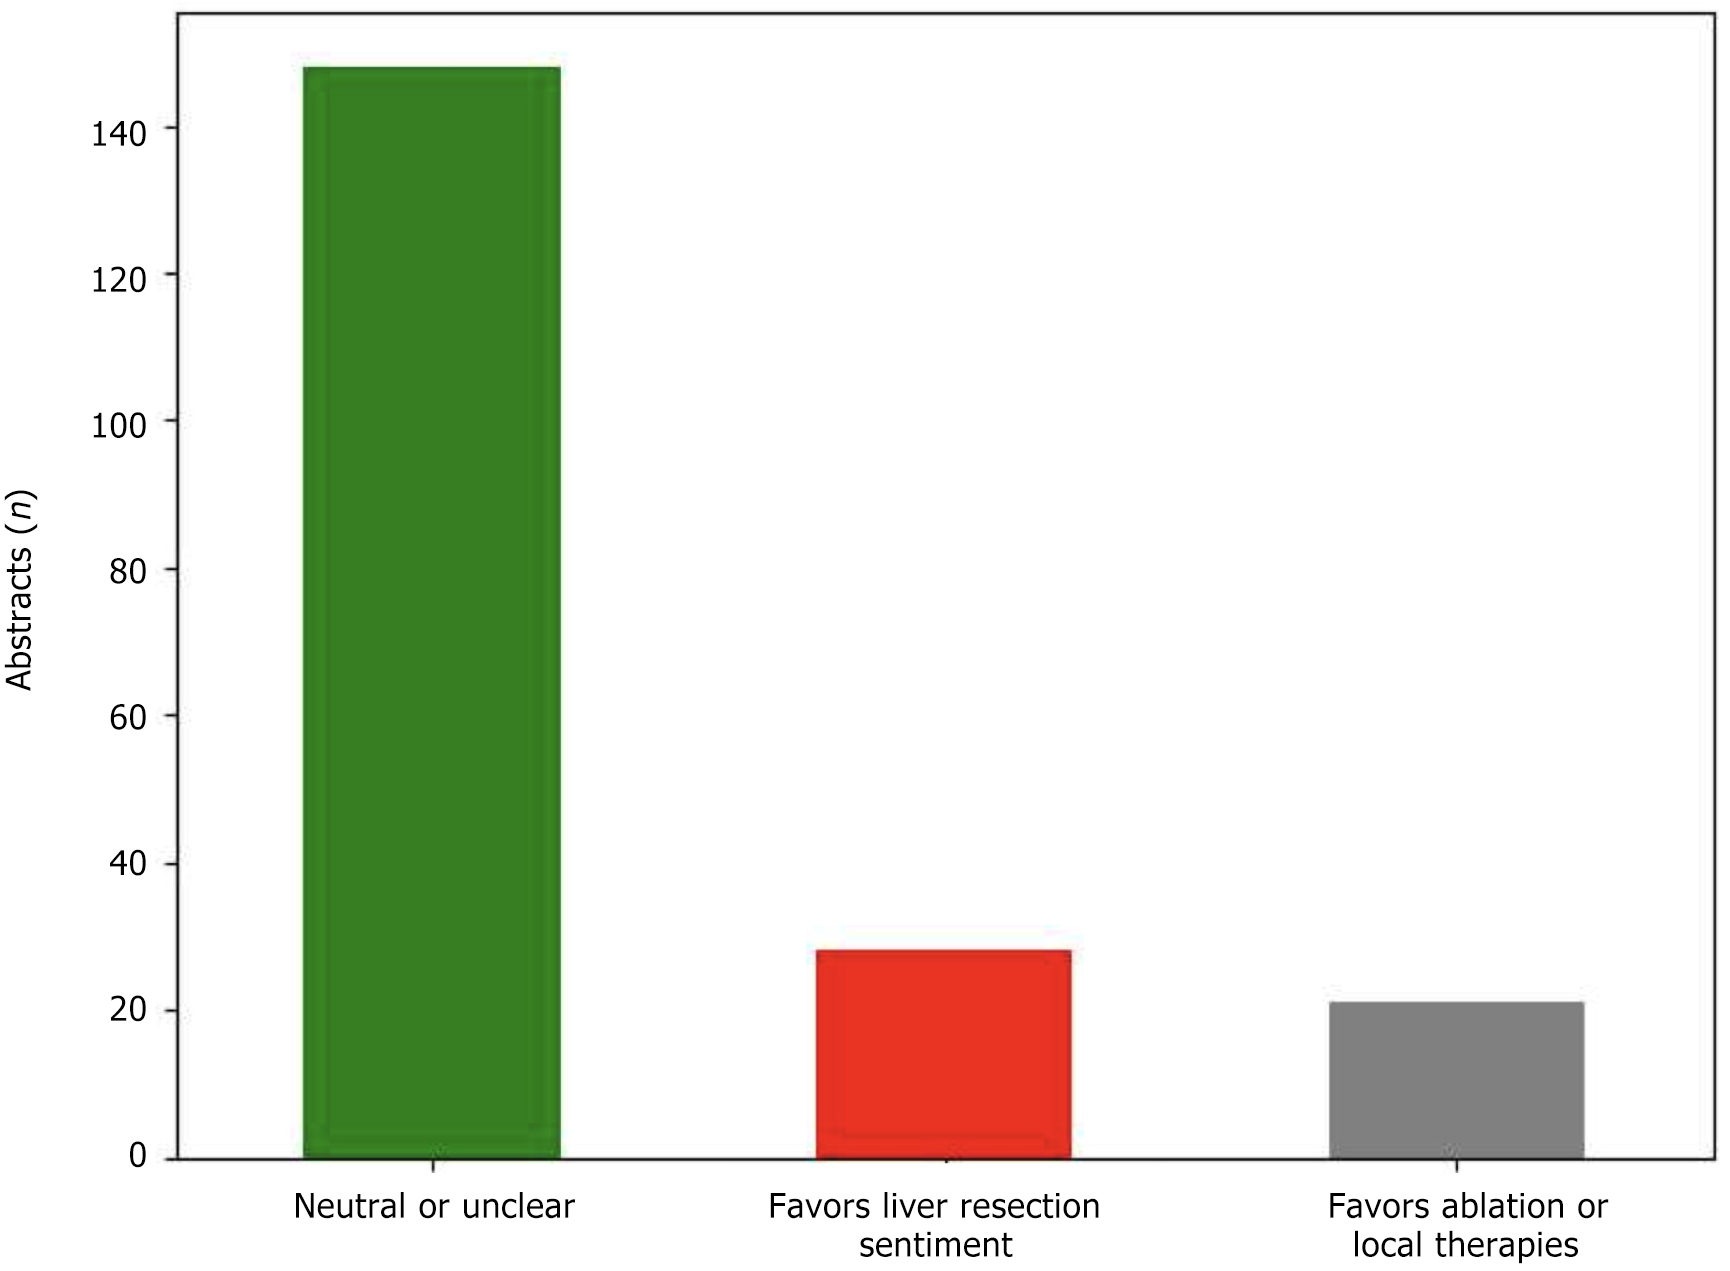
Figure 2 Sentiment distribution across study abstracts.
Bar chart showing the frequency of each sentiment category in the dataset of 197 study abstracts comparing liver resection and ablation.
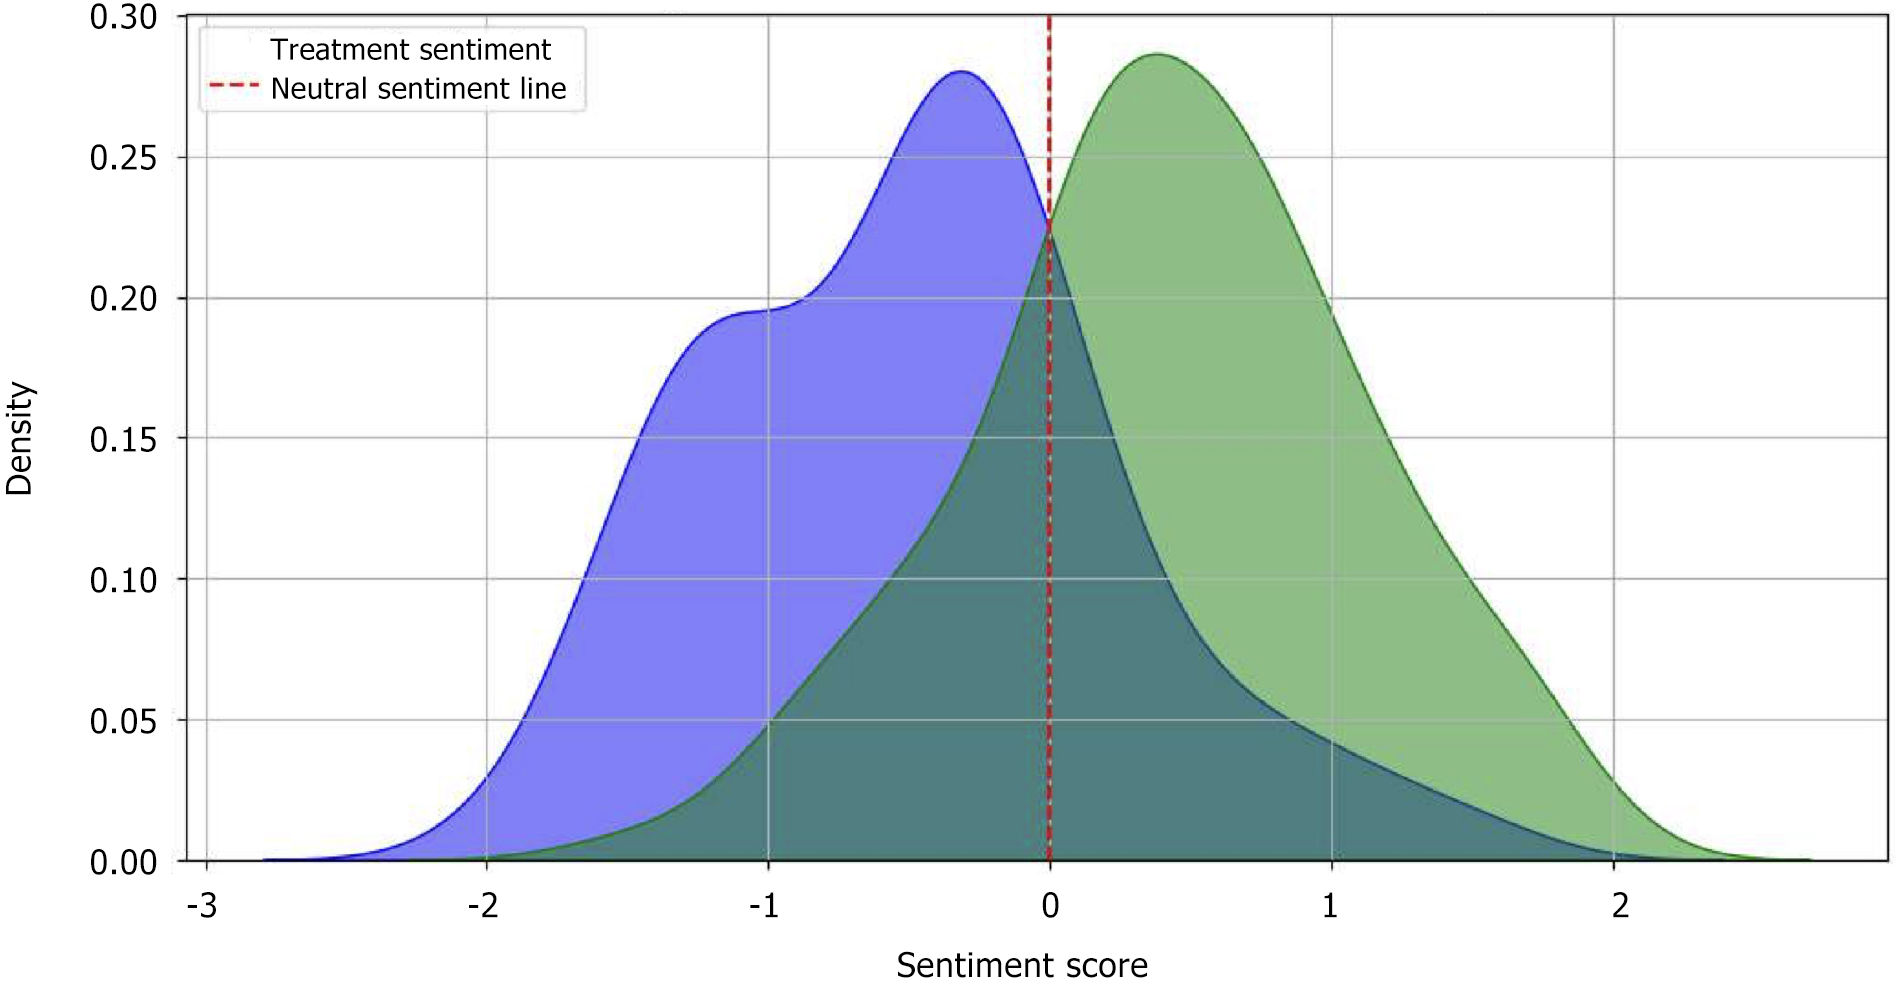
Figure 3 Sentiment score overlap between resection and ablation.
Density plot displaying the distribution of sentiment scores for the two treatments. The distribution of abstracts favoring liver resection and ablation shows considerable overlap, particularly around the neutral sentiment line (sentiment score of 0).
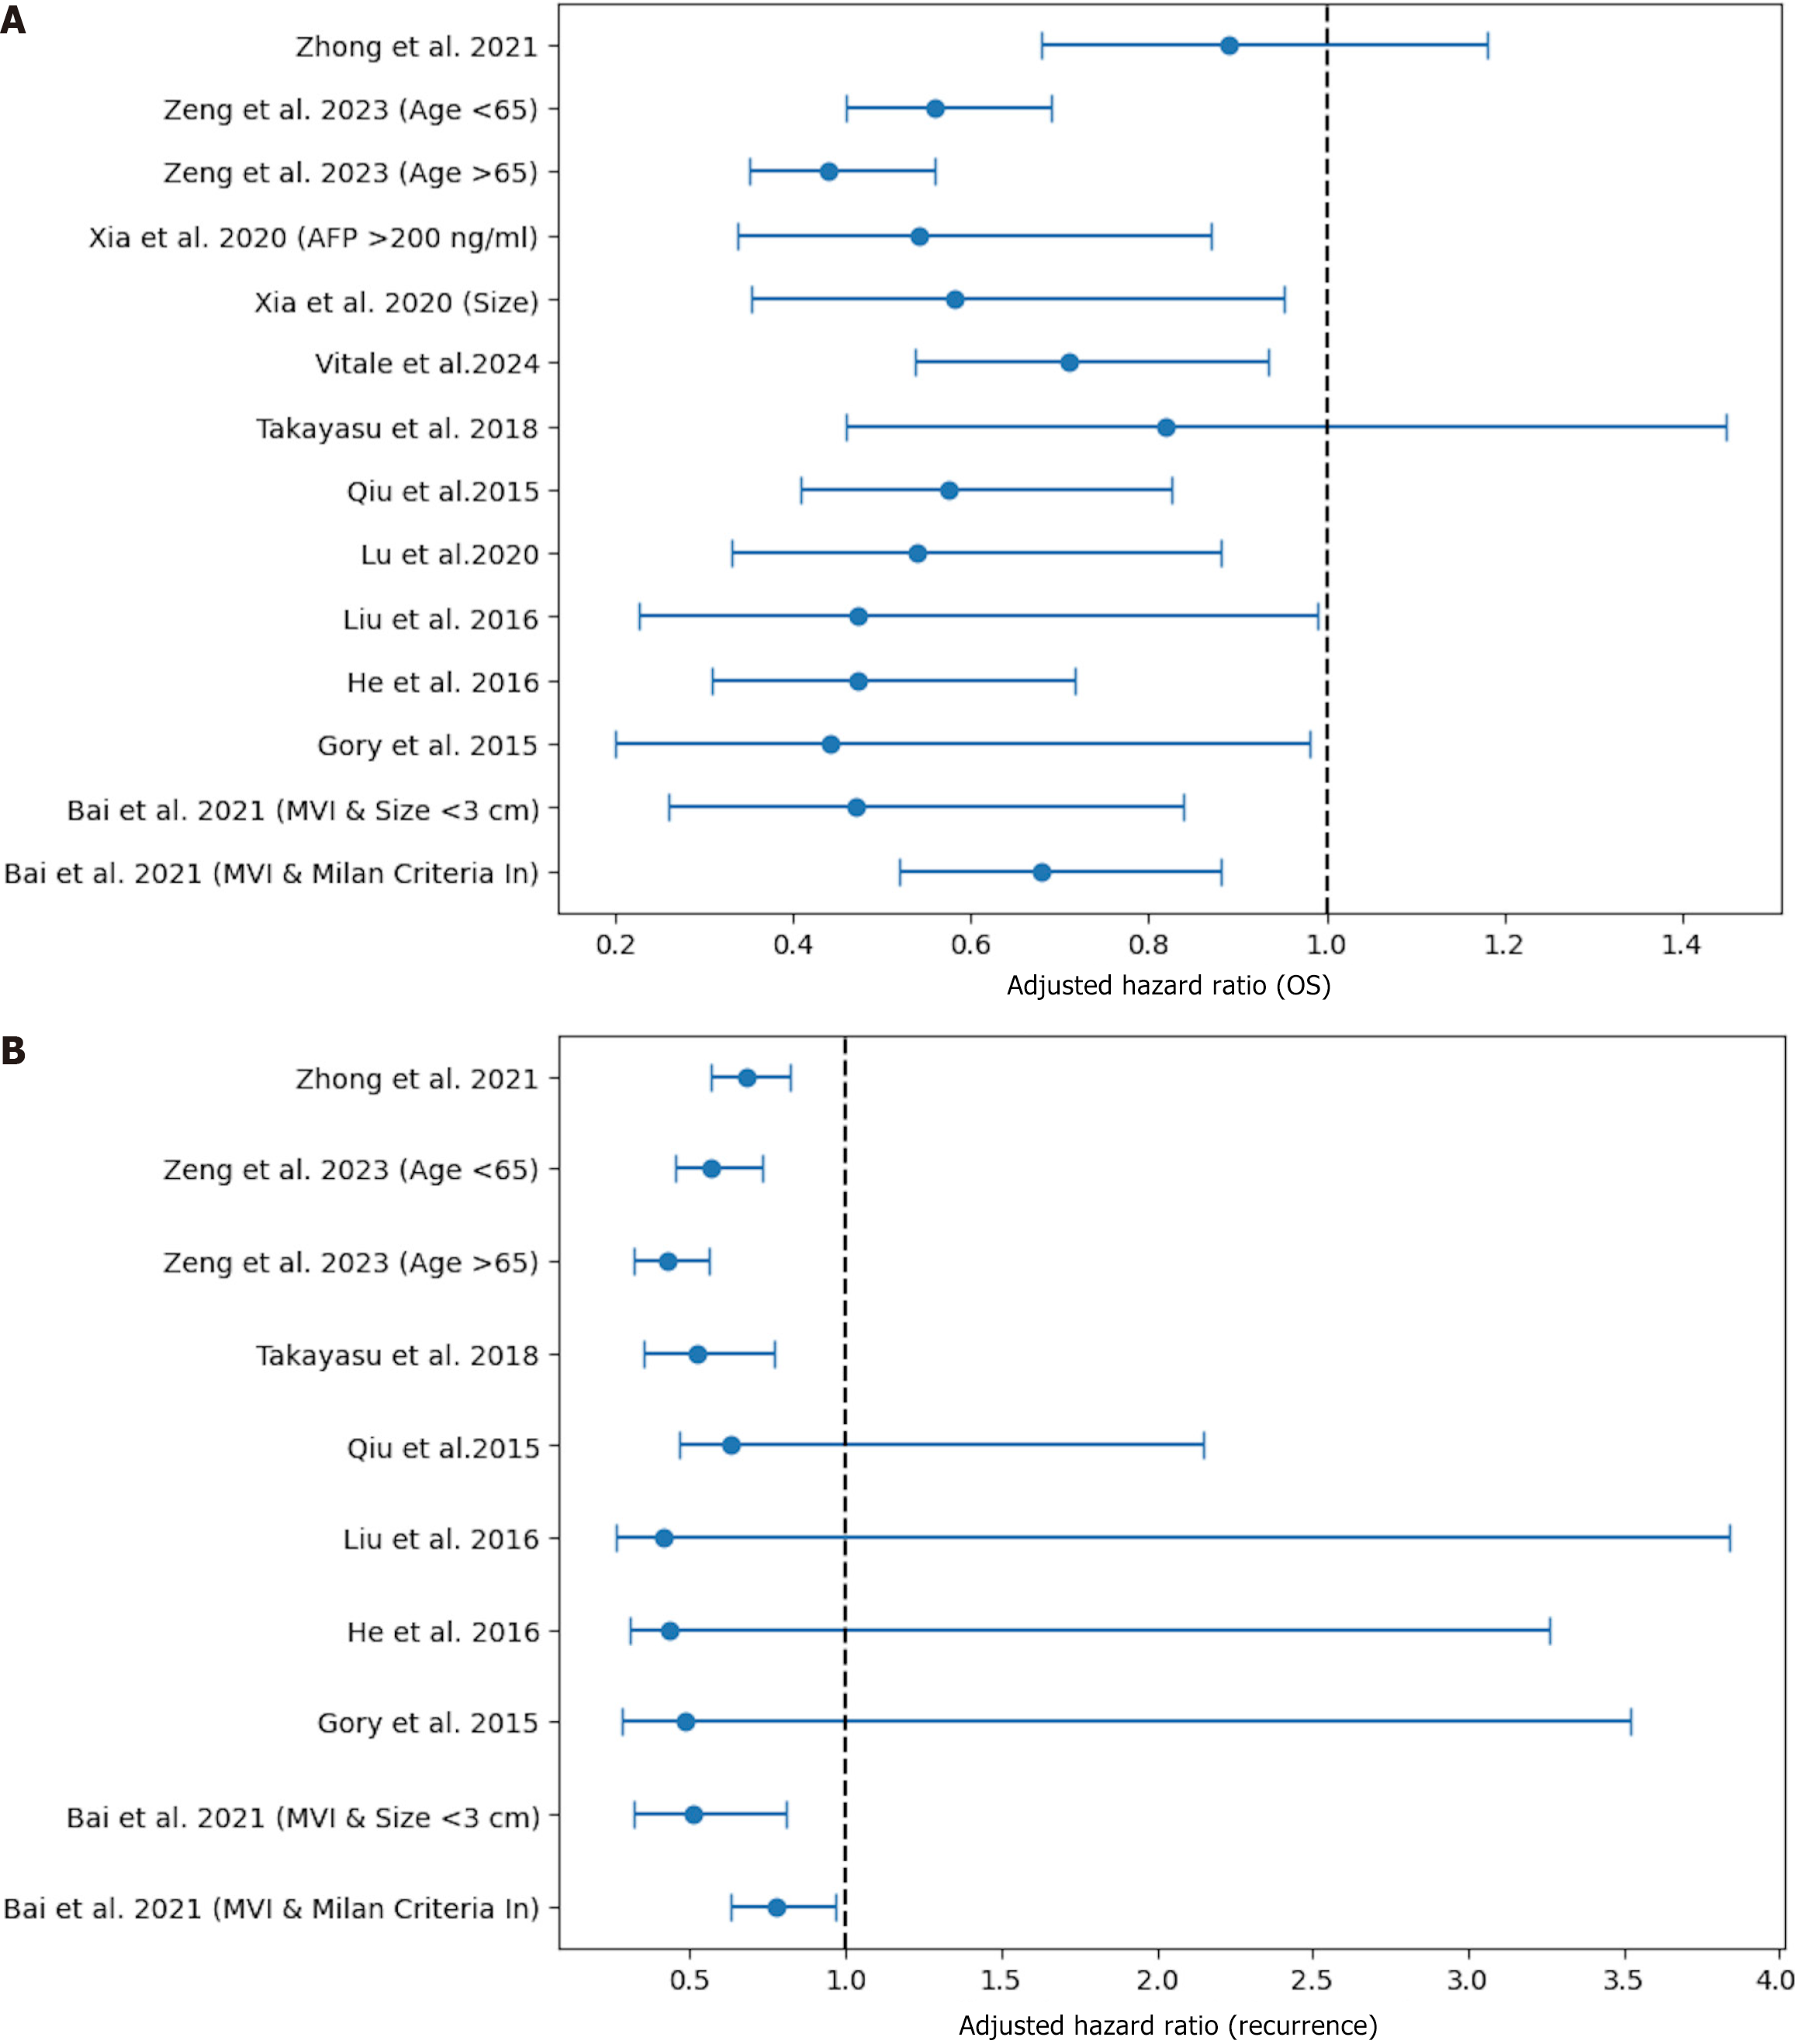
Figure 4 Forest plot.
A: Adjusted hazard ratios for overall survival across 11 studies comparing liver resection and radiofrequency ablation. For studies that reported both overall cohort analyses and subgroup-specific results, the data were treated as separate entries in the meta-analysis. The pooled hazard ratio shows a significant survival benefit for liver resection; B: Summarizing the meta-analysis of recurrence. The plot presents the hazard ratios (HR) for each included study, comparing recurrence outcomes between liver resection and radiofrequency ablation (RFA). For studies that reported both overall cohort analyses and subgroup-specific results, the data were treated as separate entries in the meta-analysis. The pooled HR indicates a lower recurrence rate after liver resection compared to RFA. OS: Overall survival.
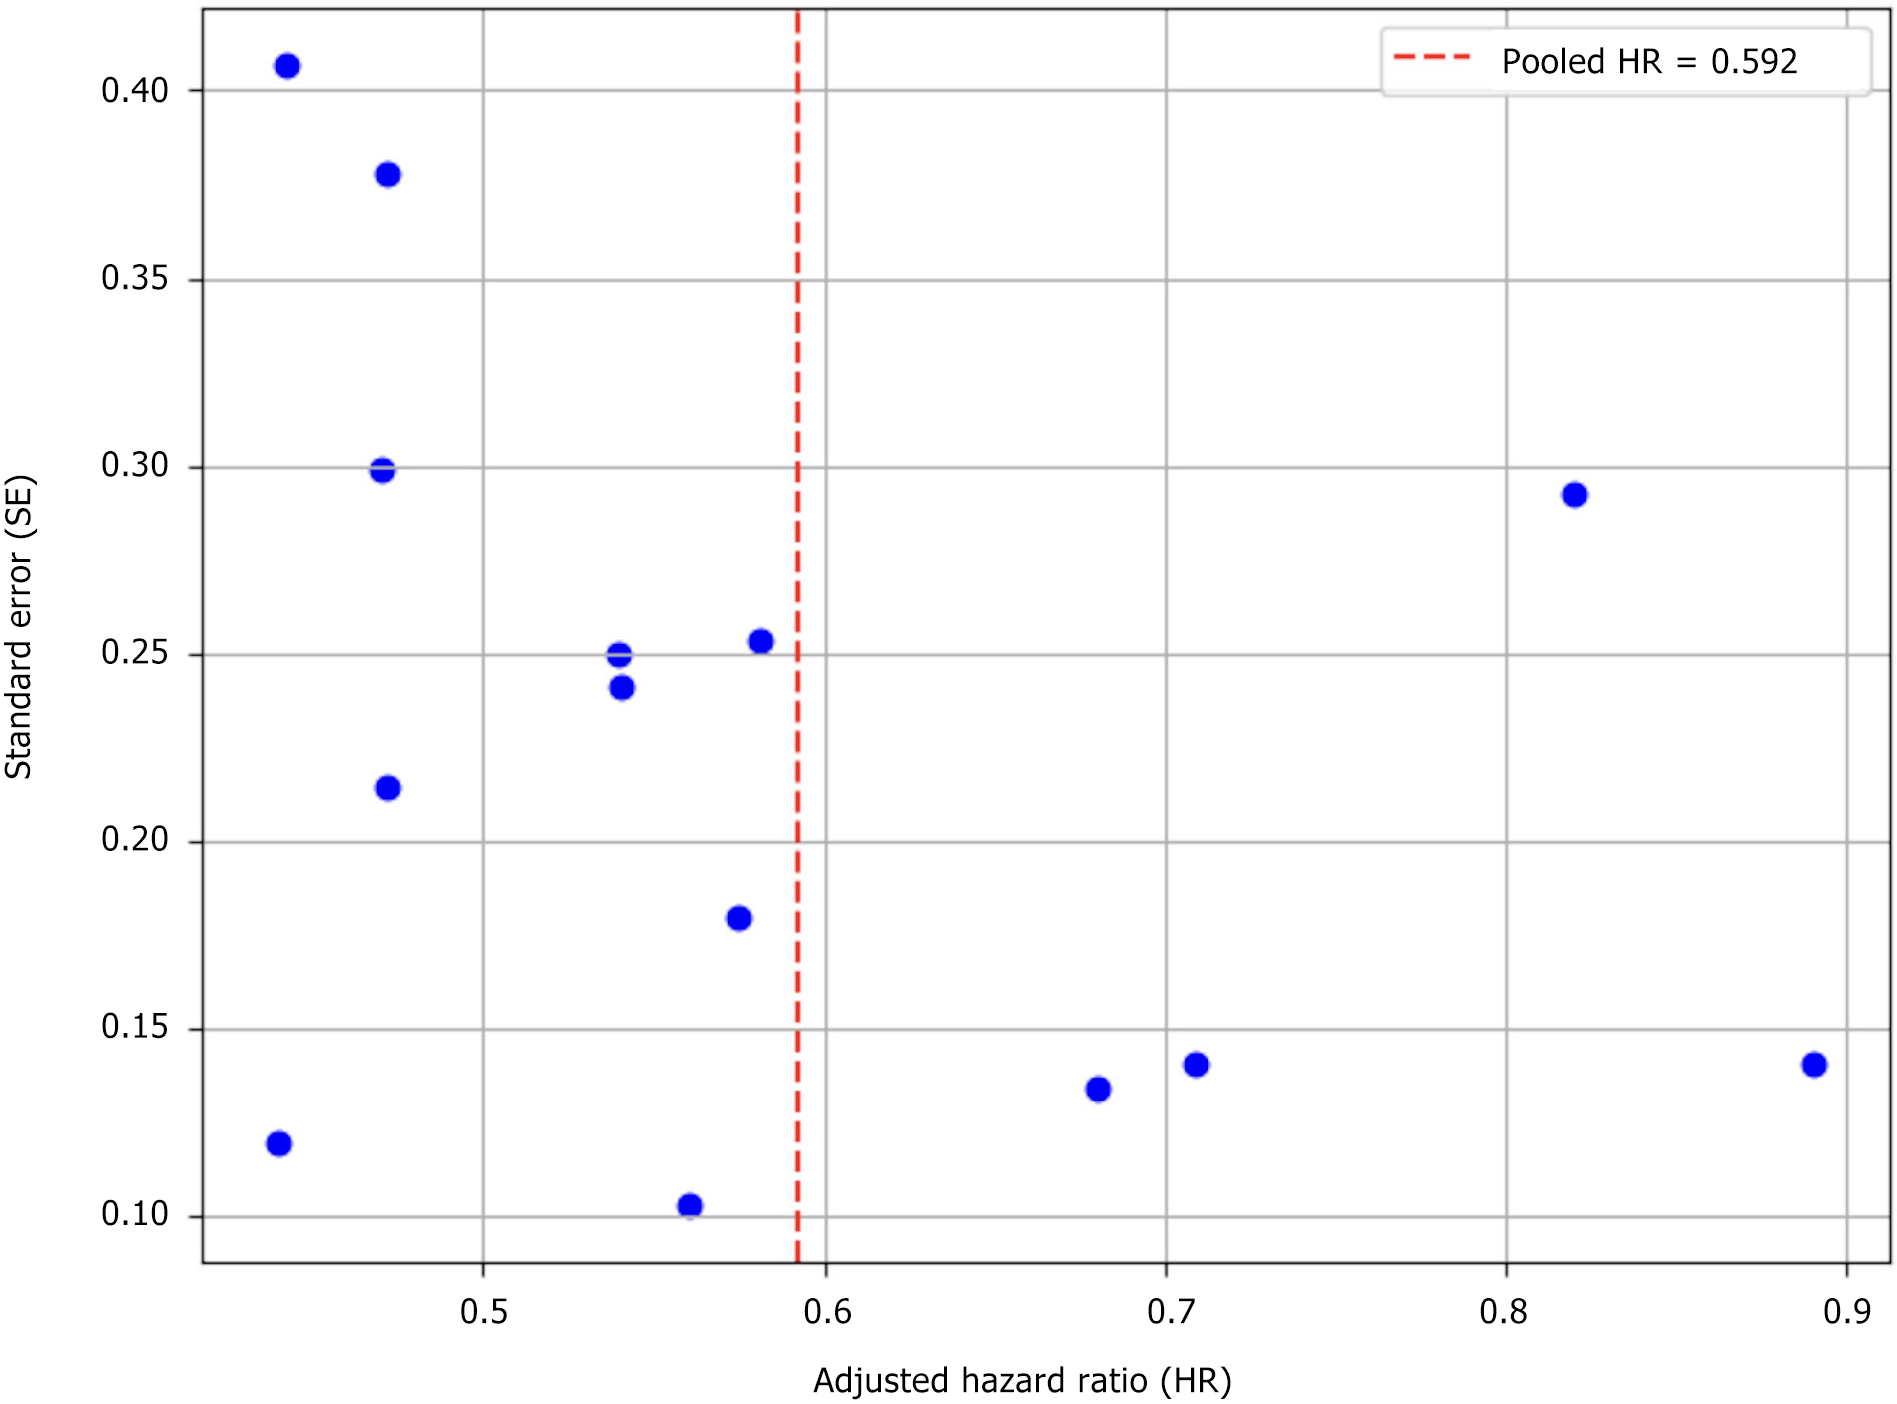
Figure 5 Funnel plot for publication bias.
The plot evaluates the presence of publication bias in the meta-analysis. The lack of substantial asymmetry suggests that the findings from the included studies were unlikely to be influenced by publication bias. HR: Hazard ratio.
- Citation: Cicerone O, Mantovani S, Oliviero B, Basilico G, Corallo S, Quaretti P, Maestri M. Navigating the evidence for hepatocellular carcinoma treatment: Surgery vs radiofrequency ablation through sentiment and meta-analysis. World J Clin Oncol 2025; 16(5): 105881
- URL: https://www.wjgnet.com/2218-4333/full/v16/i5/105881.htm
- DOI: https://dx.doi.org/10.5306/wjco.v16.i5.105881


