©The Author(s) 2025.
World J Clin Oncol. May 24, 2025; 16(5): 105341
Published online May 24, 2025. doi: 10.5306/wjco.v16.i5.105341
Published online May 24, 2025. doi: 10.5306/wjco.v16.i5.105341
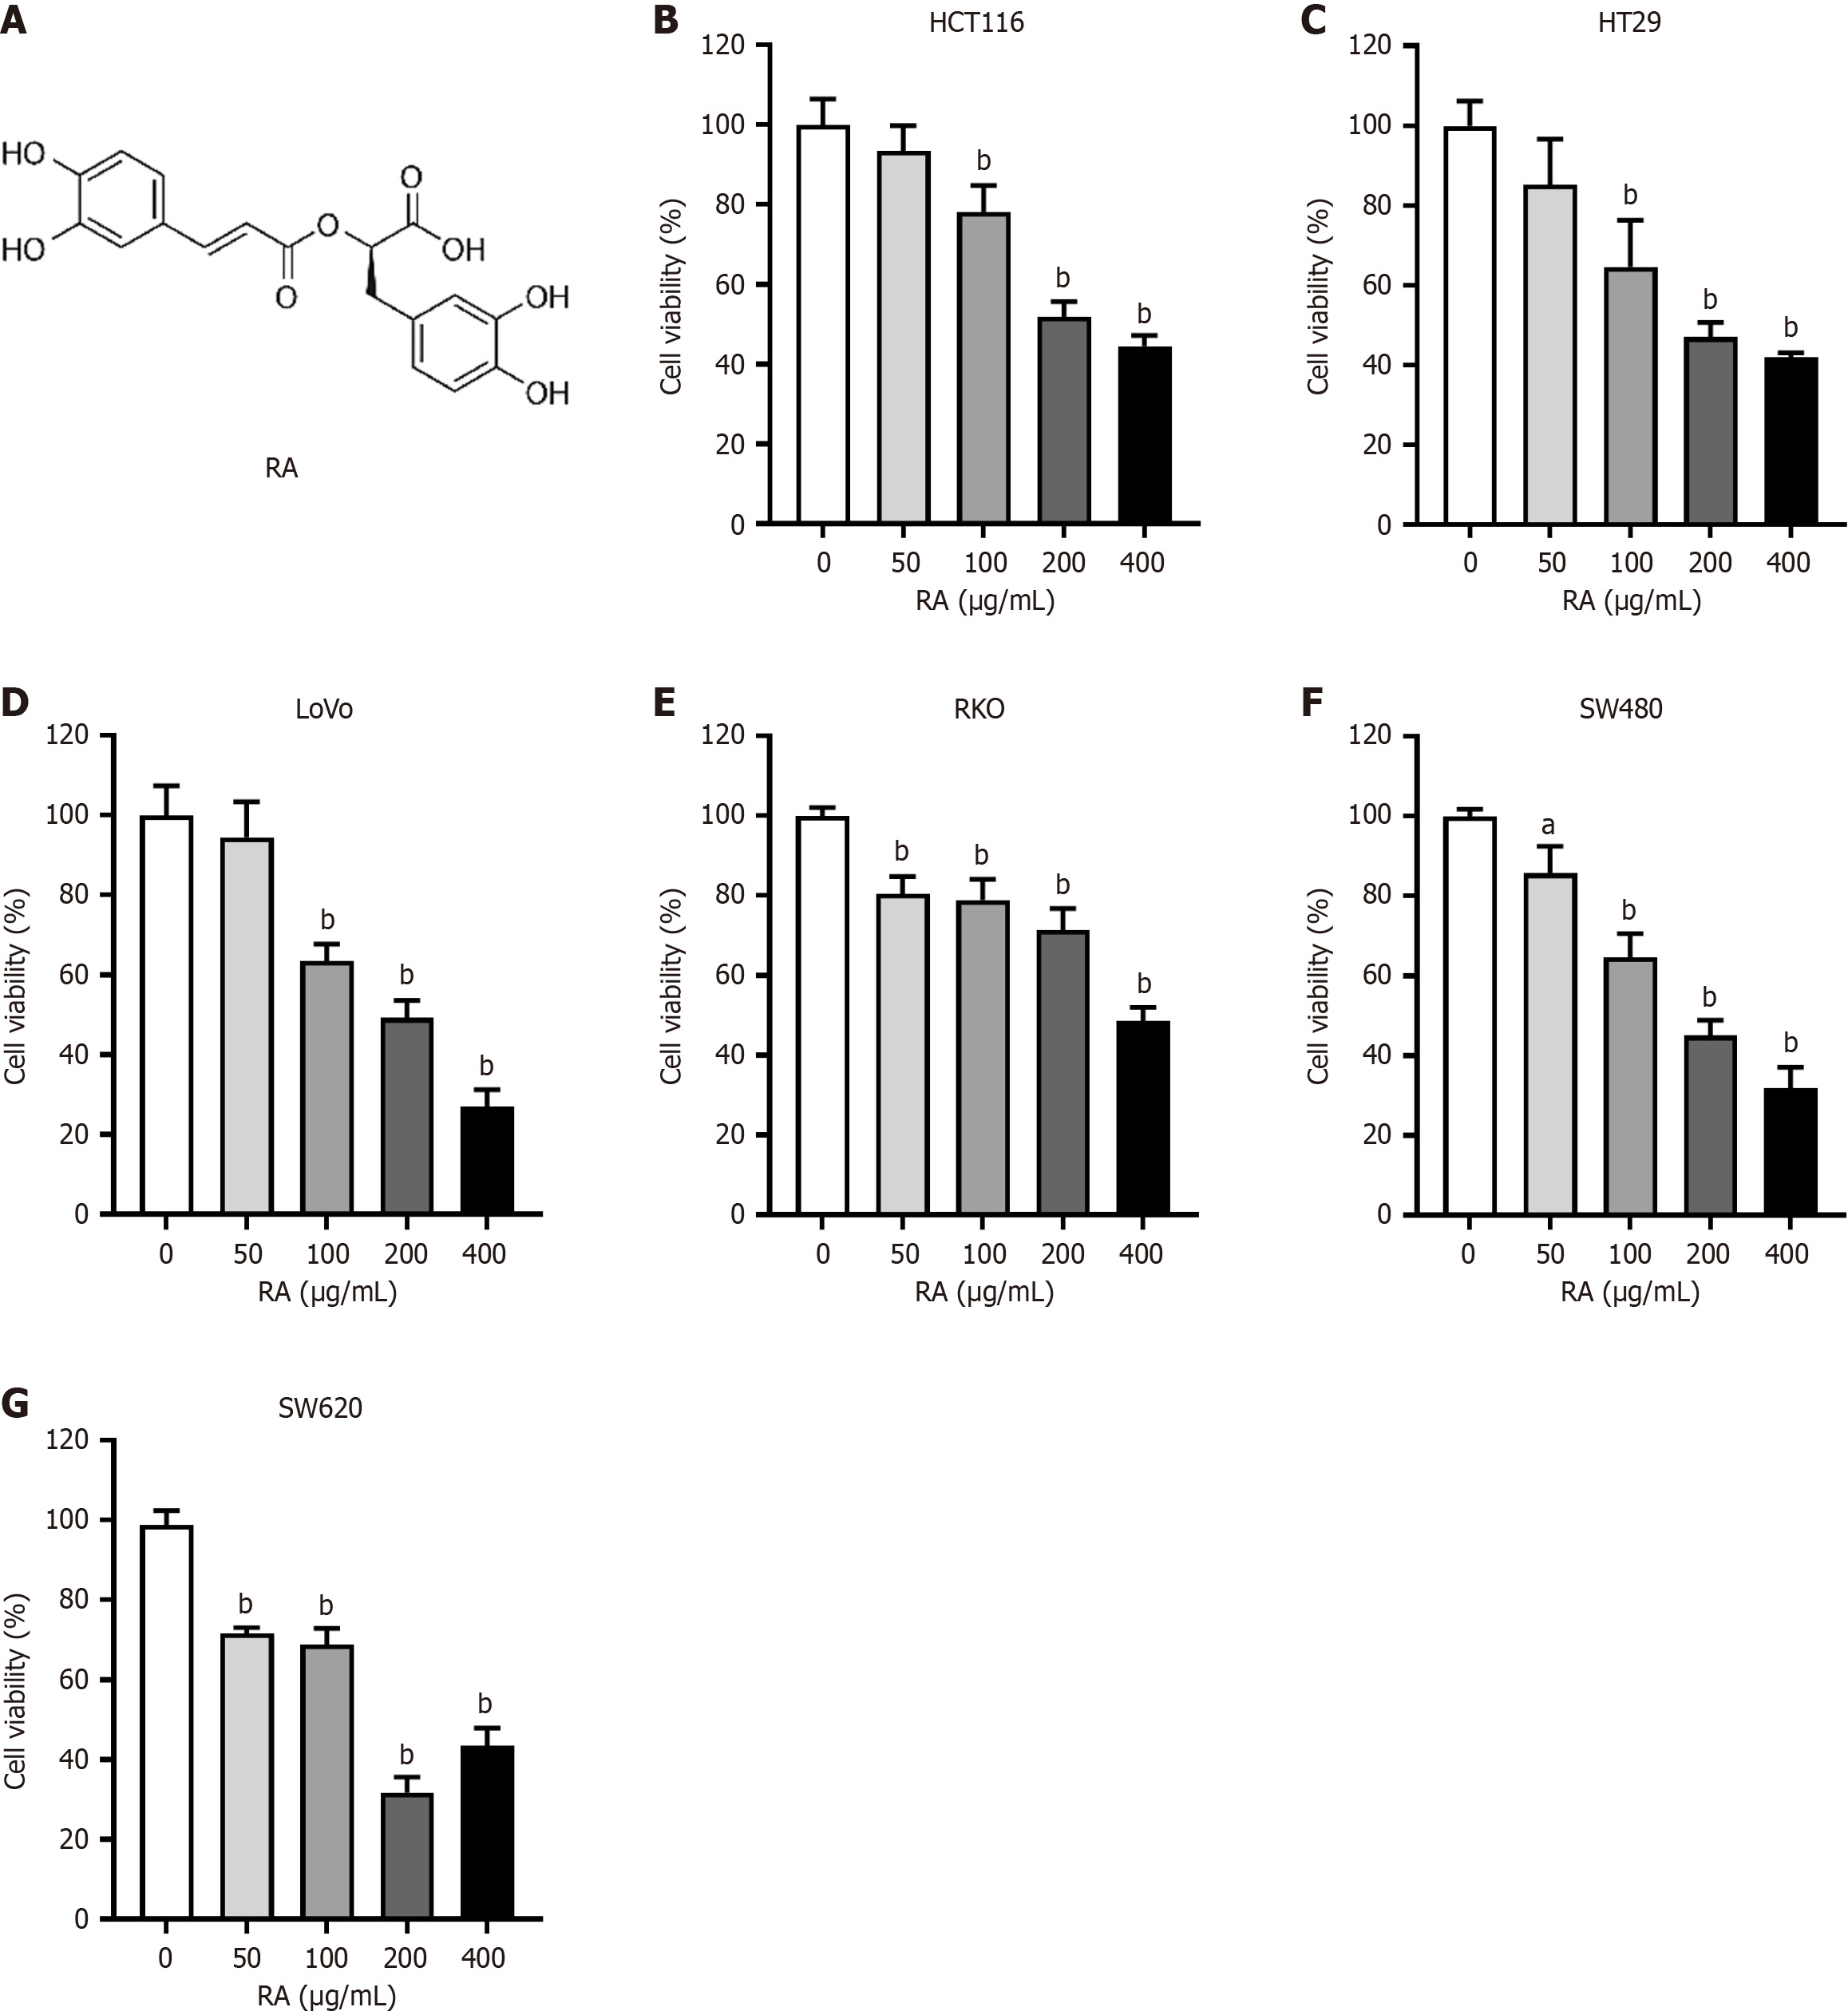
Figure 1 Rosmarinic acid inhibits survival of colorectal cancer cells.
A: Chemical structure of rosmarinic acid; B-G: HCT116 (B), HT29 (C), LoVo (D), RKO (E), SW480 (F), and SW620 (G) cells were separately incubated with increasing concentrations of rosmarinic acid. Twenty-four hours later, cells were prepared for Cell Counting Kit-8 assay to evaluate the cell viability. n = 3. Data are shown as the mean ± SD. aP < 0.001 vs group ‘0’, bP < 0.0001 vs group ‘0’. RA: Rosmarinic acid.
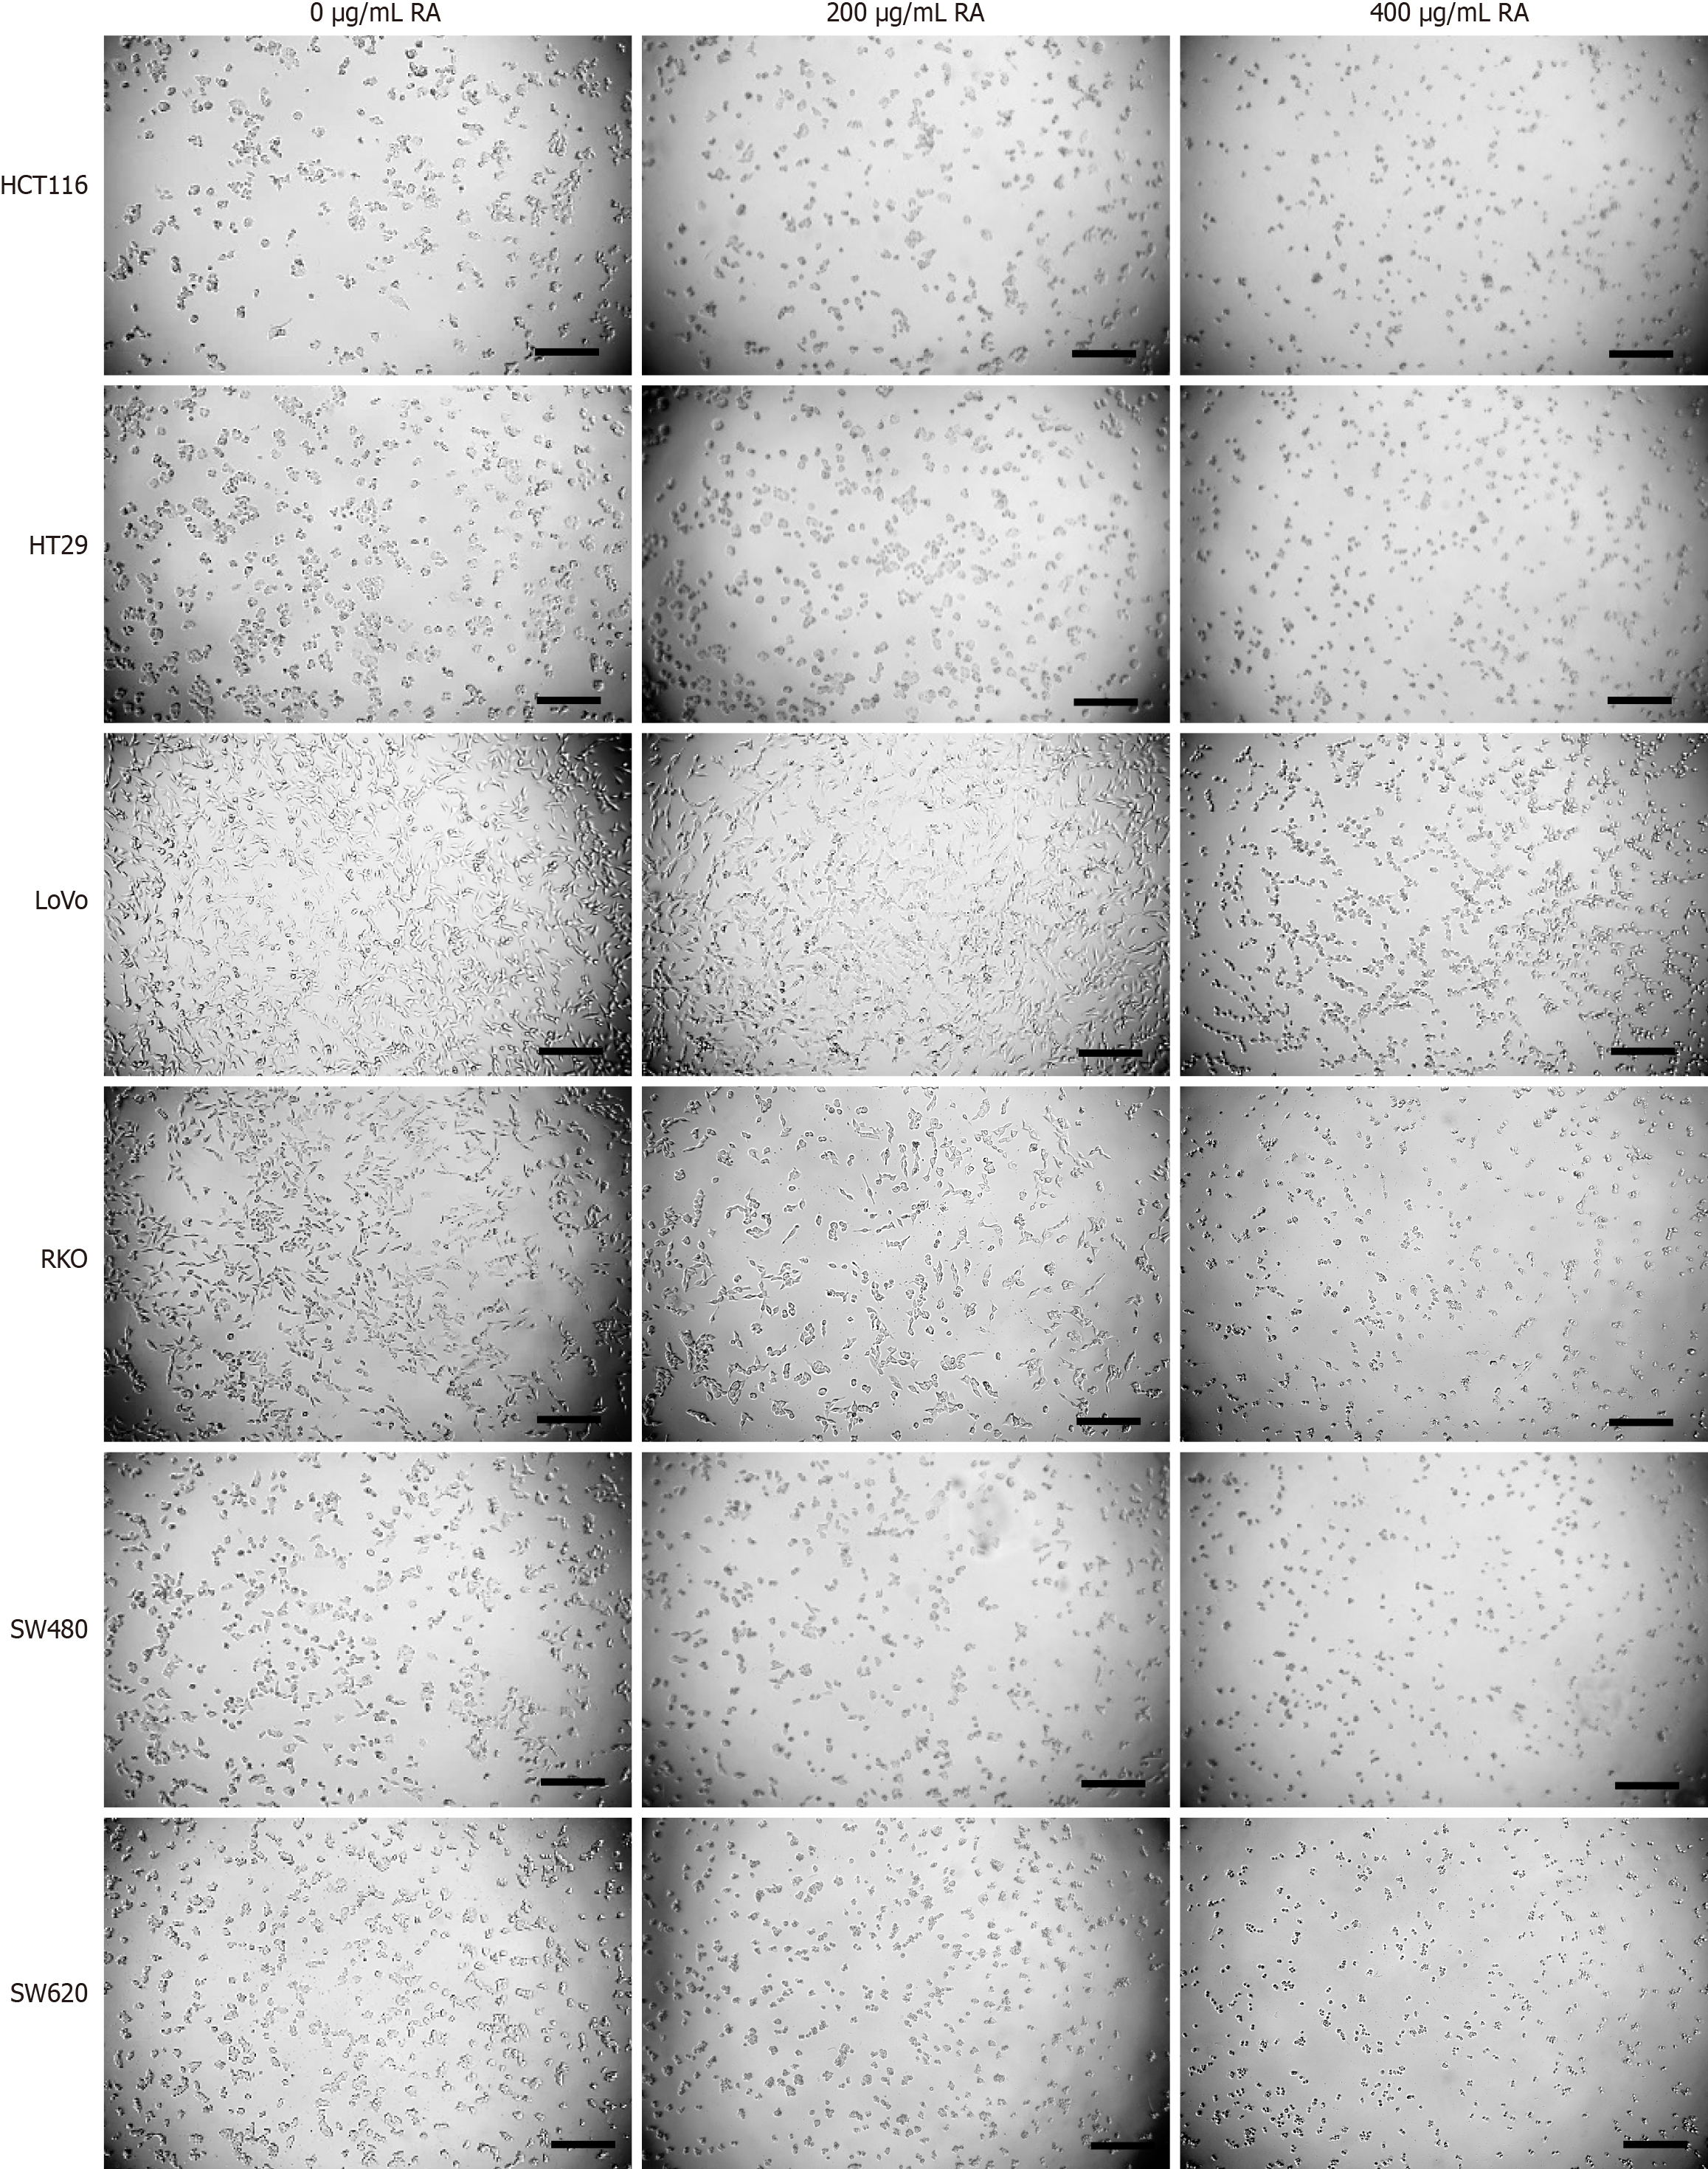
Figure 2 Optical microscopy images of colorectal cancer cells treated with rosmarinic acid.
Colorectal cancer cell lines, including HCT116, HT29, LoVo, RKO, SW480 and SW620, were separately incubated with increasing concentrations of rosmarinic acid. Twenty-four hours later, cells were taken photos under an optical microscopy. Scale bar = 0.3 mm. RA: Rosmarinic acid.
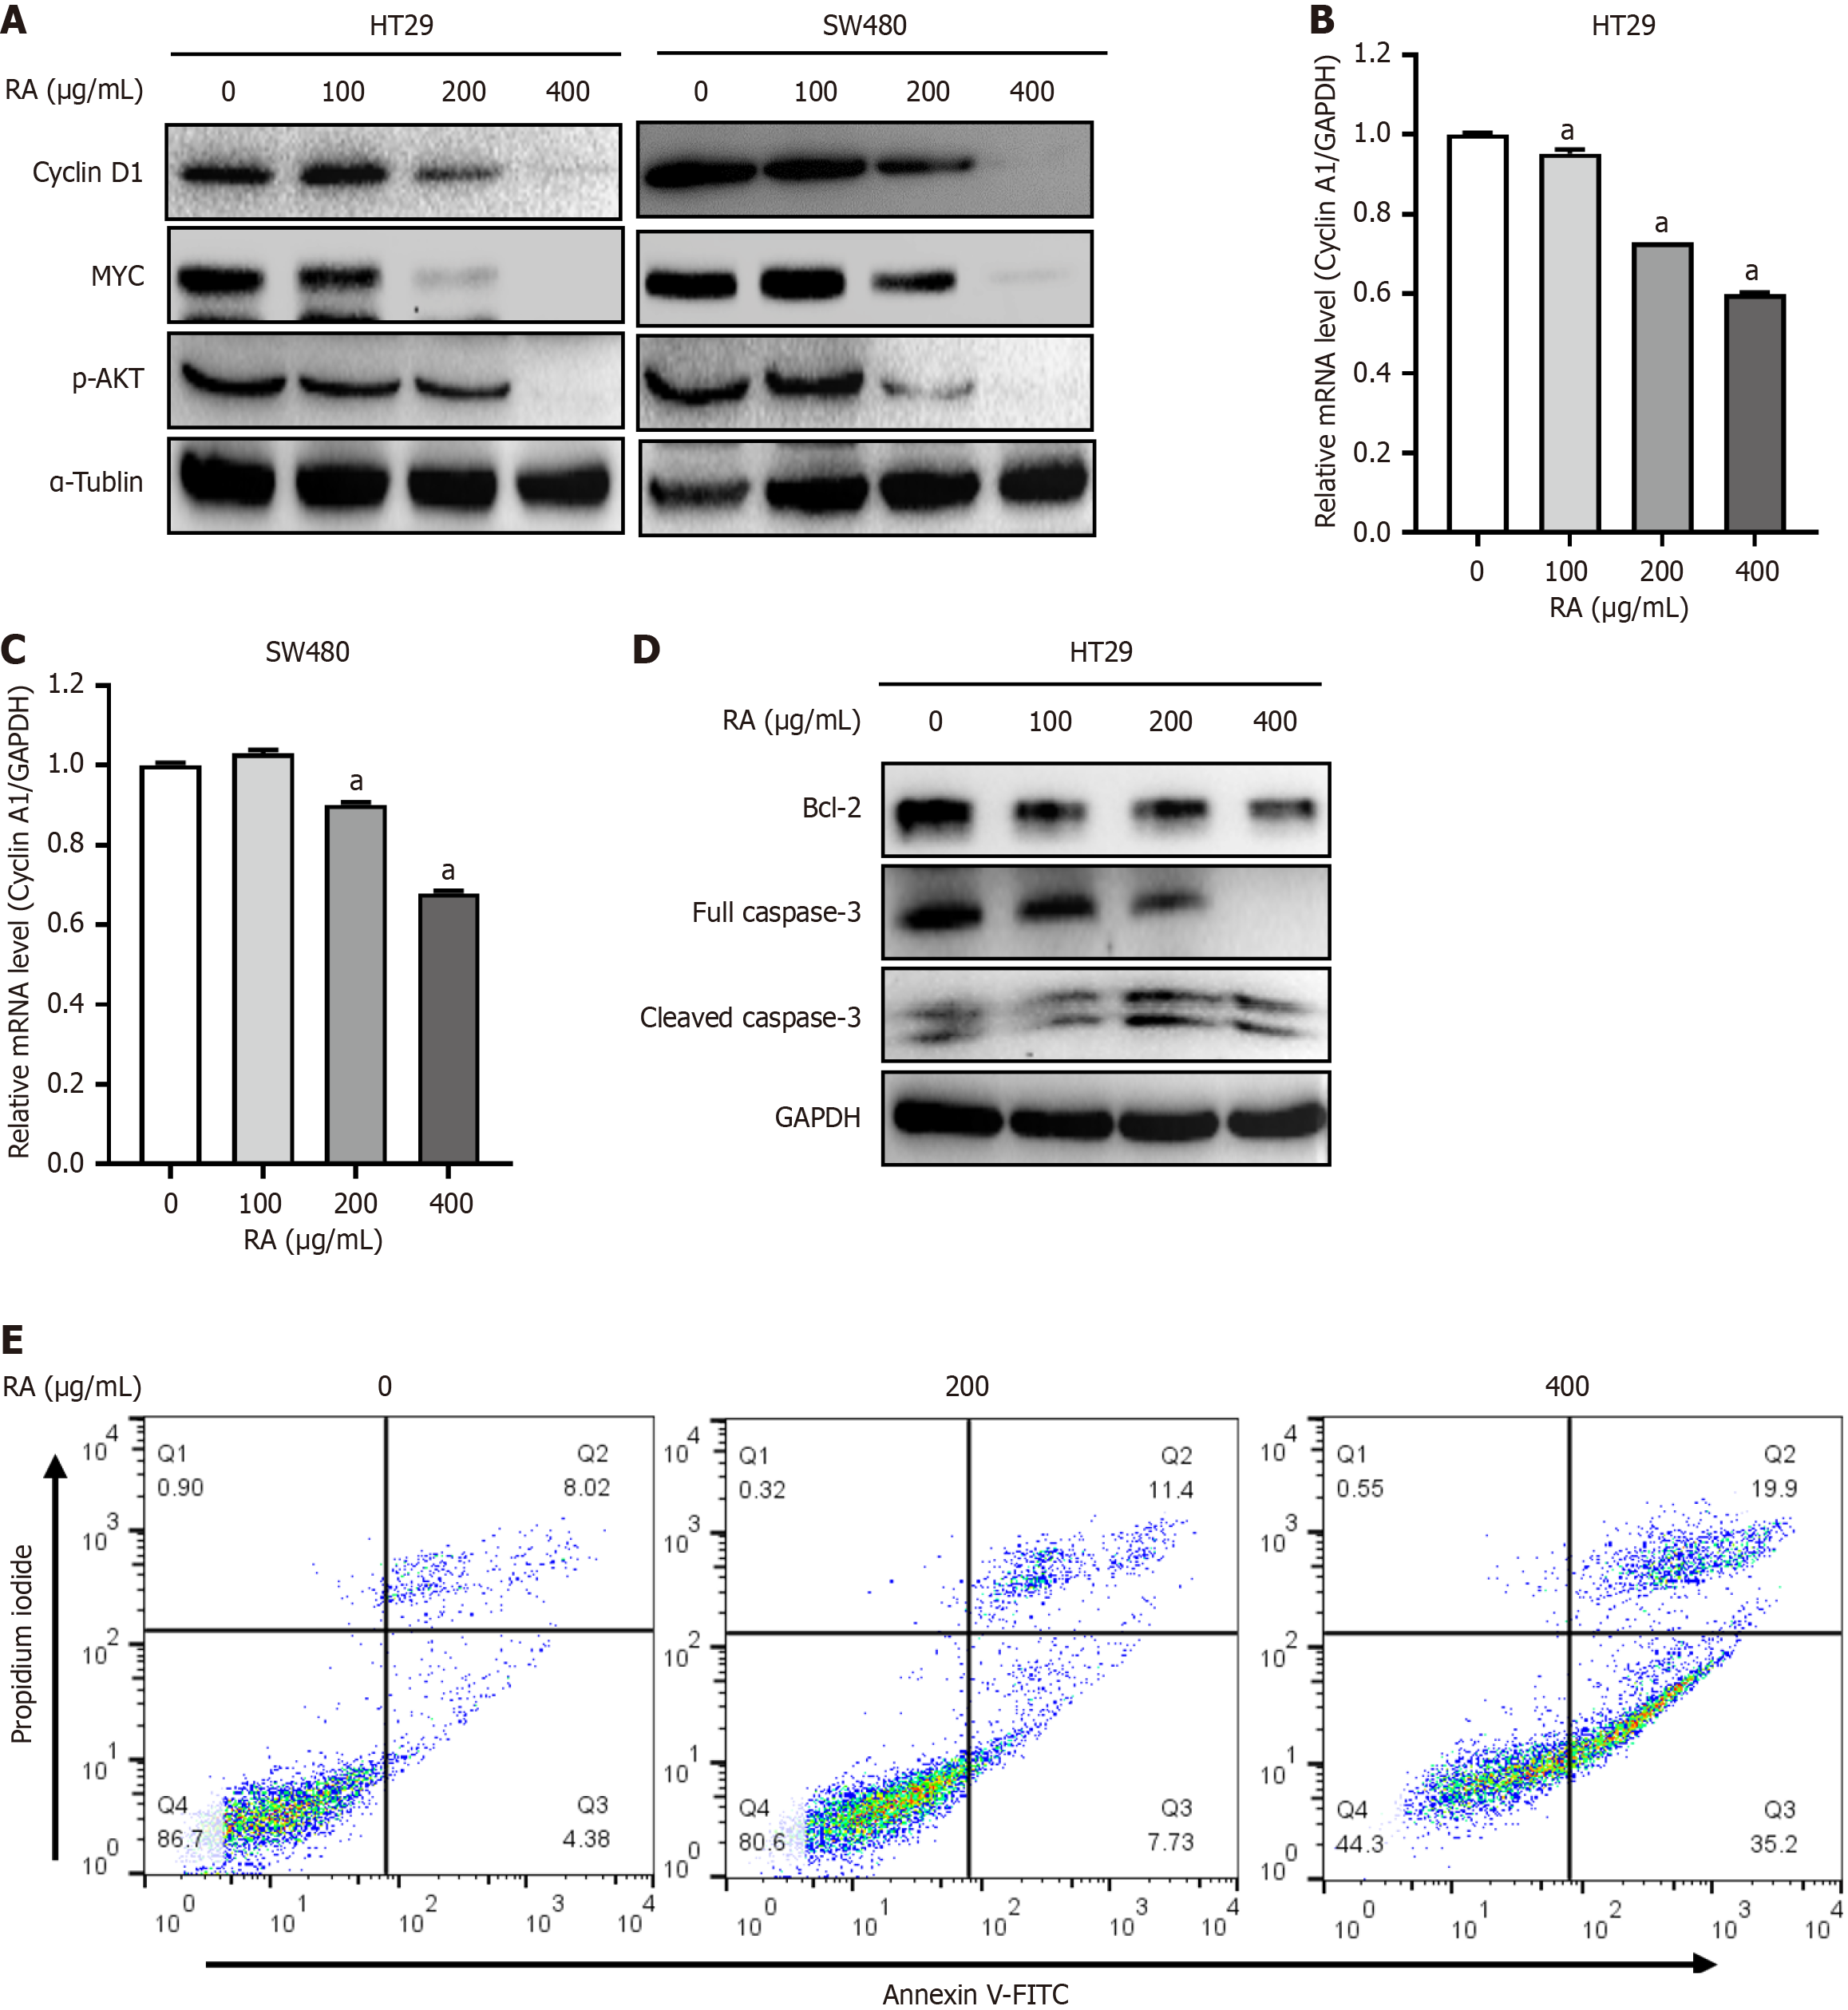
Figure 3 Rosmarinic acid inhibits the expressions of cell proliferative genes.
A: HT29 and SW480 cells were incubated with increasing concentrations of rosmarinic acid (RA) for 24 hours, followed by Western blot analysis using antibodies against cyclin D1 and MYC. α-Tublin was used as a loading control; B and C: The above cells were also prepared for quantitative real-time polymerase chain reaction to evaluate the mRNA levels of cyclin A1. GAPDH was used as an internal control; D: HT29 cells were treated with indicated concentrations of RA for 24 hours, followed by Western blot analysis using antibodies against Bcl-2, caspase-3, and GAPDH; E: HT29 cells were treated with indicated concentrations of RA for 24 hours, and then stained with Annexin V-FITC and propidium iodide. Percentages of Annexin V+ cells are indicated in the scatterplot (right low and upper quadrants). n = 3. Data are shown as the mean ± SD. aP < 0.0001 vs group ‘0’. RA: Rosmarinic acid; AKT: Protein kinase B.
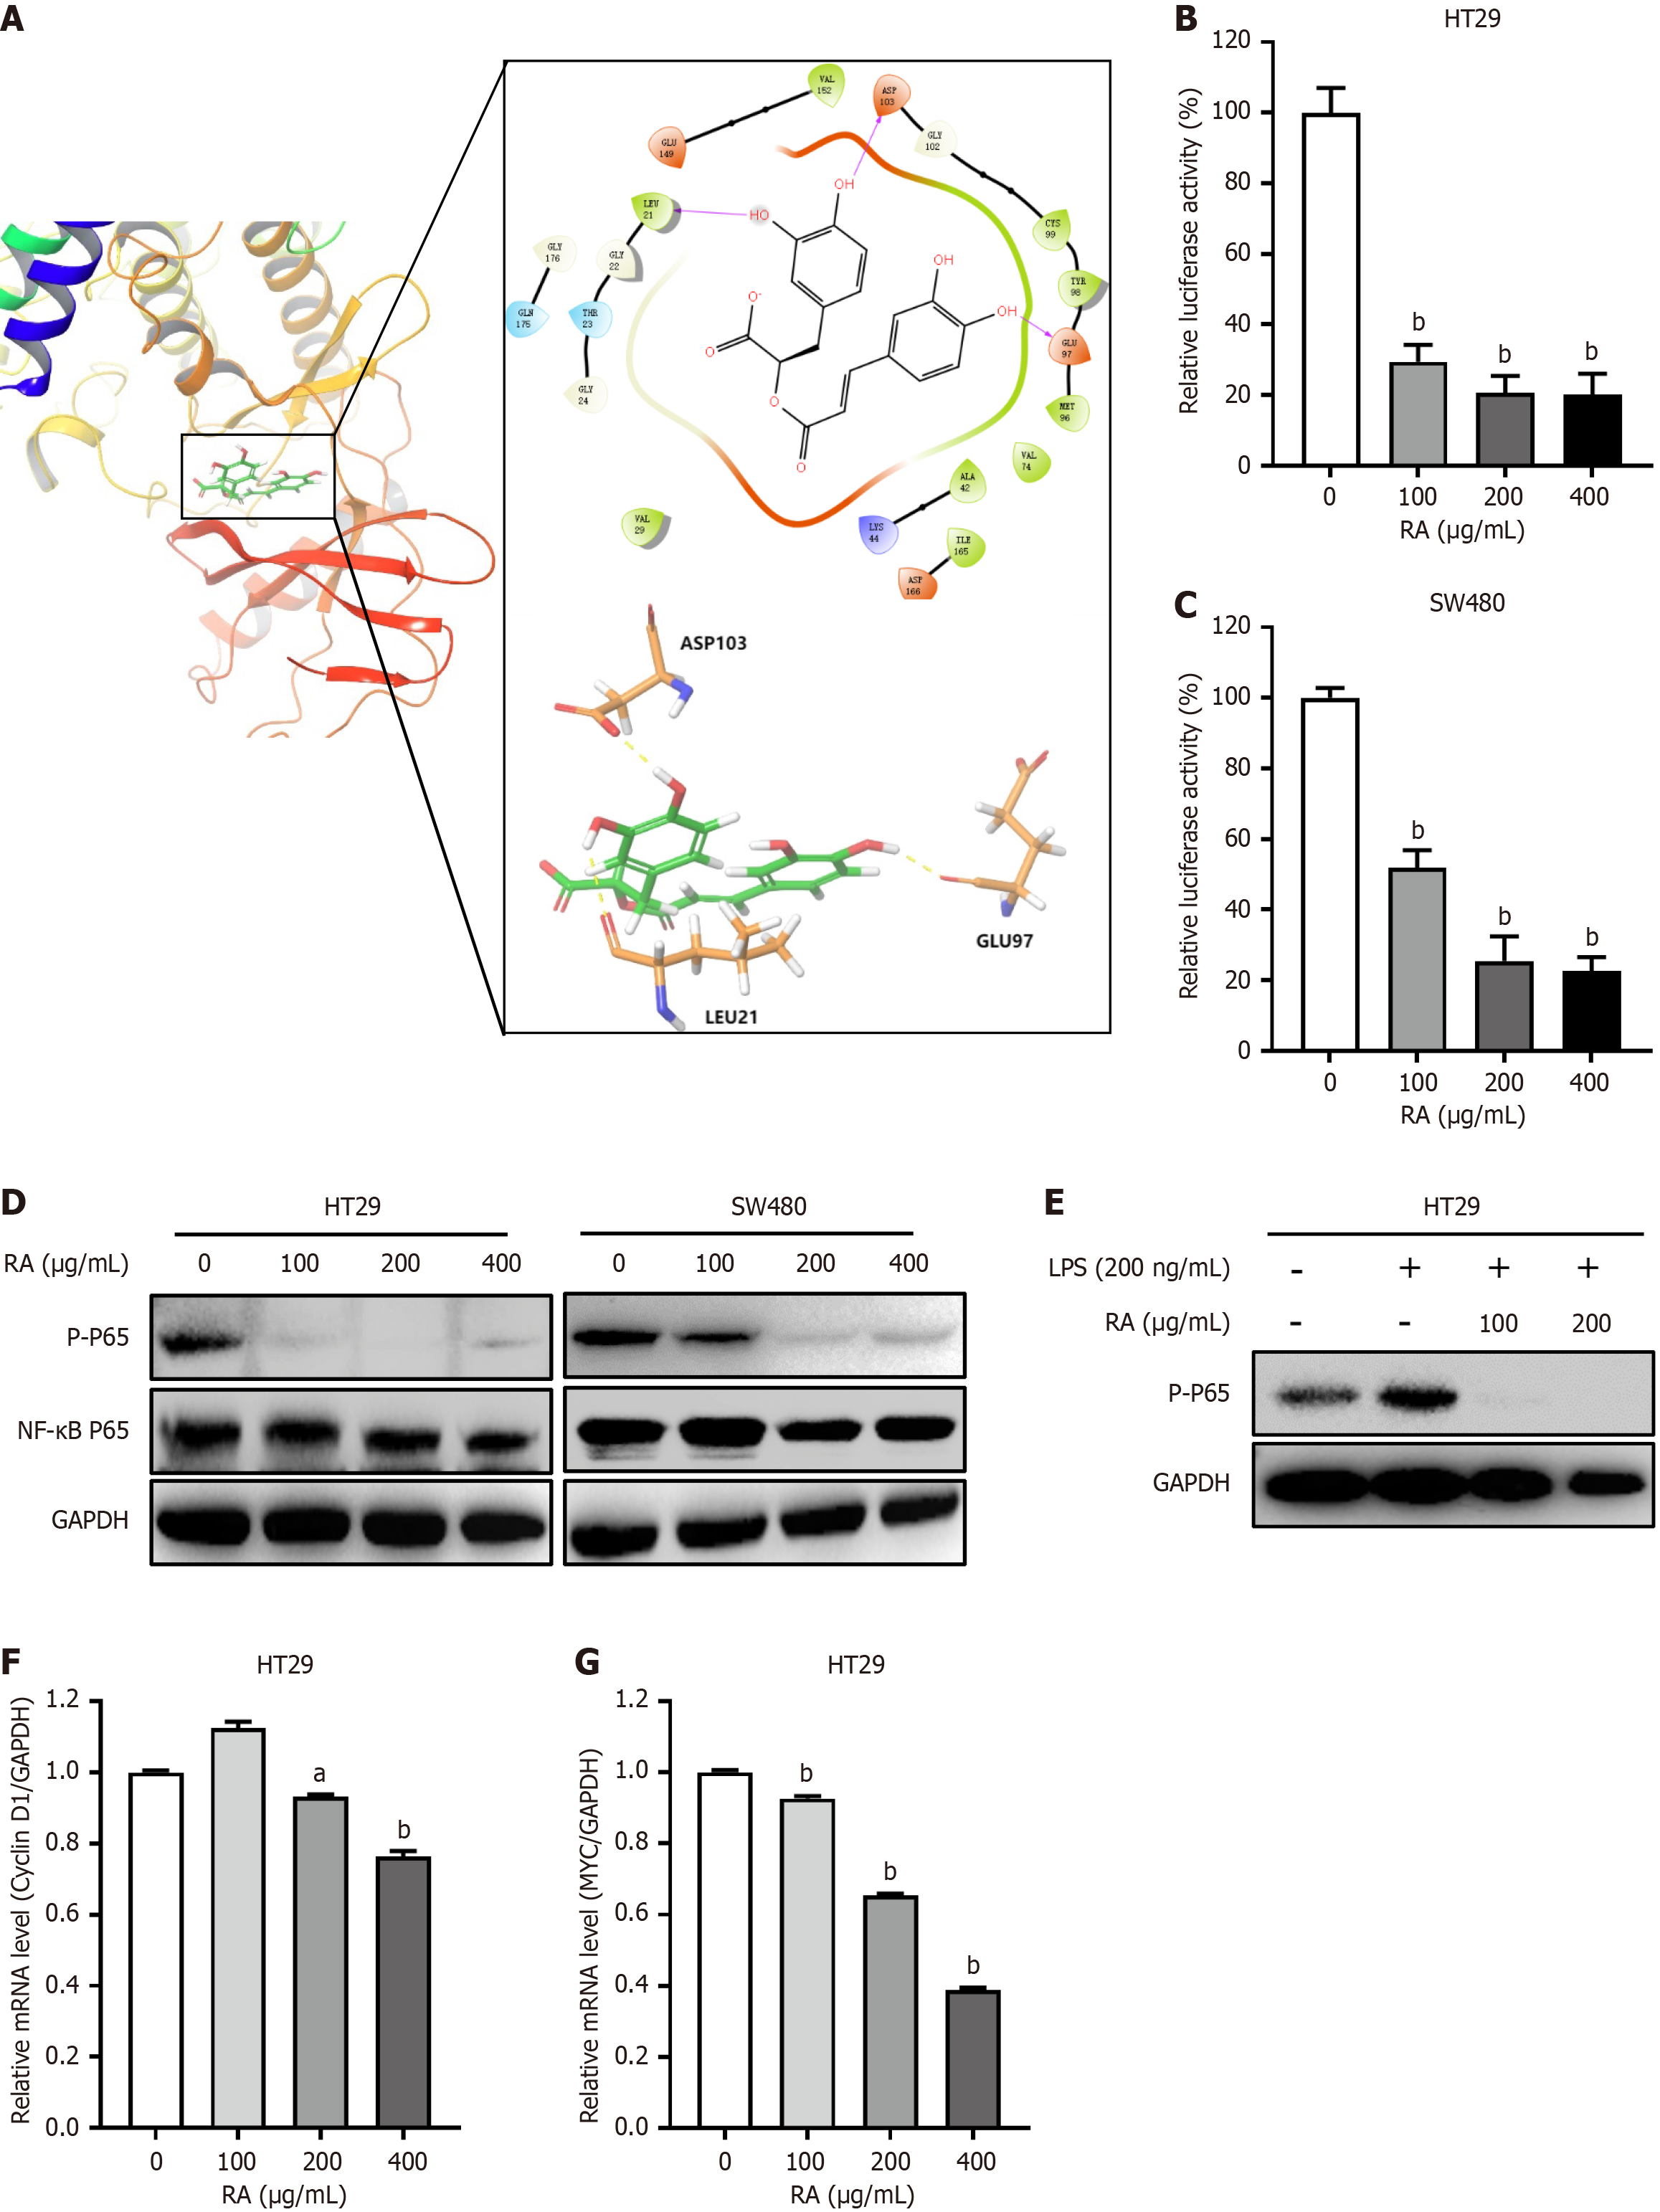
Figure 4 Rosmarinic acid inhibits nuclear factor-kappa B signaling in colorectal cancer cells.
A: Molecular modeling of rosmarinic acid (RA)/inhibitory kappa B kinase beta complex. 3D presentation of the molecular docking complex pose (I), 2D presentation (II), and 3D presentation (III) of the interactions between RA and the key residues of inhibitory kappa B kinase beta; B and C: HT29 (B) and SW480 (C) cells transfected with p-nuclear factor-kappa B-Luc along with Renilla luciferase were incubated with indicated RA overnight, followed by luciferase assay; D: HT29 and SW480 cells were incubated with increasing concentrations of RA for 24 hours, followed by Western blot analysis using antibodies against p-p65 and nuclear factor-kappa B P65. GAPDH was used as a loading control; E: Starved HT29 cells were treated with indicated RA for 12 hours, and then cells were incubated with 200 ng/mL lipopolysaccharide for 30 minutes, followed by Western blot analysis using antibodies against p-p65 and GAPDH; F and G: HT29 cells were incubated with increasing concentrations of RA for 24 hours, followed by quantitative real-time polymerase chain reaction to evaluate the mRNA levels of cyclin D1 (F) and MYC (G). GAPDH was used as an internal control. n = 3. Data are shown as the mean ± SD. aP < 0.001 vs group ‘0’, bP < 0.0001 vs group ‘0’. RA: Rosmarinic acid; NF-κB: Nuclear factor-kappa B; LPS: Lipopolysaccharide.
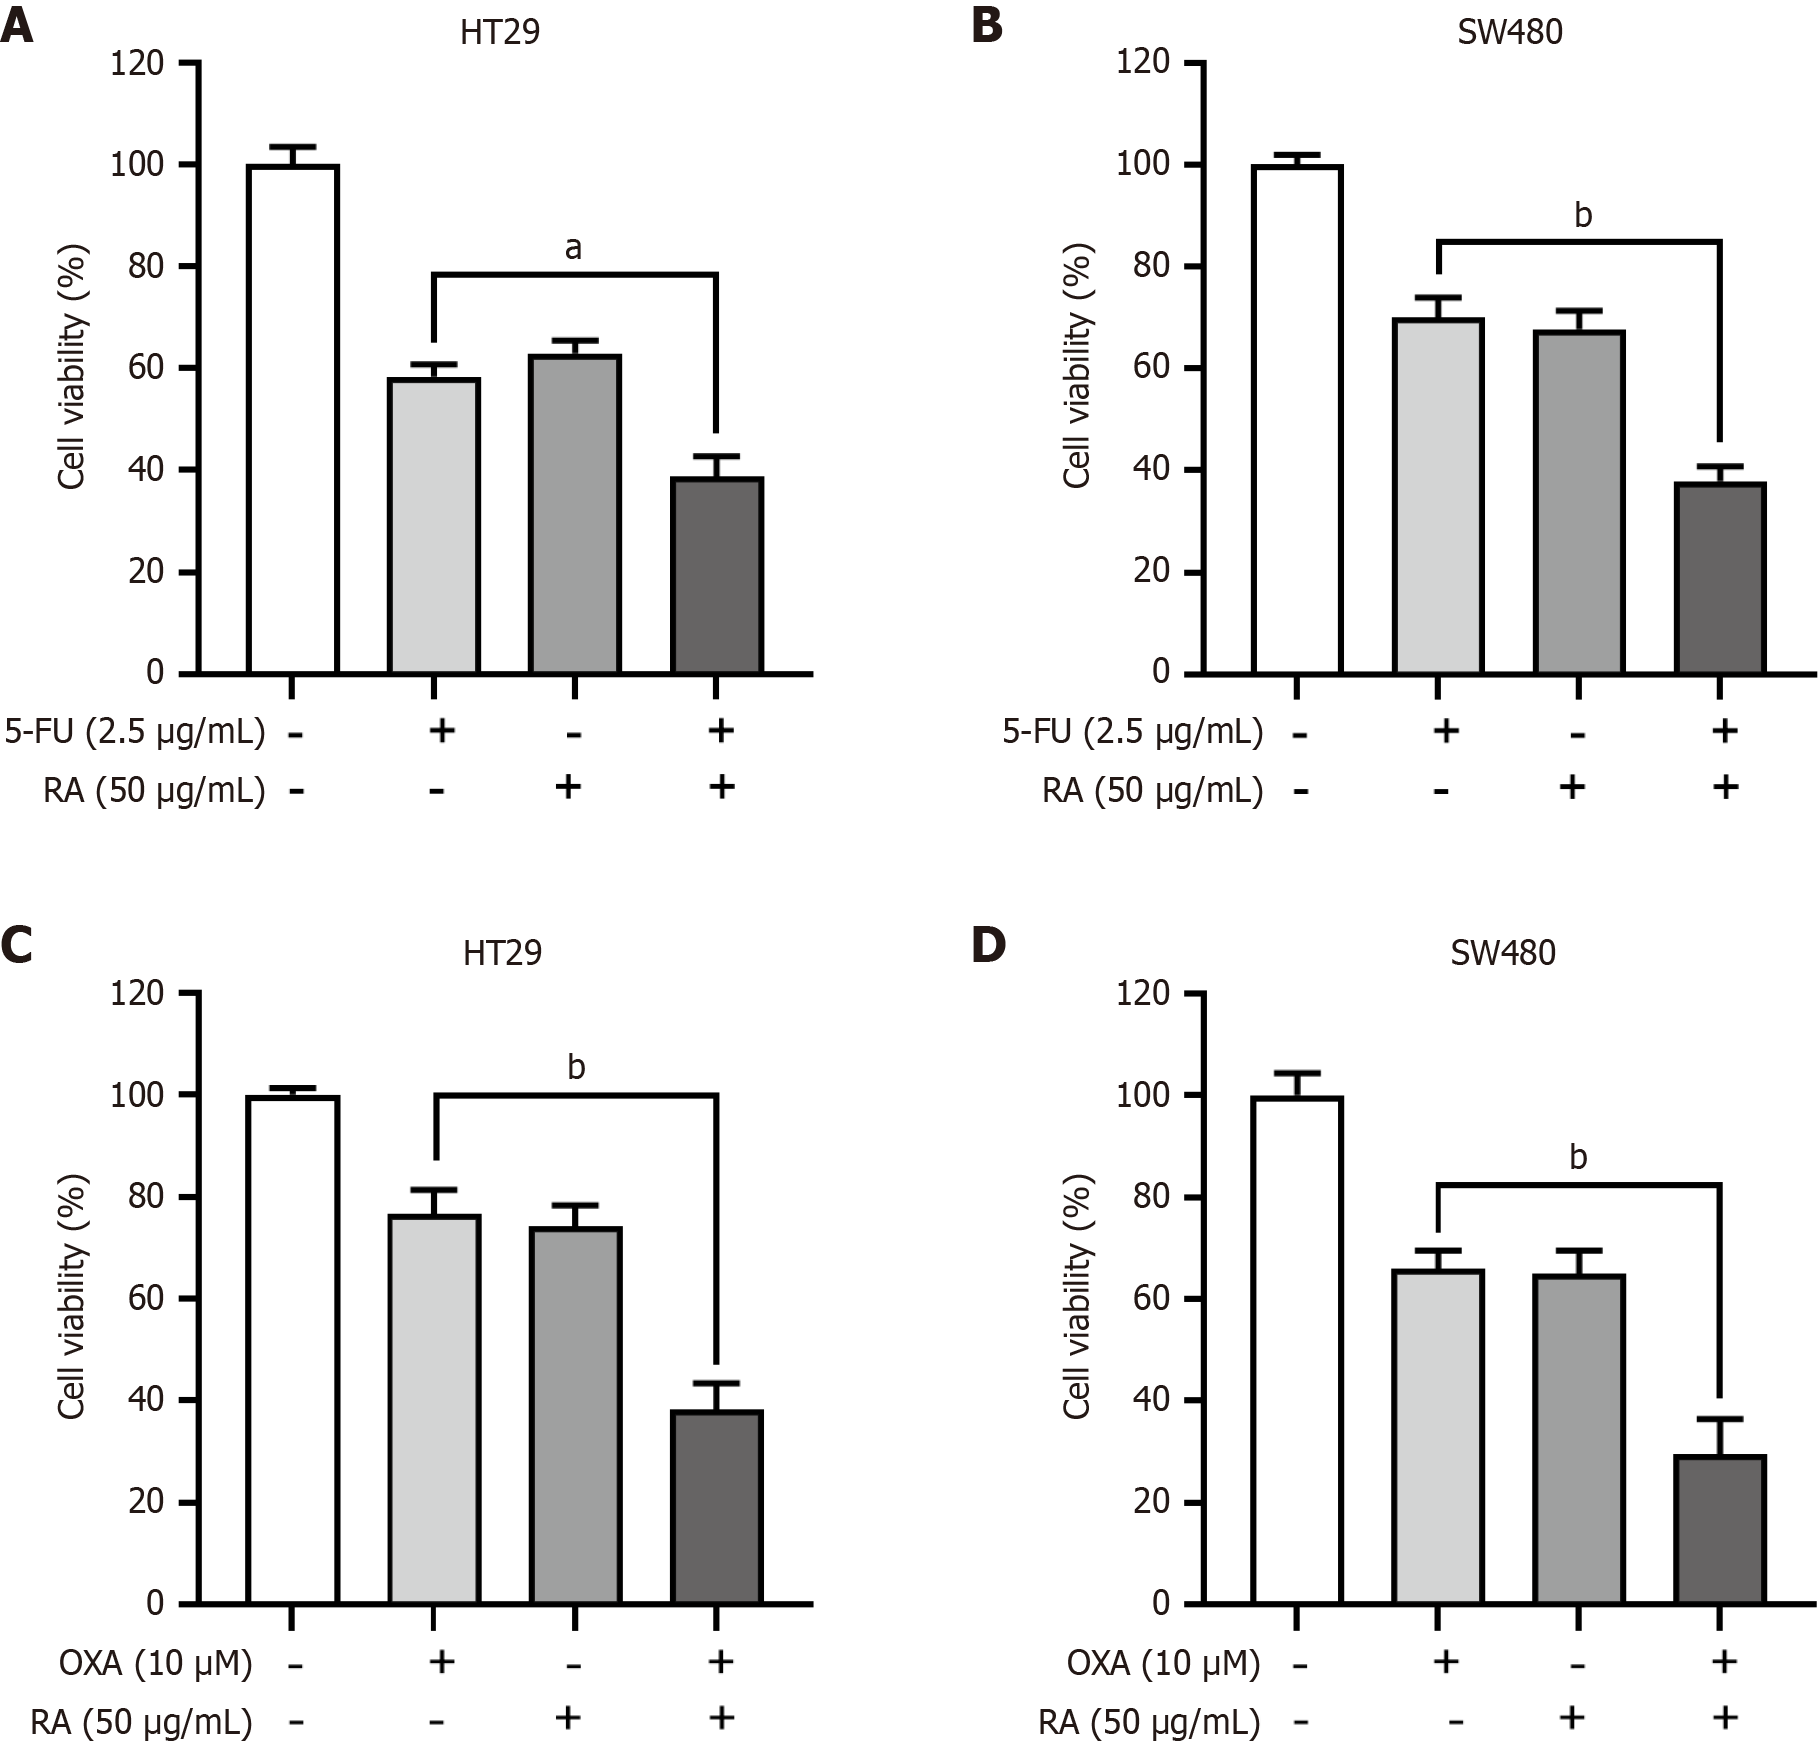
Figure 5 Rosmarinic acid enhances chemotherapeutical effects in colorectal cancer cells.
A and B: HT29 (A) and SW480 (B) cells were incubated with 2.5 μg/mL 5-fluorouracil and/or 50 μg/mL rosmarinic acid for 48 hours, followed by Cell Counting Kit-8 assay; C and D: HT29 (C) and SW480 (D) cells were incubated with 10 μM oxaliplatin and/or 50 μg/mL rosmarinic acid for 48 hours, followed by Cell Counting Kit-8 assay. n = 3. Data are shown as the mean ± SD. aP < 0.001, bP < 0.0001. RA: Rosmarinic acid; OXA: Oxaliplatin. 5-FU: 5-fluorouracil.
- Citation: Liu WY, Wang H, Xu X, Wang X, Han KK, You WD, Yang Y, Zhang T. Natural compound rosmarinic acid displays anti-tumor activity in colorectal cancer cells by suppressing nuclear factor-kappa B signaling. World J Clin Oncol 2025; 16(5): 105341
- URL: https://www.wjgnet.com/2218-4333/full/v16/i5/105341.htm
- DOI: https://dx.doi.org/10.5306/wjco.v16.i5.105341


