©The Author(s) 2025.
World J Clin Oncol. Jan 24, 2025; 16(1): 94813
Published online Jan 24, 2025. doi: 10.5306/wjco.v16.i1.94813
Published online Jan 24, 2025. doi: 10.5306/wjco.v16.i1.94813
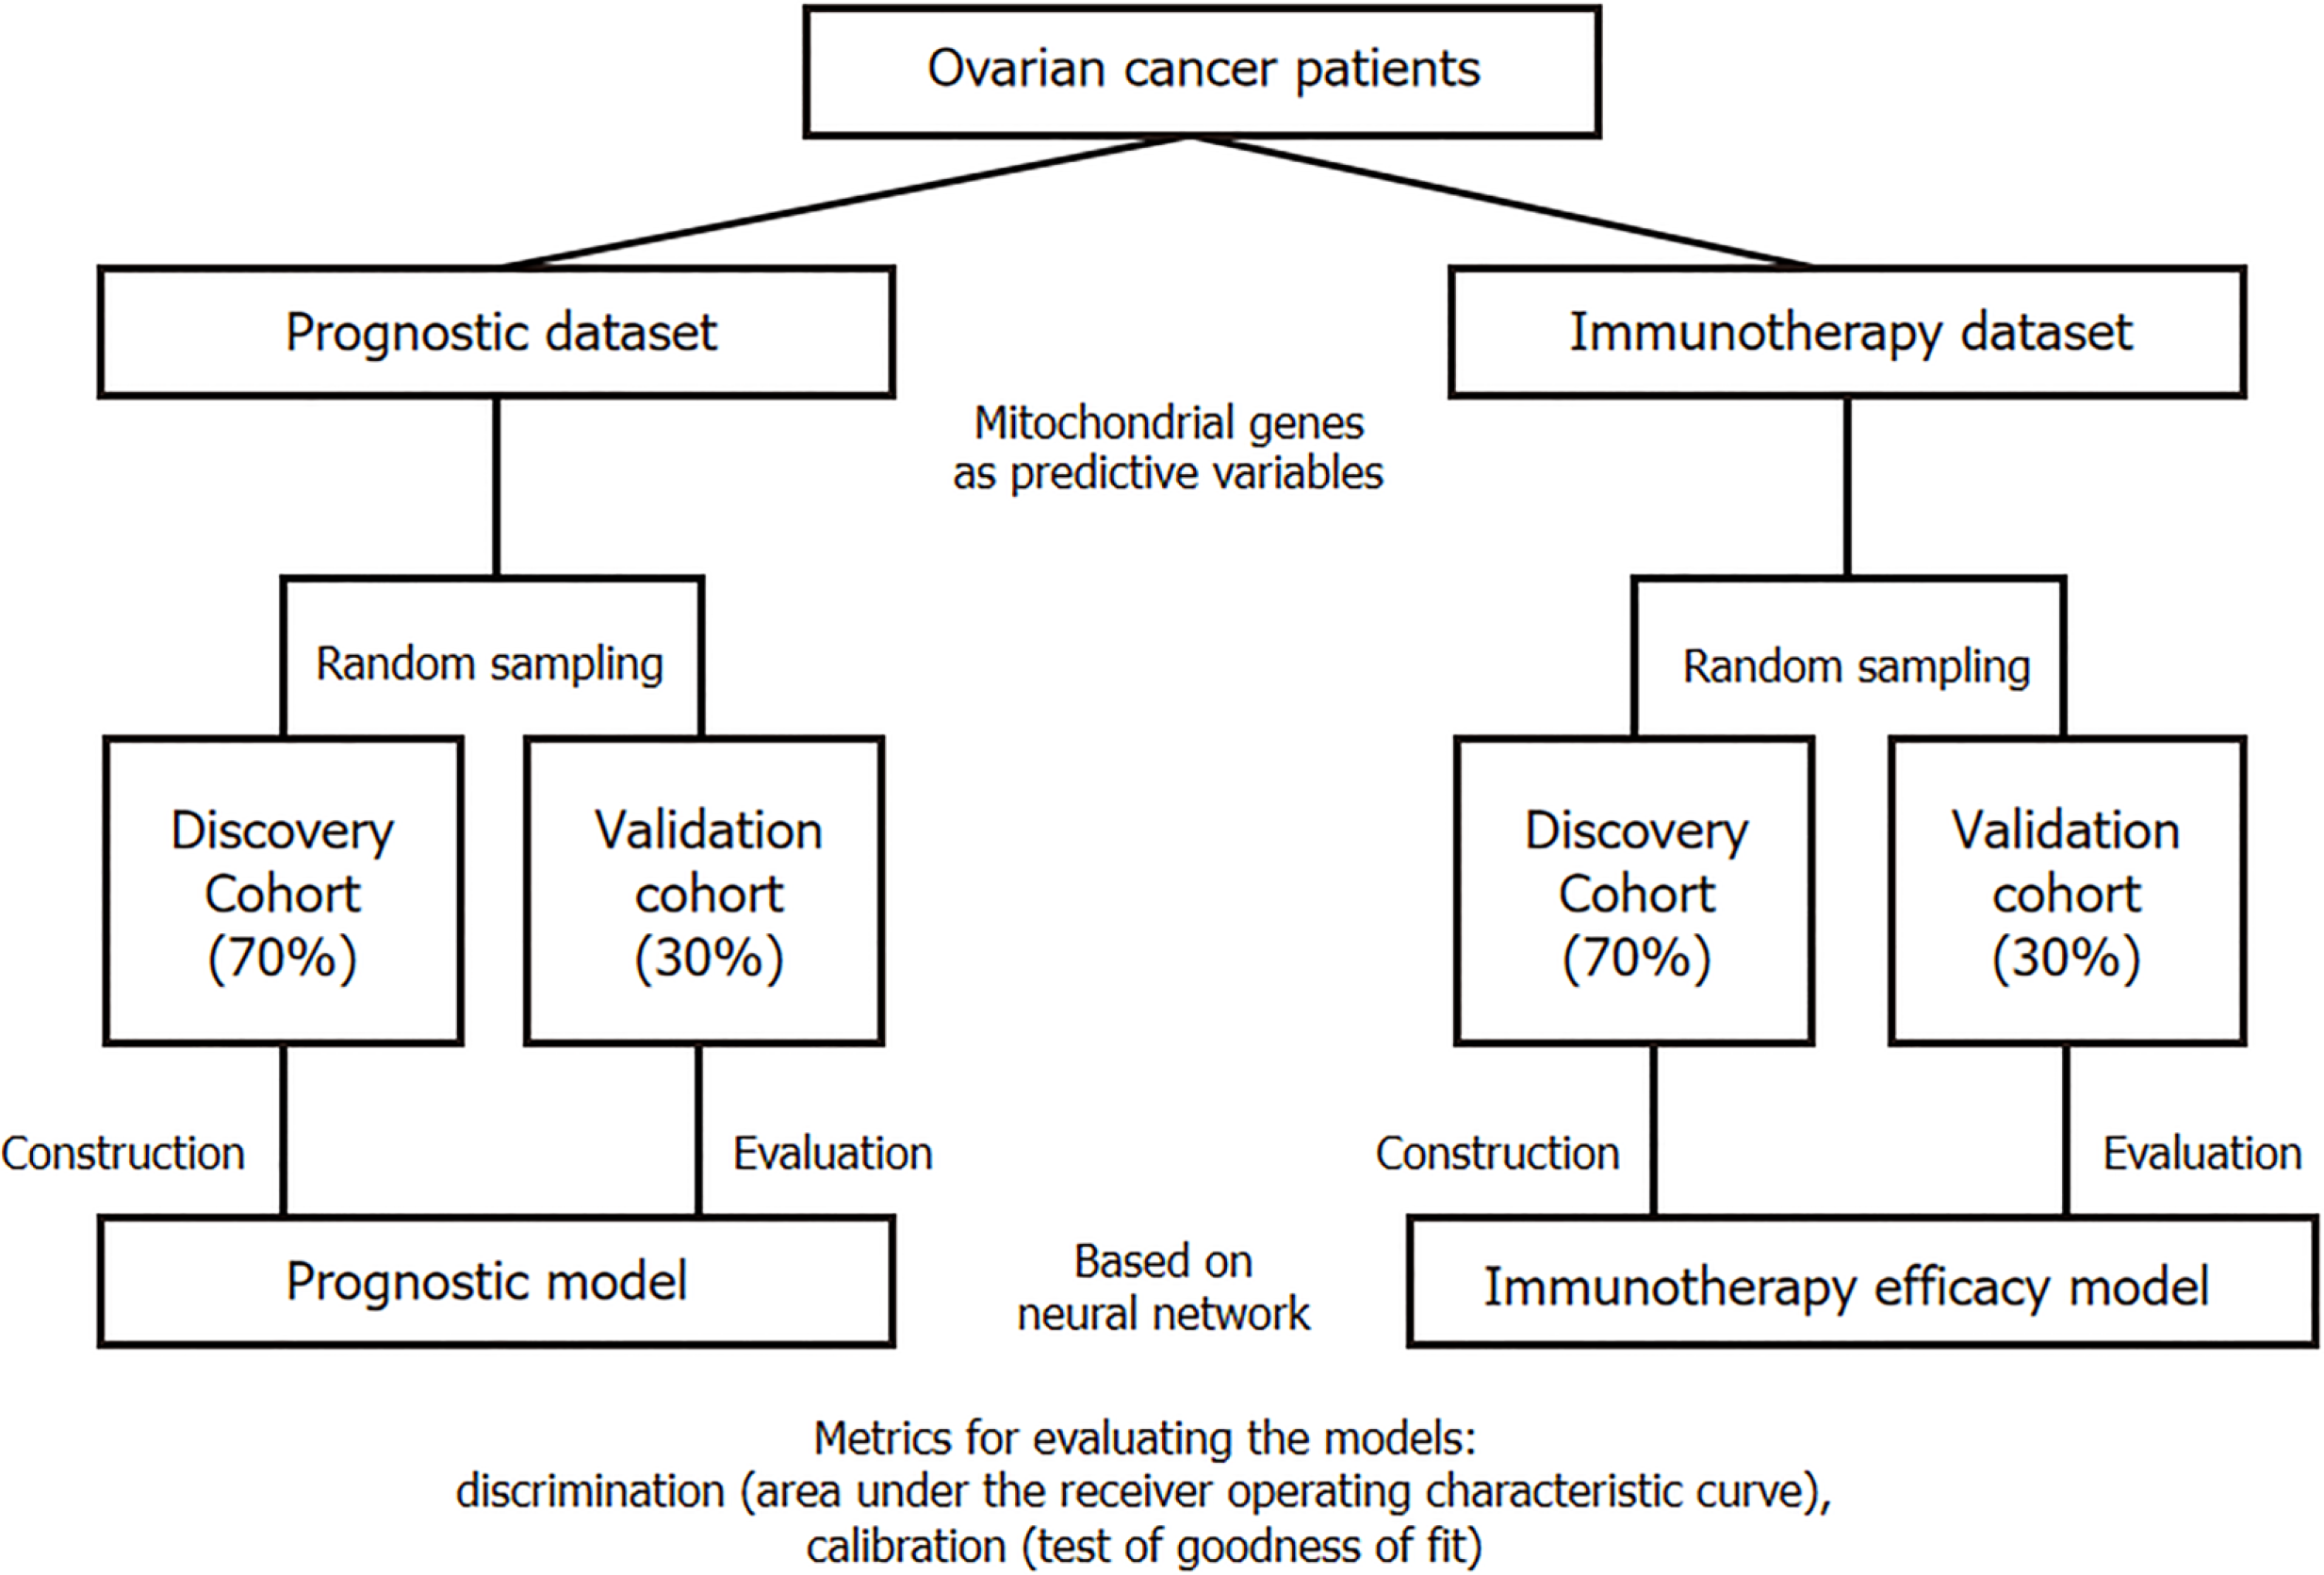
Figure 1
Flow chart of this study.
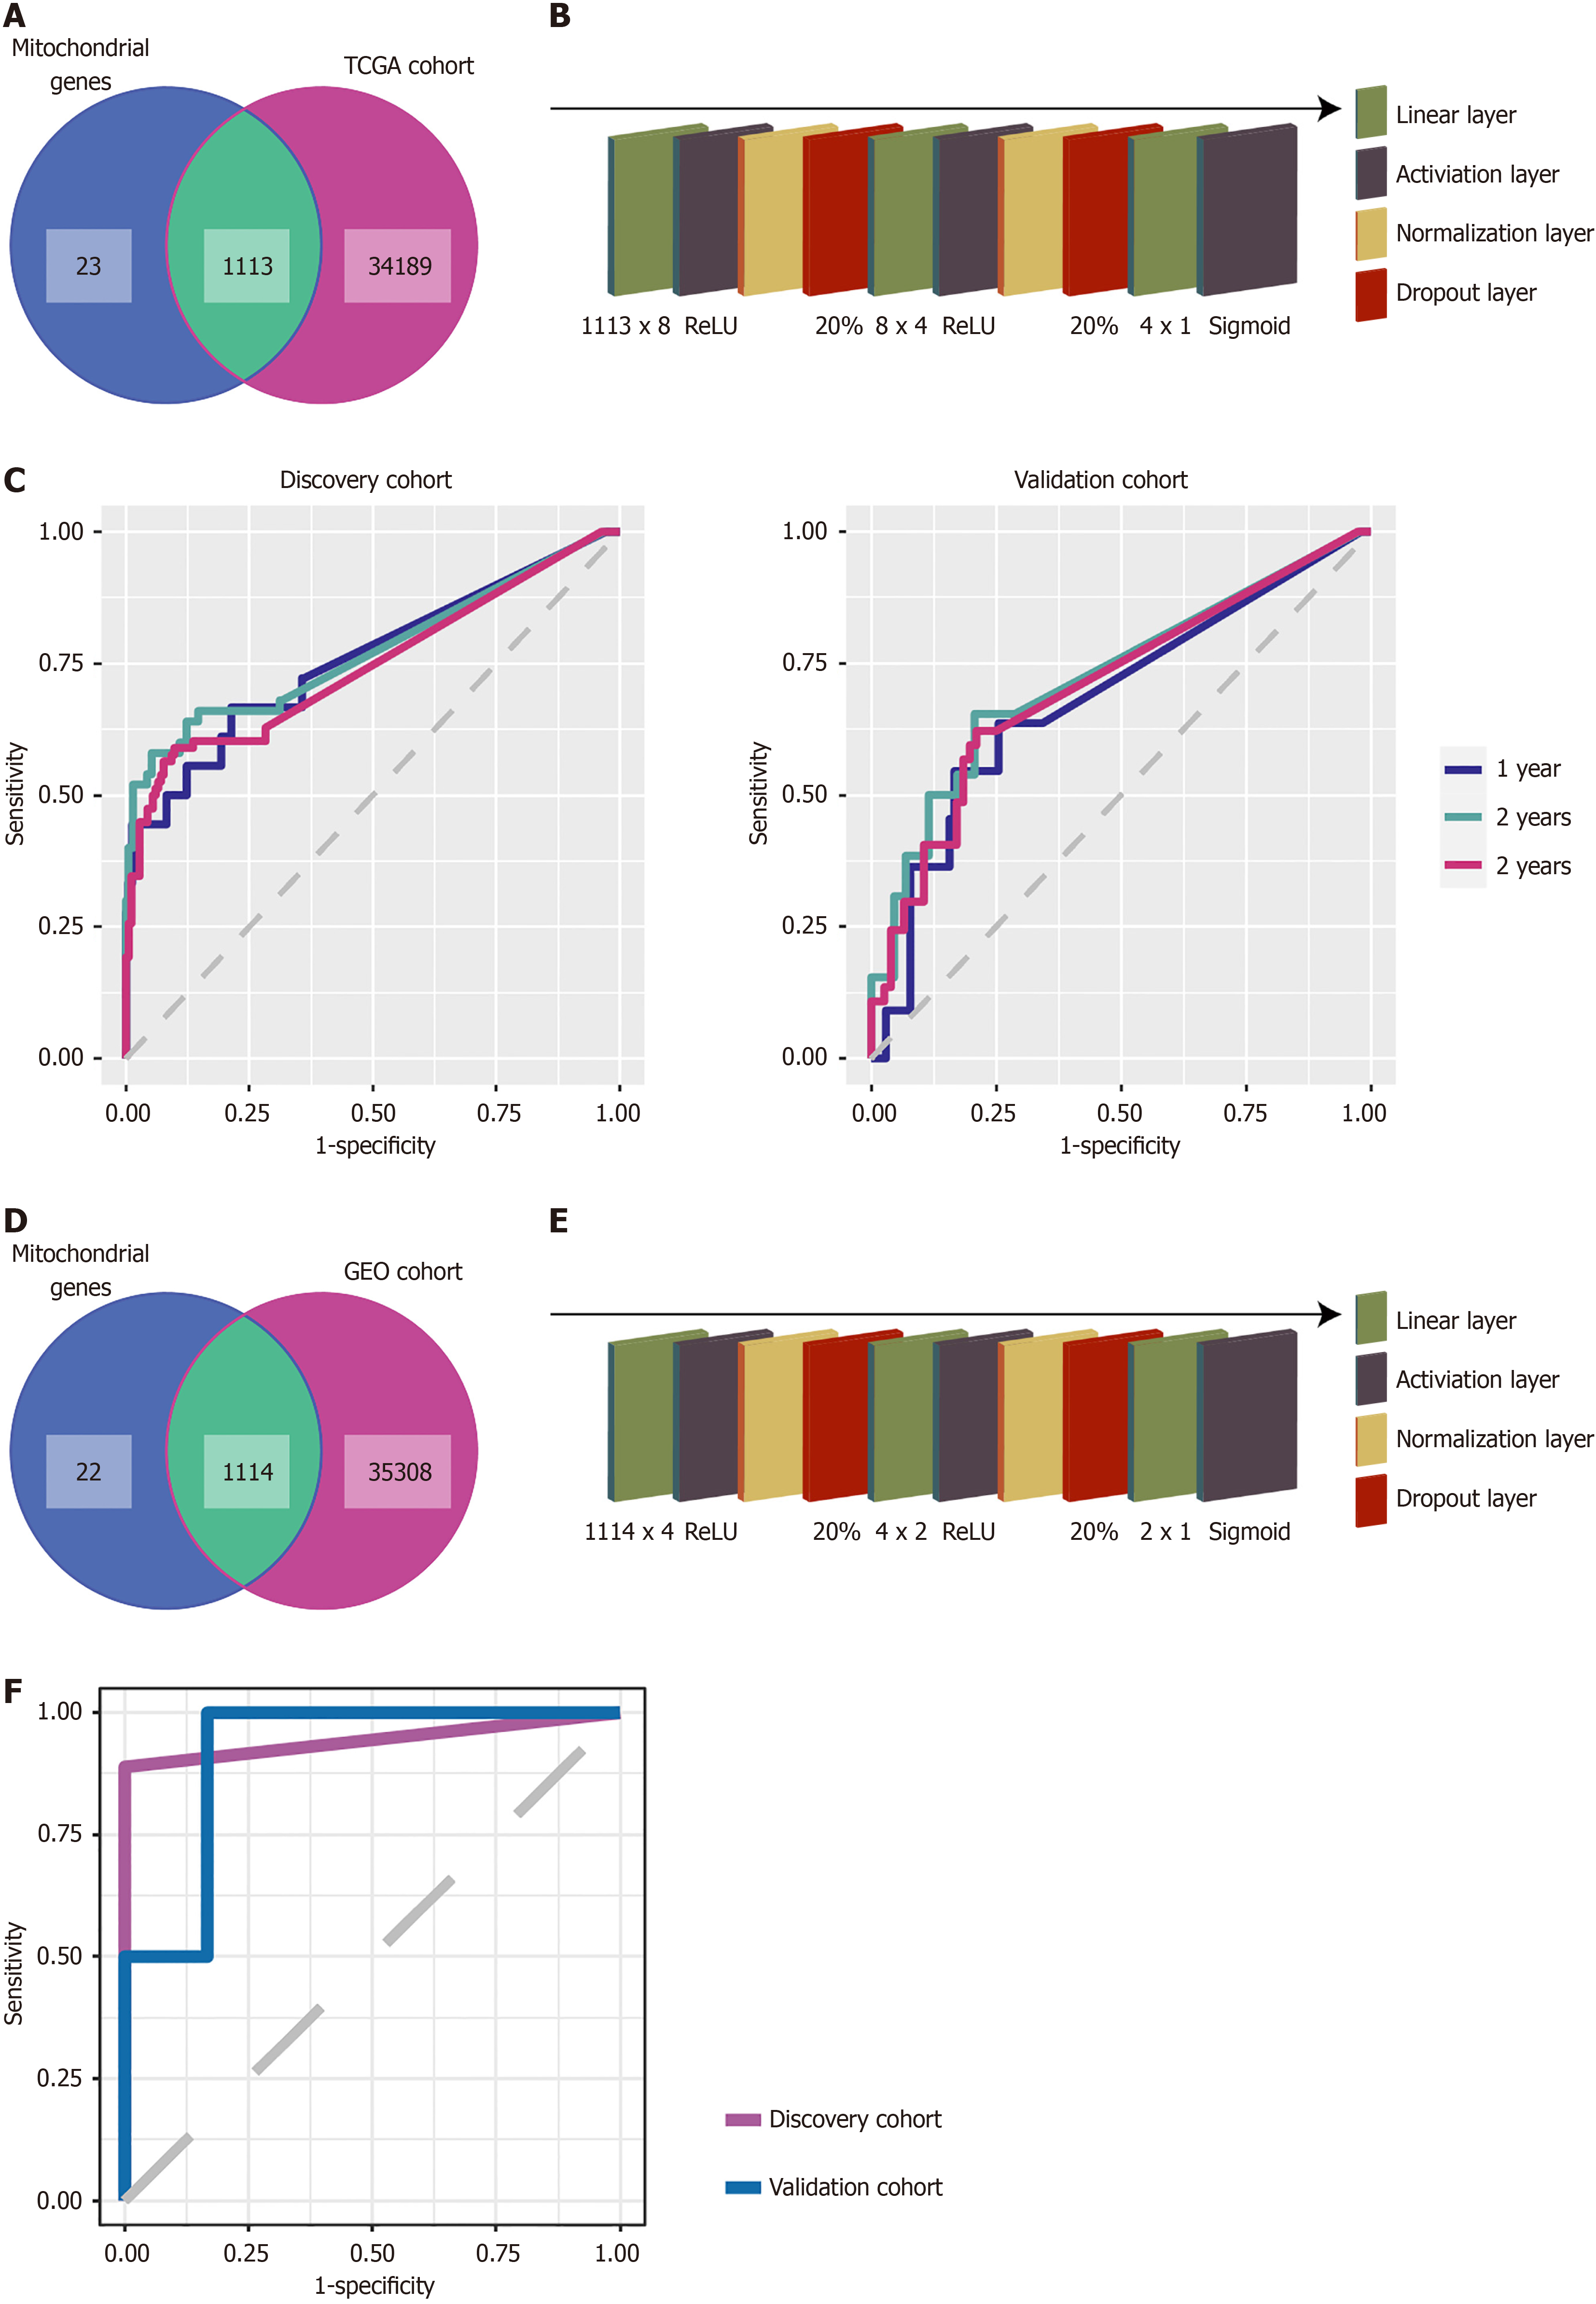
Figure 2 Process of constructing prognostic and immunotherapy efficacy models of ovarian cancer.
A: Predictive genes of prognostic model; B: Neural network structure of prognostic model; C: Receiver operating characteristic curves of prognostic model; D: Predictive genes of immunotherapy model; E: Neural network structure of immunotherapy model; F: Receiver operating characteristic curve of immunotherapy model. GEO: Gene Expression Omnibus; TCGA: The Cancer Genome Atlas Program.
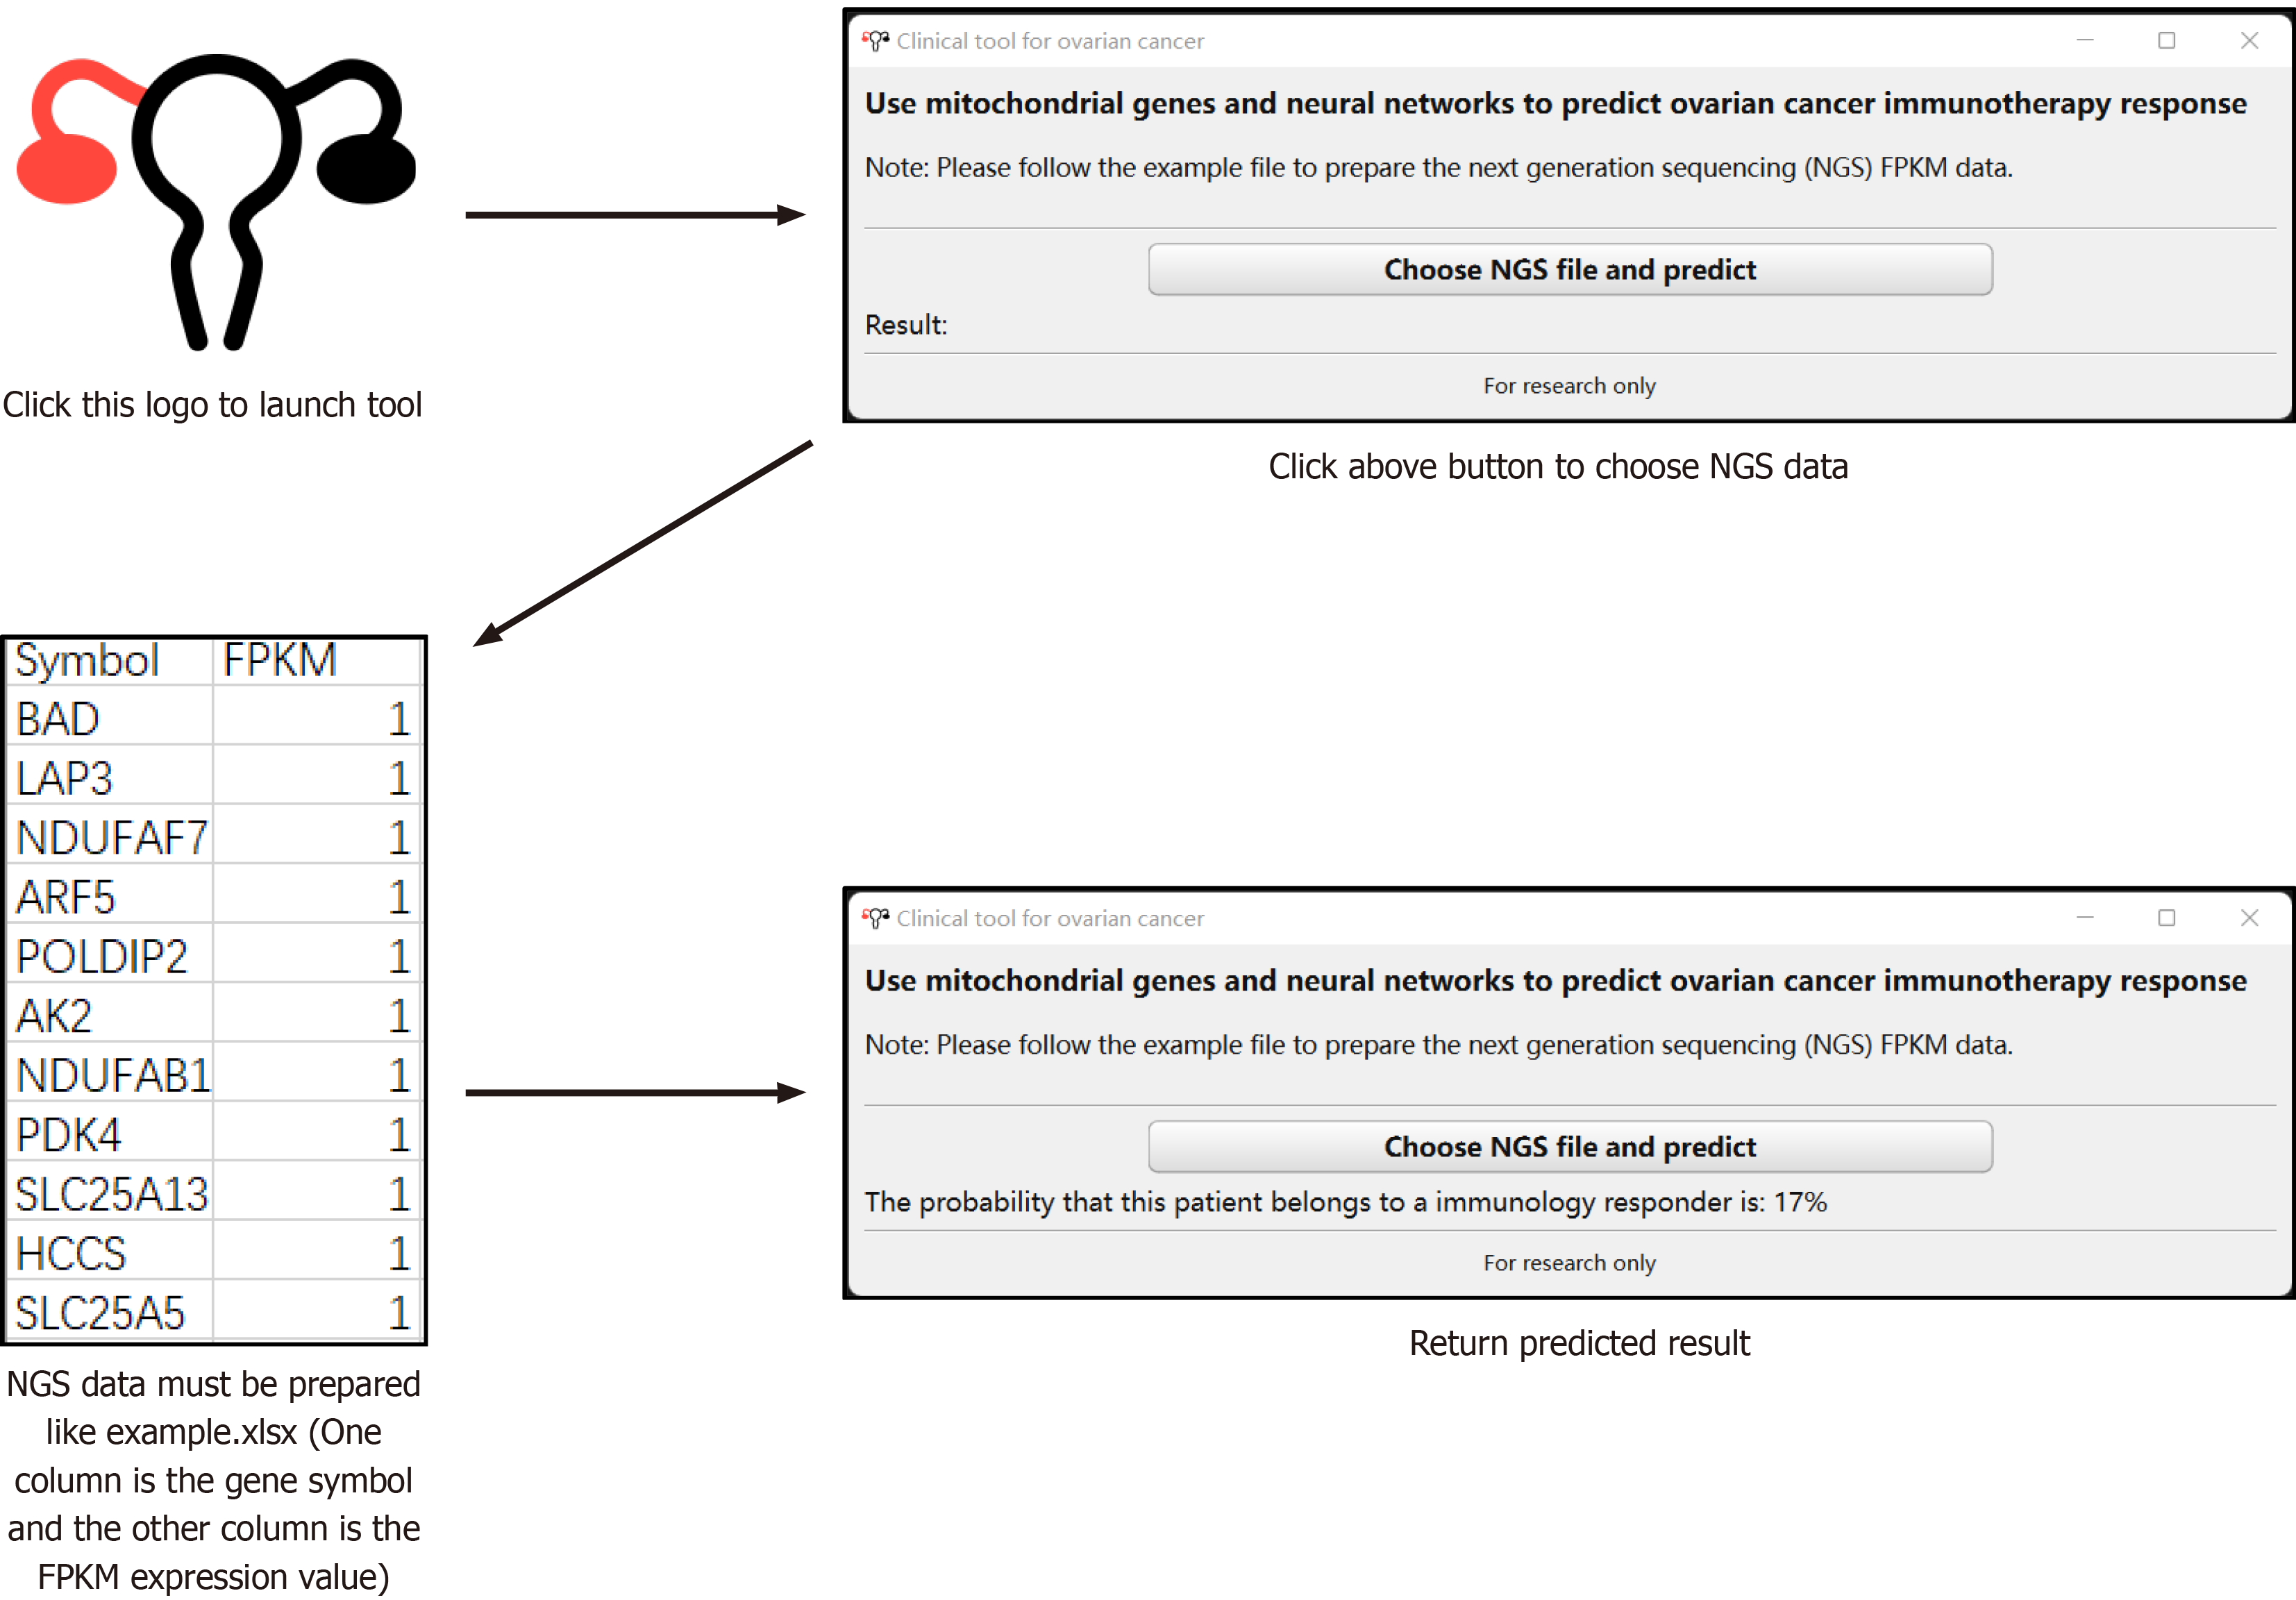
Figure 3 Use of the tool for predicting immunotherapy response in ovarian cancer.
NGS: Next generation sequencing.
- Citation: Tang ZJ, Pan YM, Li W, Ma RQ, Wang JL. Unlocking the future: Mitochondrial genes and neural networks in predicting ovarian cancer prognosis and immunotherapy response. World J Clin Oncol 2025; 16(1): 94813
- URL: https://www.wjgnet.com/2218-4333/full/v16/i1/94813.htm
- DOI: https://dx.doi.org/10.5306/wjco.v16.i1.94813


