©The Author(s) 2024.
World J Clin Oncol. Jul 24, 2024; 15(7): 895-907
Published online Jul 24, 2024. doi: 10.5306/wjco.v15.i7.895
Published online Jul 24, 2024. doi: 10.5306/wjco.v15.i7.895
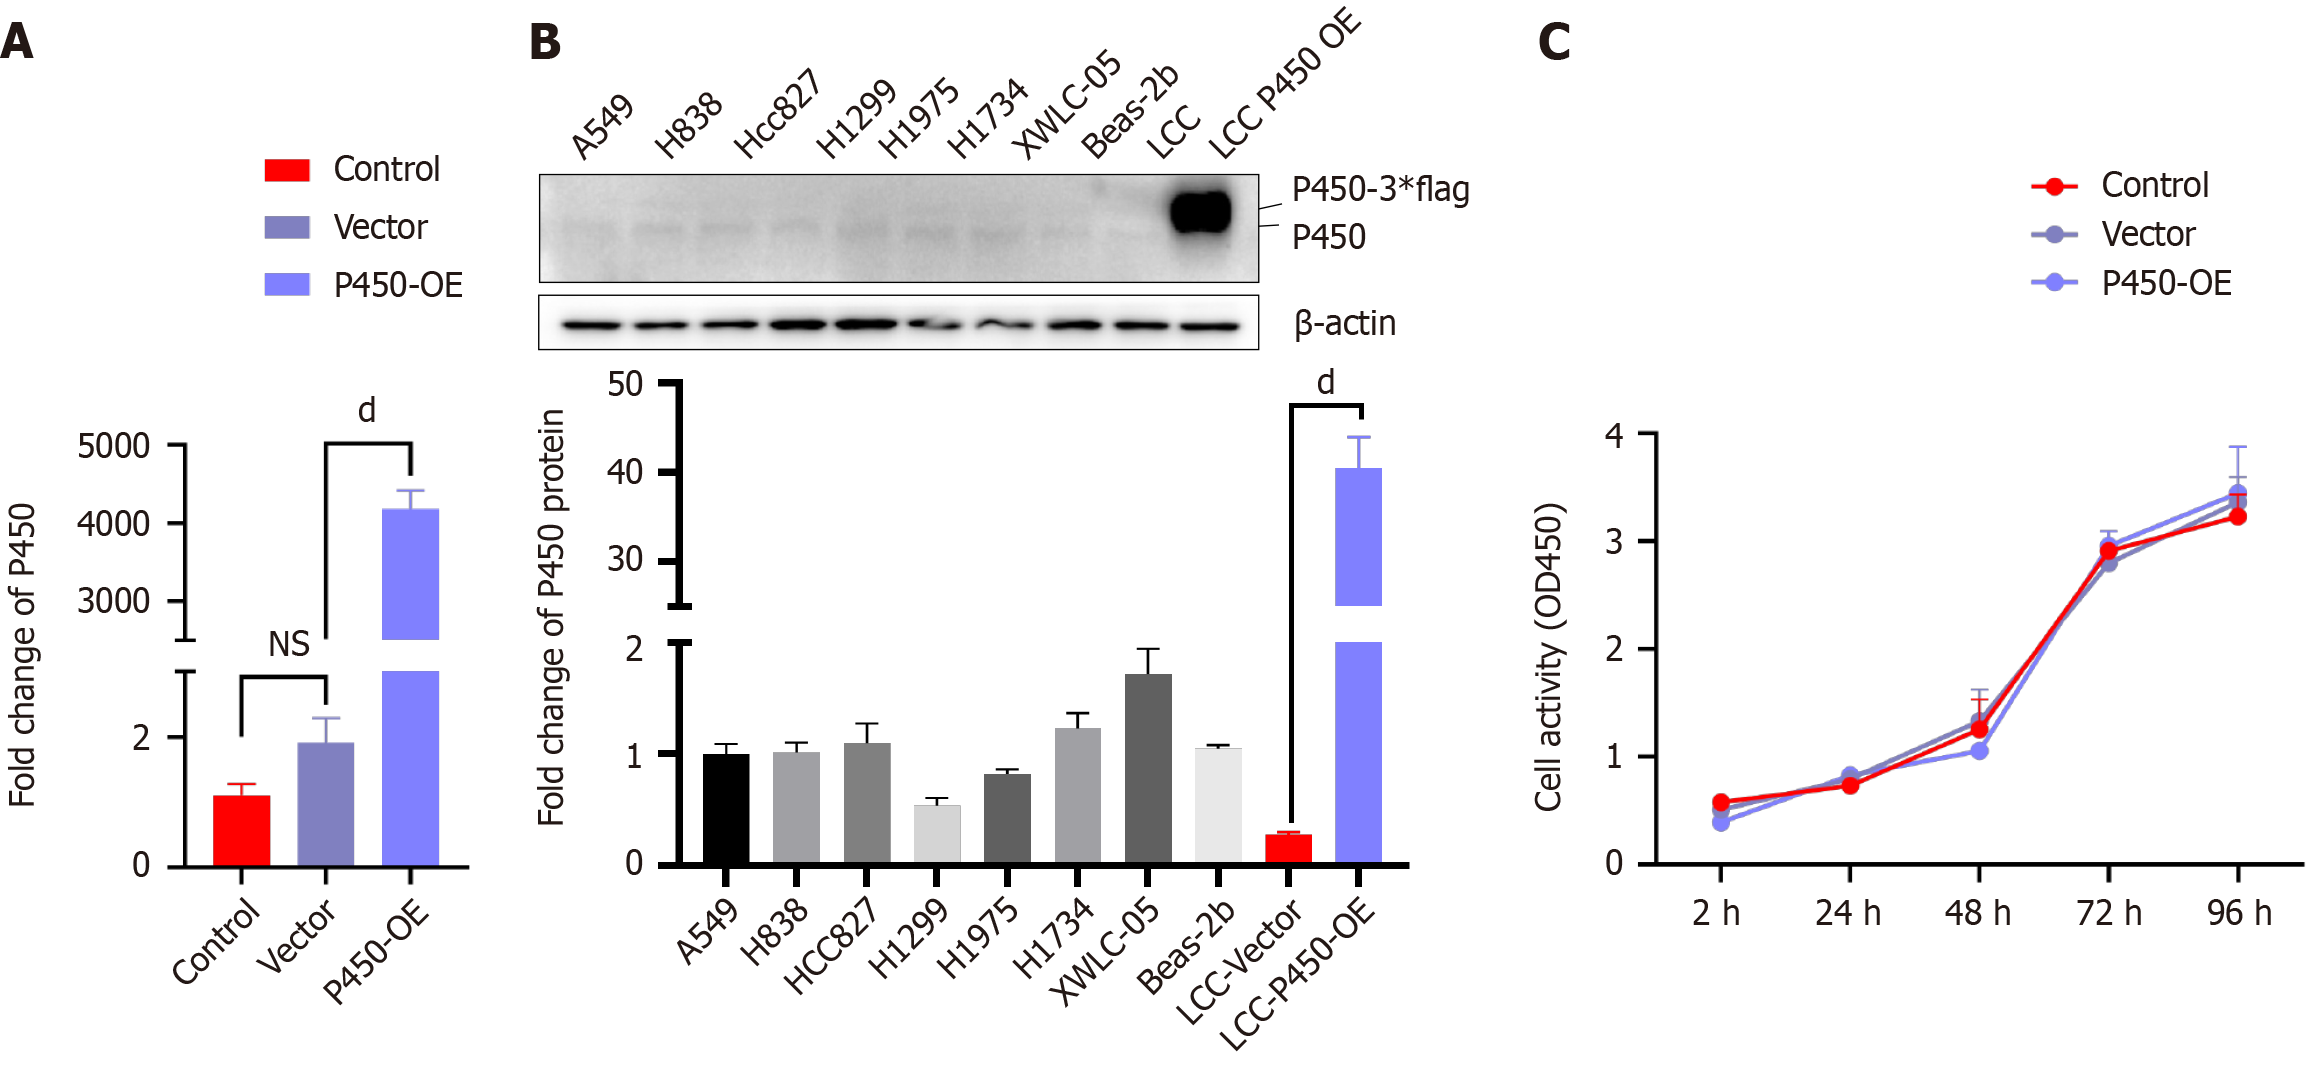
Figure 1 P450 expression detection in different cell lines and the effect of its overexpression on Lewis lung cancer cells cell activity.
A: Q-PCR detection of P450 mRNA expression in Lewis lung cancer cells (LLC) cells transfected with P450 overexpression plasmid (P450-OE); B: Western blot detection of P450 protein in different cell lines. Full undamaged Gels and Blots images are shown in Supplementary Figure 1; C: CCK8 assay of LLC cells transfected with P450-OE plasmid or the vector plasmid. n = 3, dP < 0.0001; NS: Not significant; LCC: Lewis lung cancer cells.
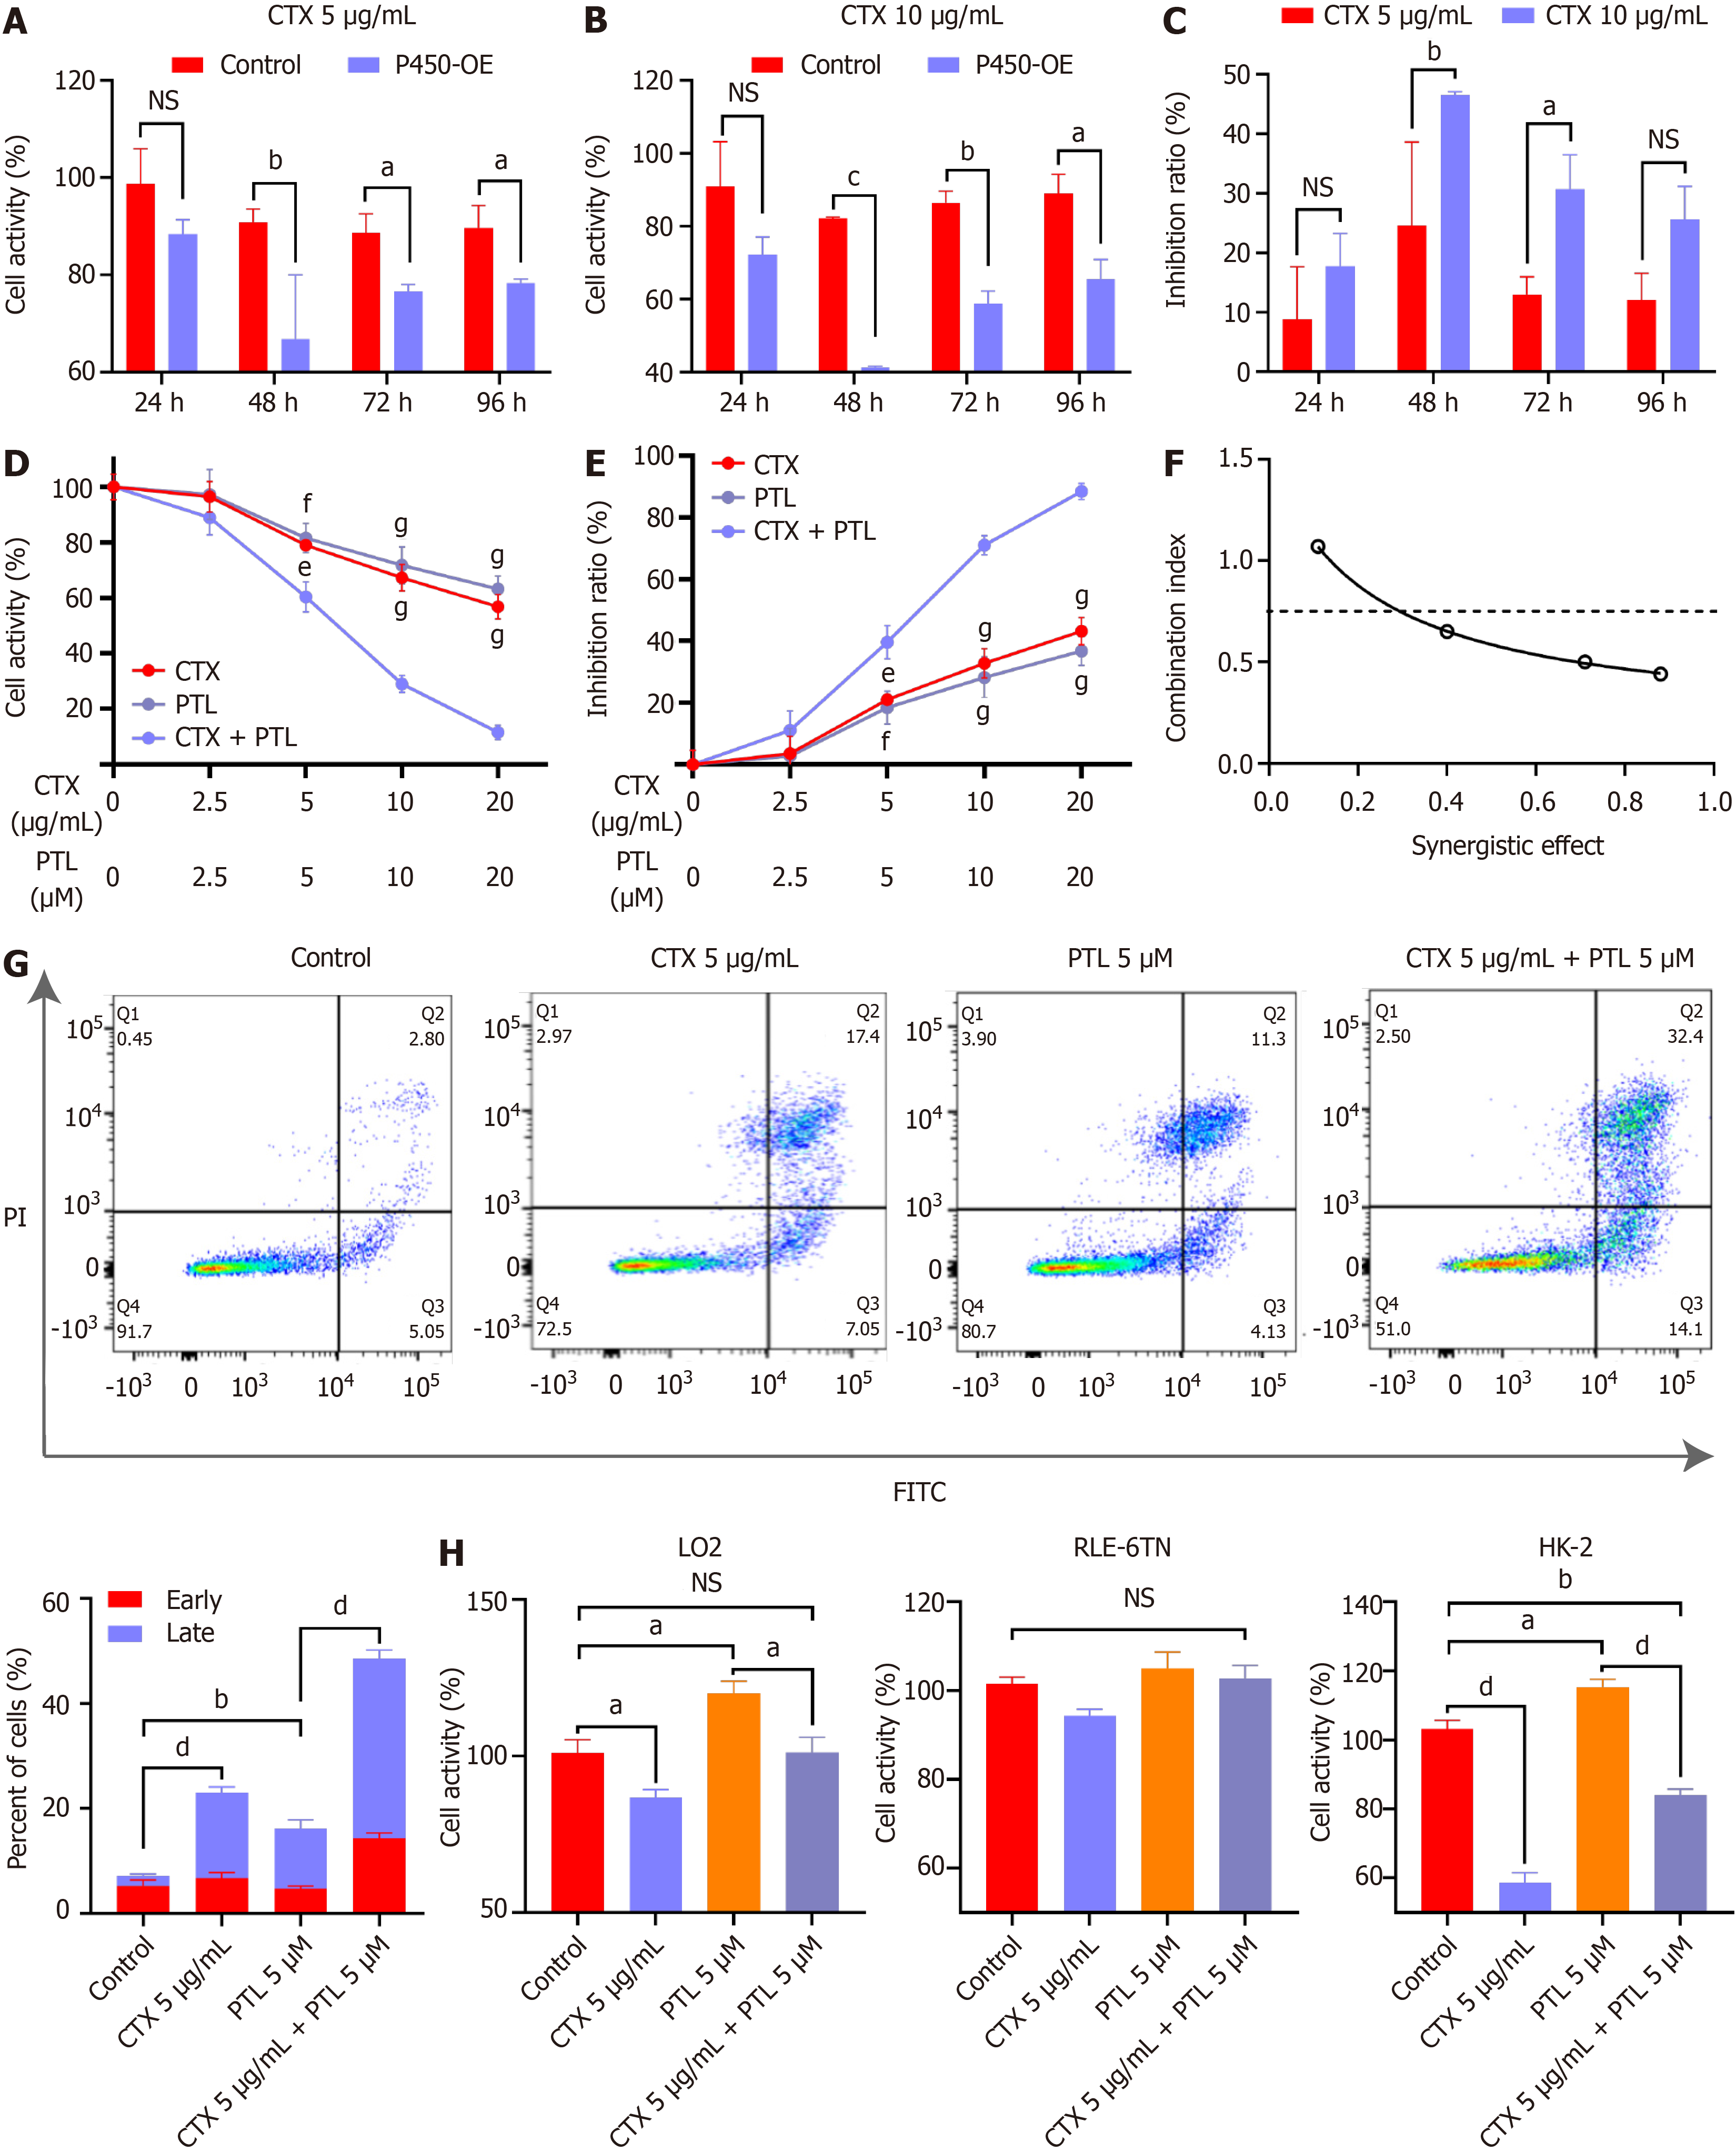
Figure 2 Parthenolide enhanced cytotoxicity of cyclophosphamide on P450 overexpressed Lewis lung cancer cells.
A and B: P450 overexpression plasmid (P450-OE) and Control groups were treated with 5 ug/mL (A) or 10 ug/mL (B) cyclophosphamide (CTX), and its inhibitory effect on cell proliferation was evaluated using CCK8 assay; C: Comparison of proliferation inhibition percentage of P450-OE Lewis lung cancer cells (LLCs) treated with 5 and 10 ug/mL CTX; D: Cells were treated with different concentrations of CTX, Parthenolide (PTL), or a combination of the two drugs for 48 hours, and cell viability was detected by CCK-8 assay; E: Inhibition curve of different groups; F: The Combination Index was calculated using CompuSyn software; G: The apoptosis percentage of P450-OE LLC cells was evaluated after 48 hours of exposure to 5 μg/mL CTX and 5 μM PTL individually as well as in combination; H: CCK-8 evaluated the viability of LO2, RLE-6TN and HK-2 cells after treatment with 5 μg/mL CTX and 5 μM PTL individually as well as in combination for 48 hours. n = 3, aP < 0.05; bP < 0.01; cP < 0.001; dP < 0.0001. Compared with CTX + PTL group, eP < 0.01; fP < 0.001; gP < 0.0001; NS: Not significant. PTL: Parthenolide; CTX: Cyclophosphamide.
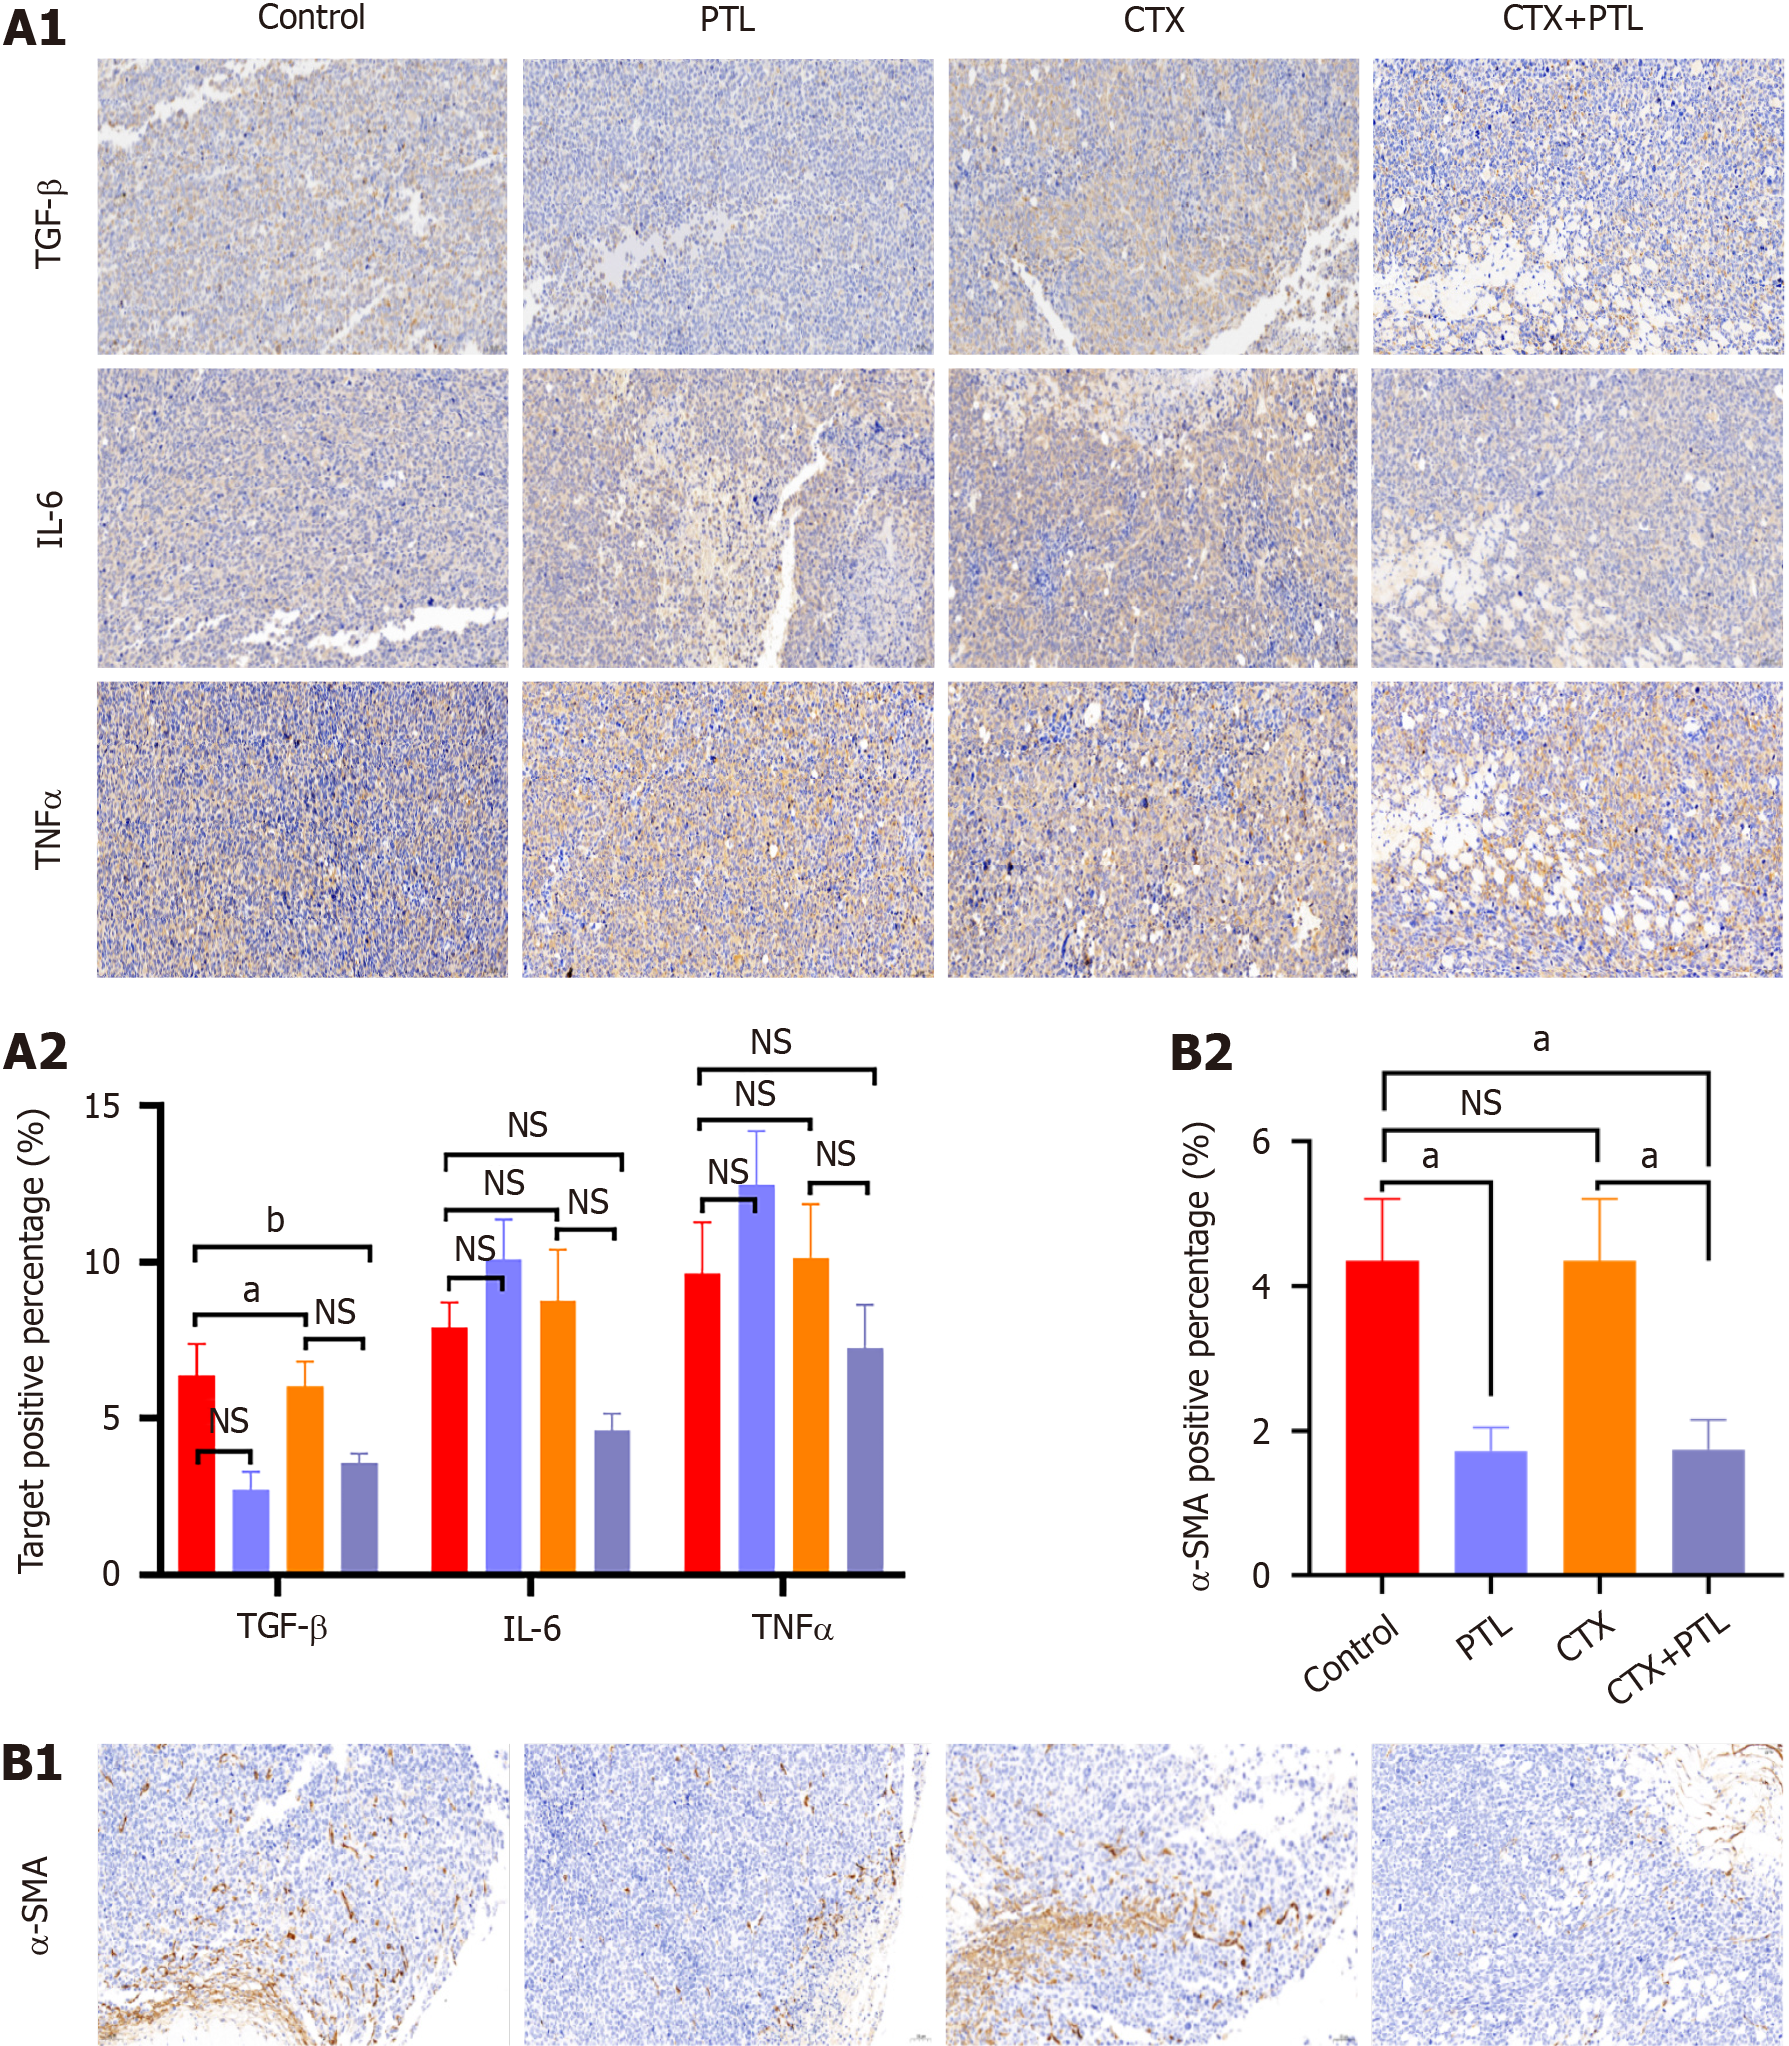
Figure 5 Influence of parthenolide combined with cyclophosphamide on the immune microenvironment in the transplanted tumor.
A: Immunohistochemistry (IHC) staining of transforming growth factor β (TGF-β), IL-6, and tumor necrosis factor α (TNF-a), and the percentage of TGF-β, IL-6, and TNF-a positive cells in different treatment groups were compared; B: A-SMA IHC staining in tumor tissues. Magnification: 200 ×. n = 10; aP < 0.05; bP < 0.01; cP < 0.001; dP < 0.0001; NS: Not significant. PTL: Parthenolide; CTX: Cyclophosphamide.
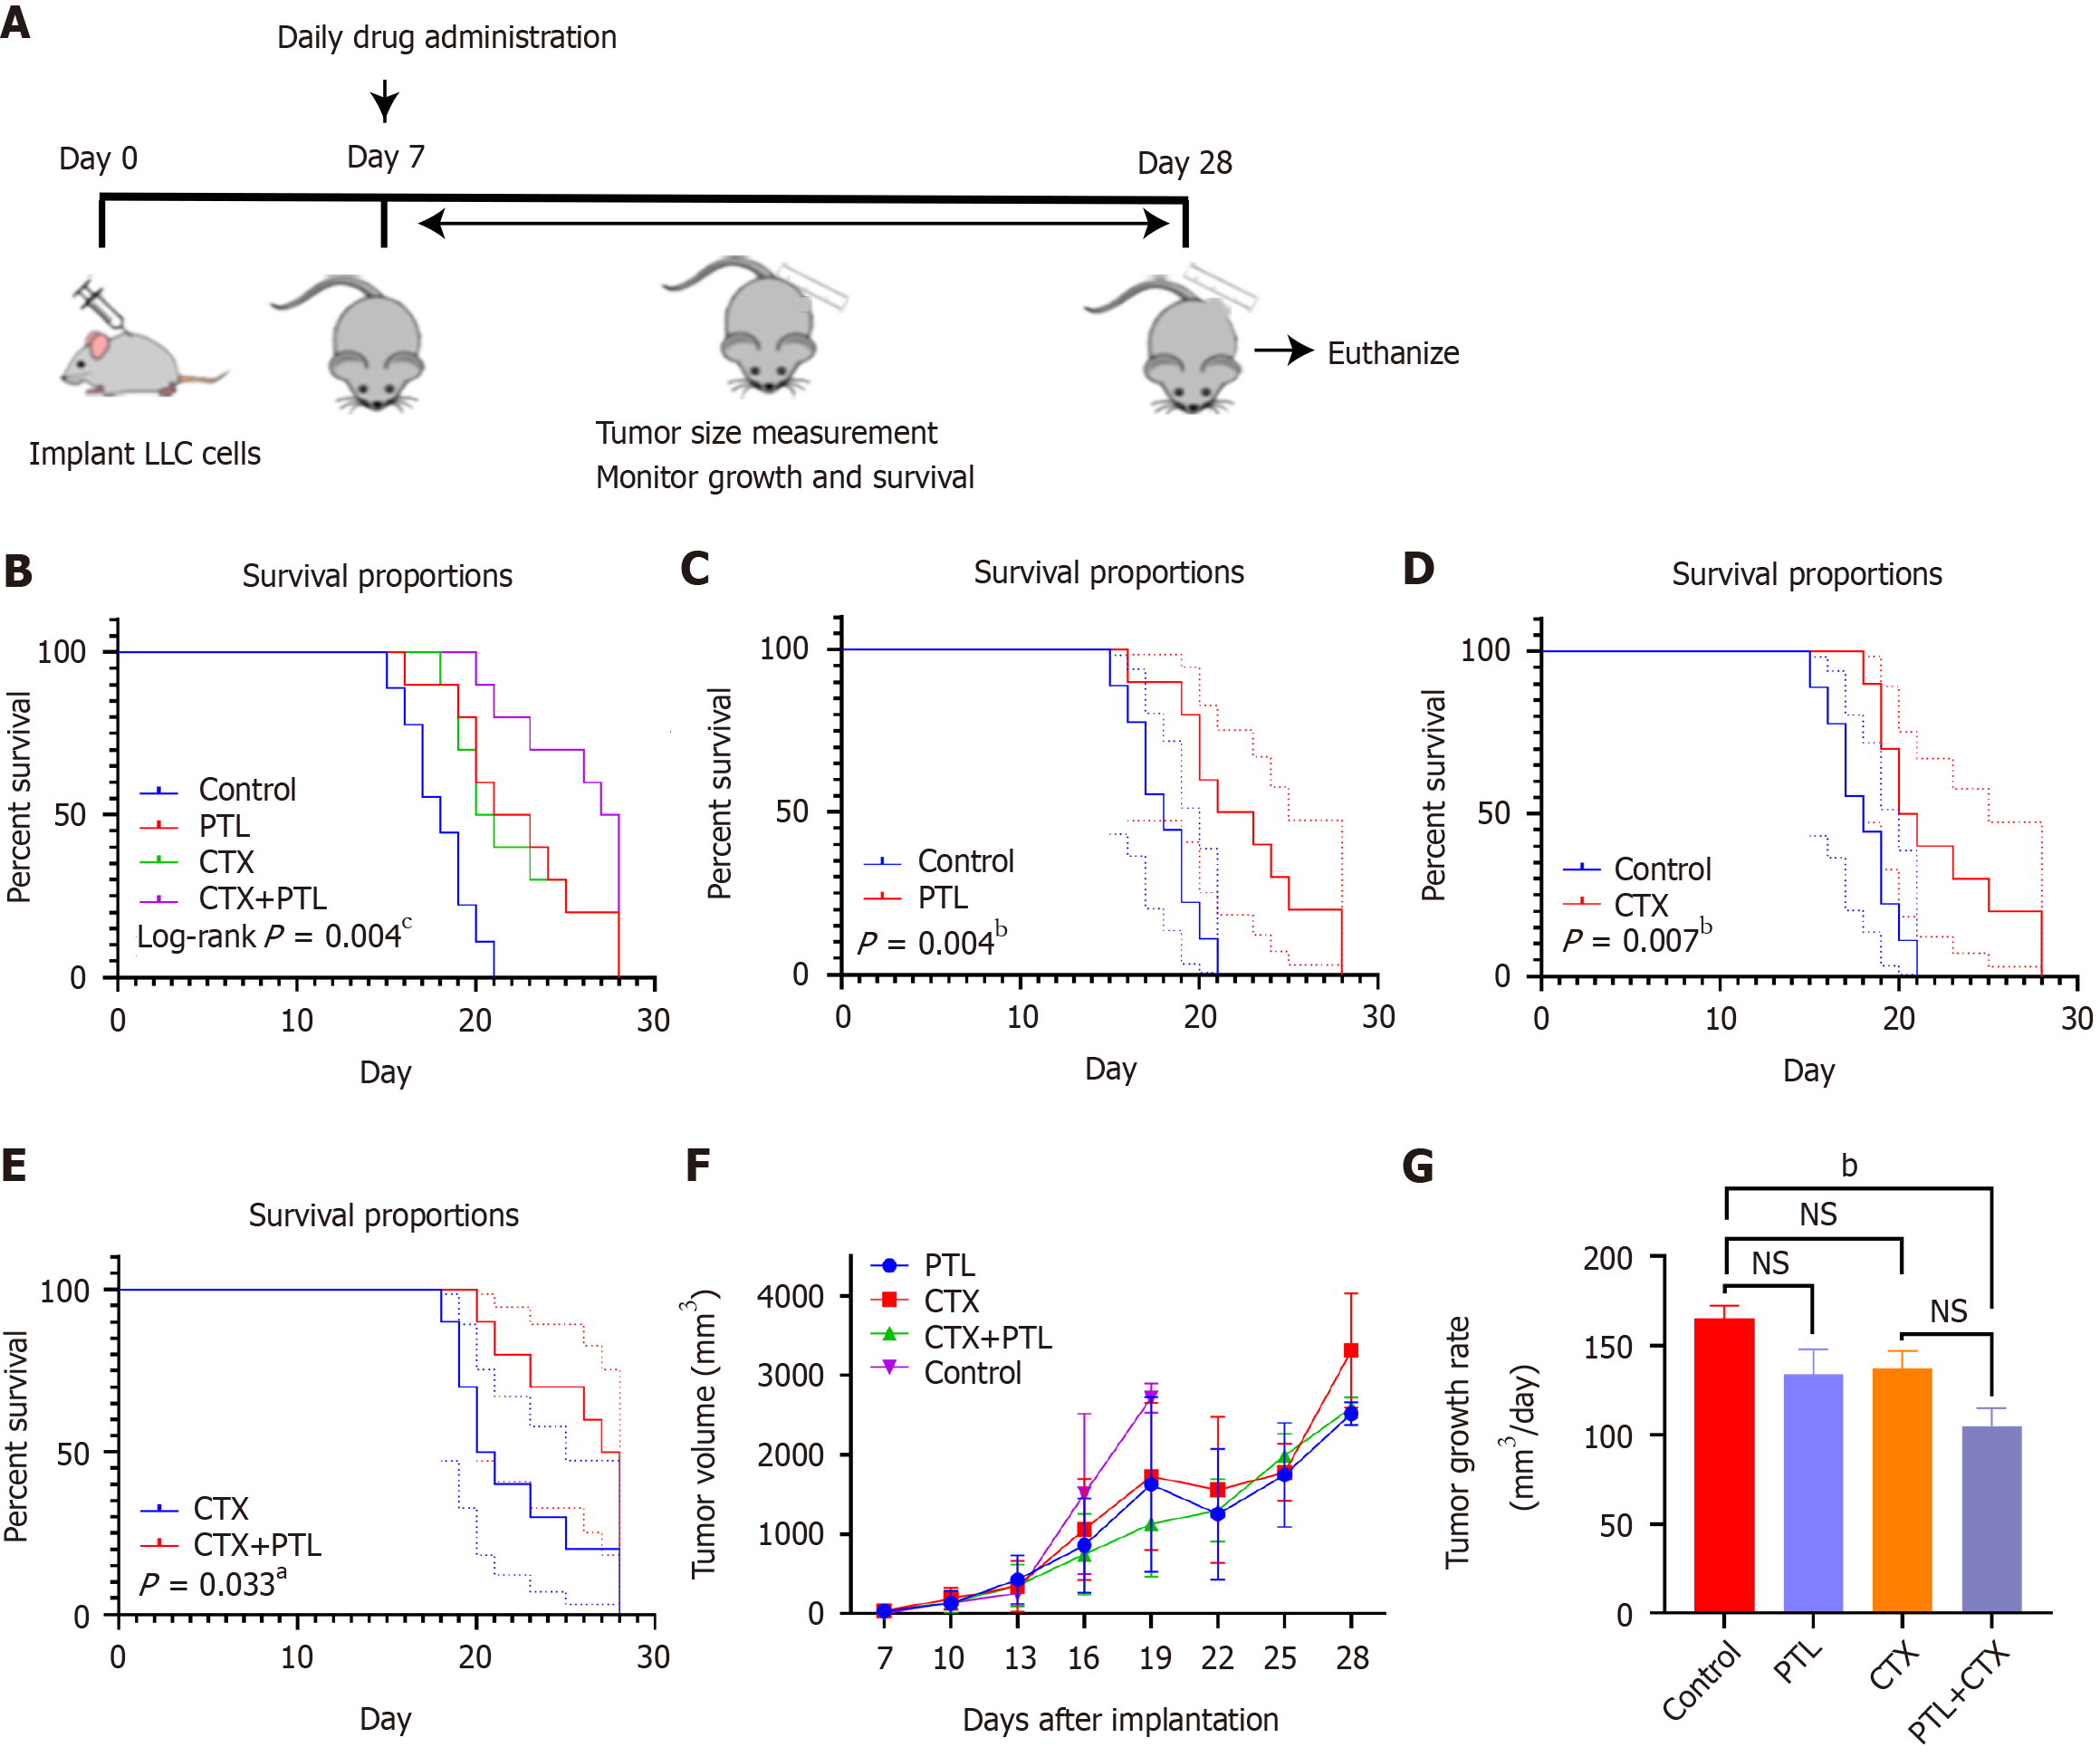
Figure 3 Survival analysis of tumor-bearing mice.
A: Animal experiment process; B: Survival curve and log-rank analysis of 4 groups of tumor-bearing mice; C: Survival comparison between control and parthenolide (PTL) groups; D: Survival comparison between control and cyclophosphamide (CTX) chemotherapy groups; E: Comparison between CTX and PTL + CTX combined groups; F: Tumor growth curve of different groups; G: Comparison of tumor growth rate. n = 10, aP < 0.05, bP < 0.01, cP < 0.001. NS: Not significant; PTL: Parthenolide; CTX: Cyclophosphamide.
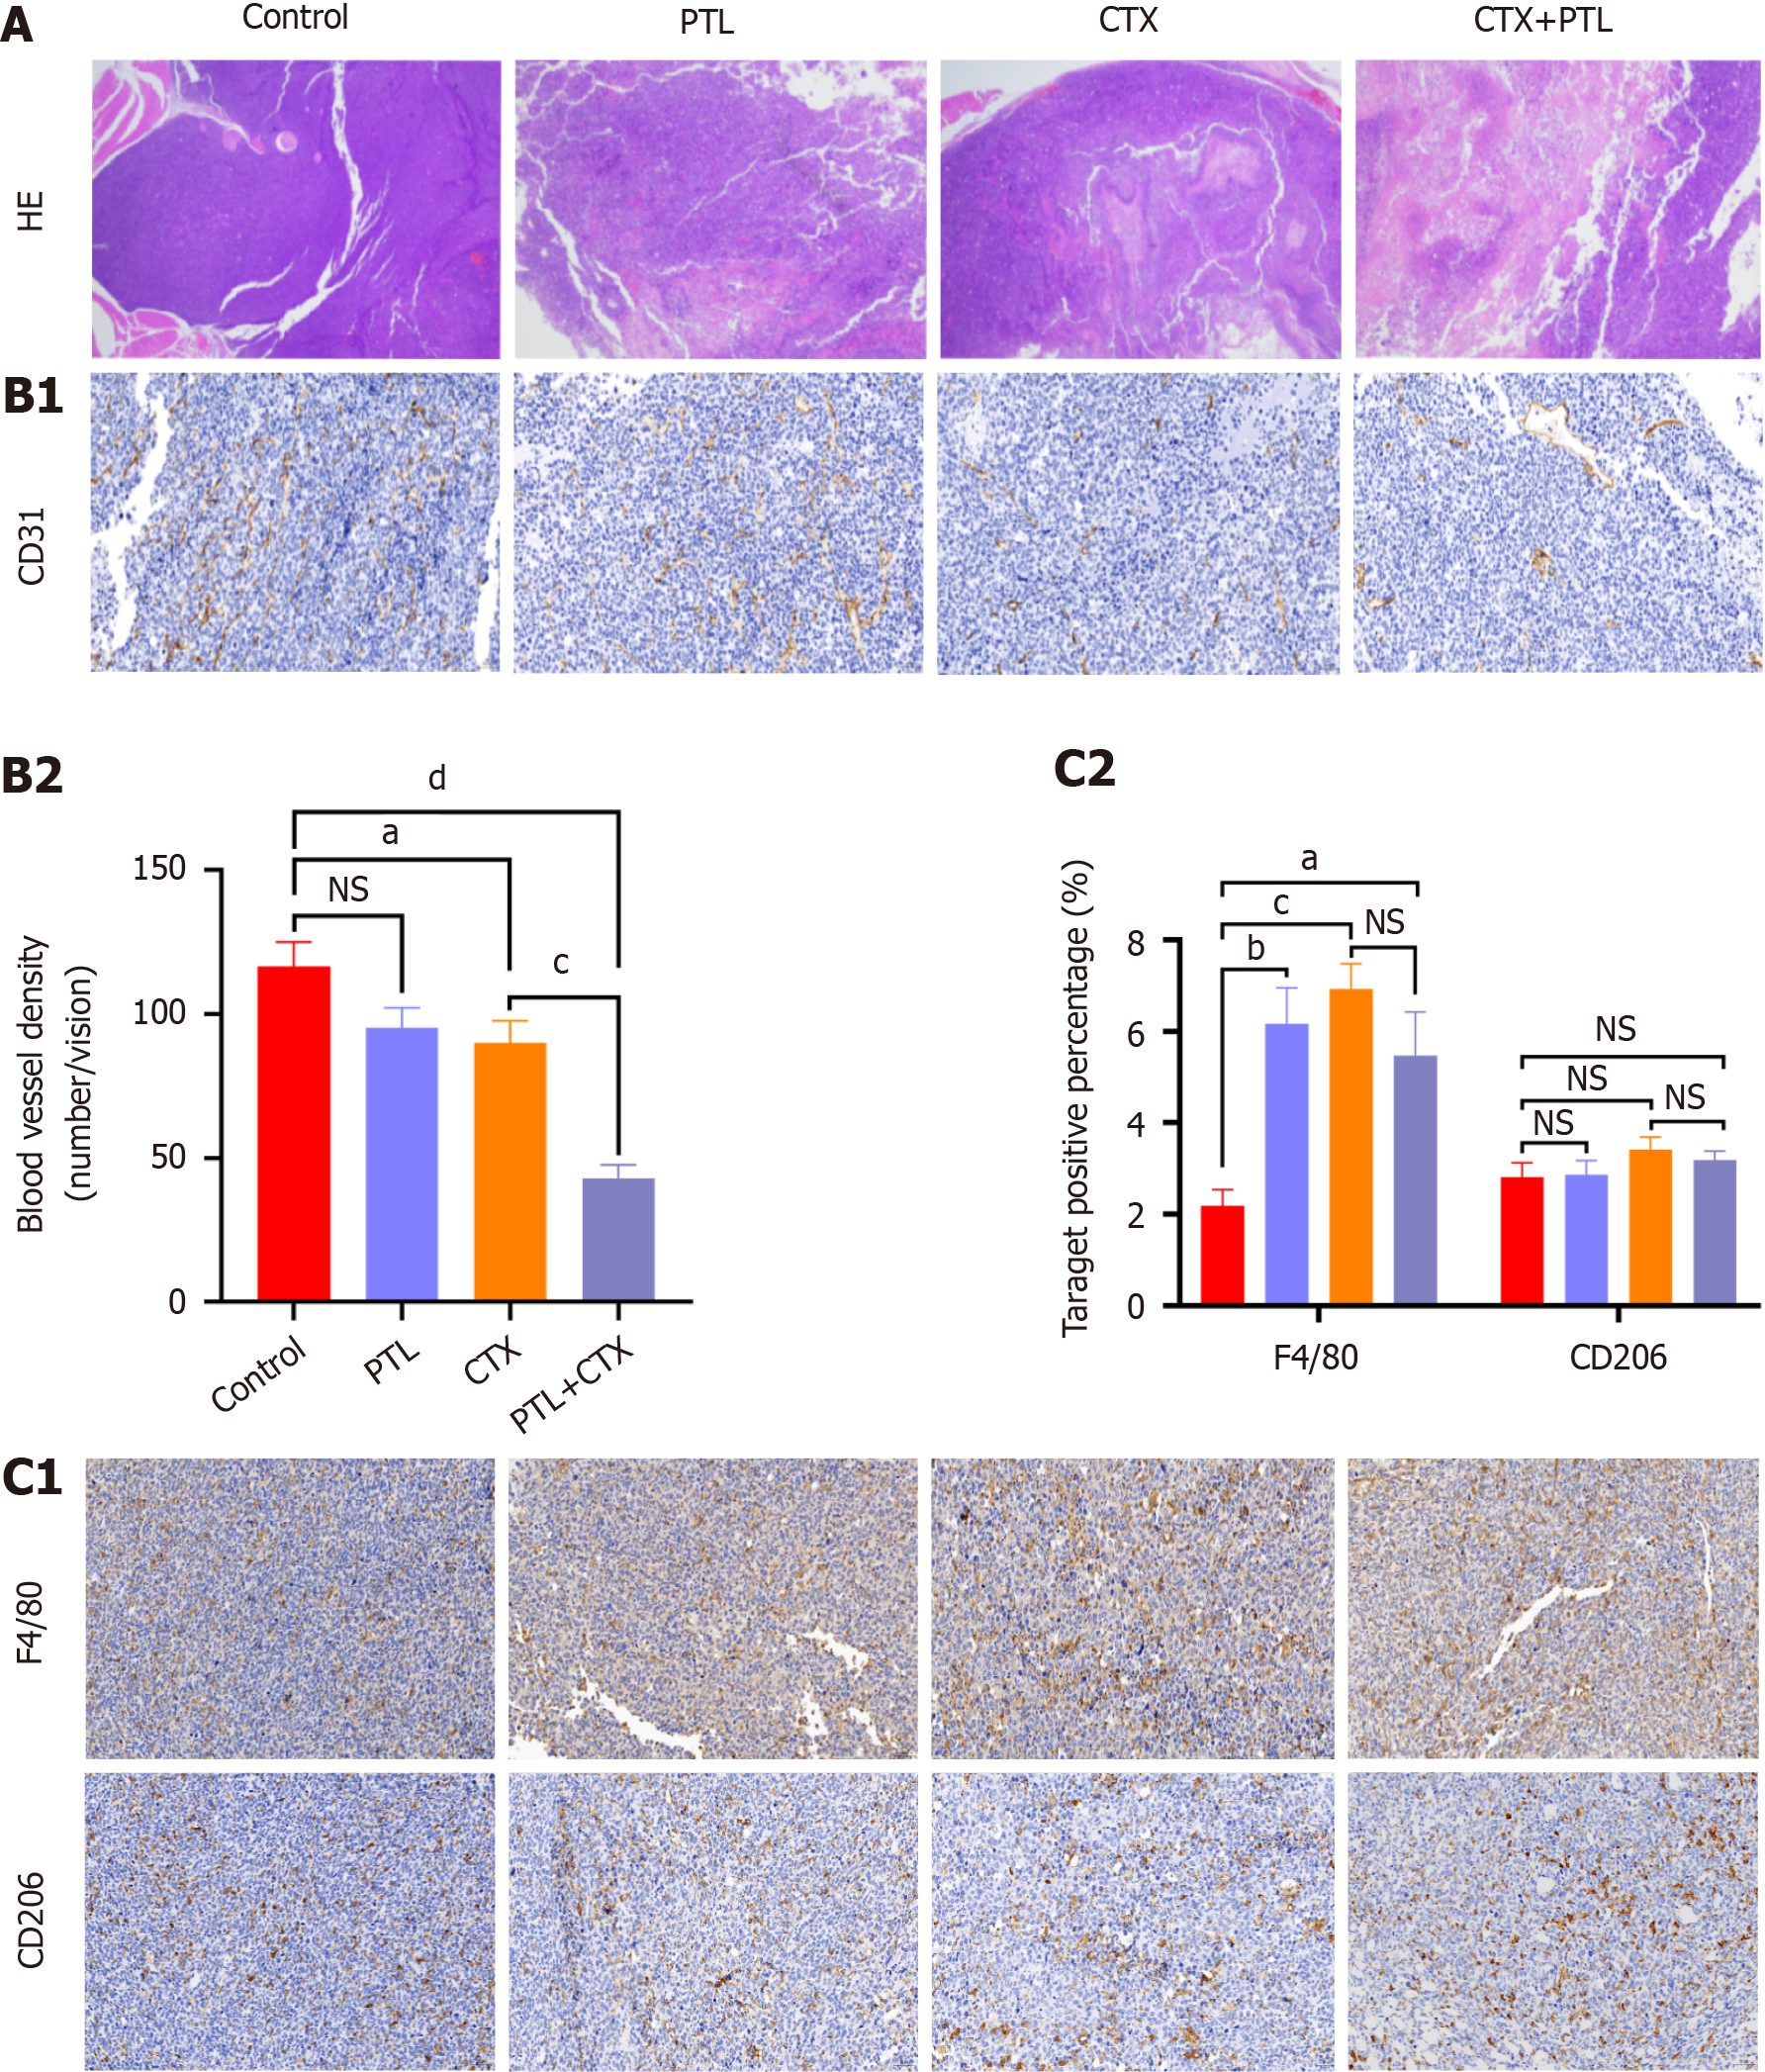
Figure 4 Effects of parthenolide combined with cyclophosphamide on tissue morphology and macrophage infiltration of transplanted tumors.
A: Hematoxylin and eosin staining; B: CD31 staining and statistical results of tumor vascular density; C: F4/80 and CD206 staining in tumor tissues as well as comparison of F4/80 and CD206 positive cell proportion. Magnification: 200 ×. n = 10; aP < 0.05; bP < 0.01; cP < 0.001; dP < 0.0001; NS: Not significant. Con: Control; PTL: Parthenolide; CTX: Cyclophosphamide; HE: Hematoxylin and eosin staining.
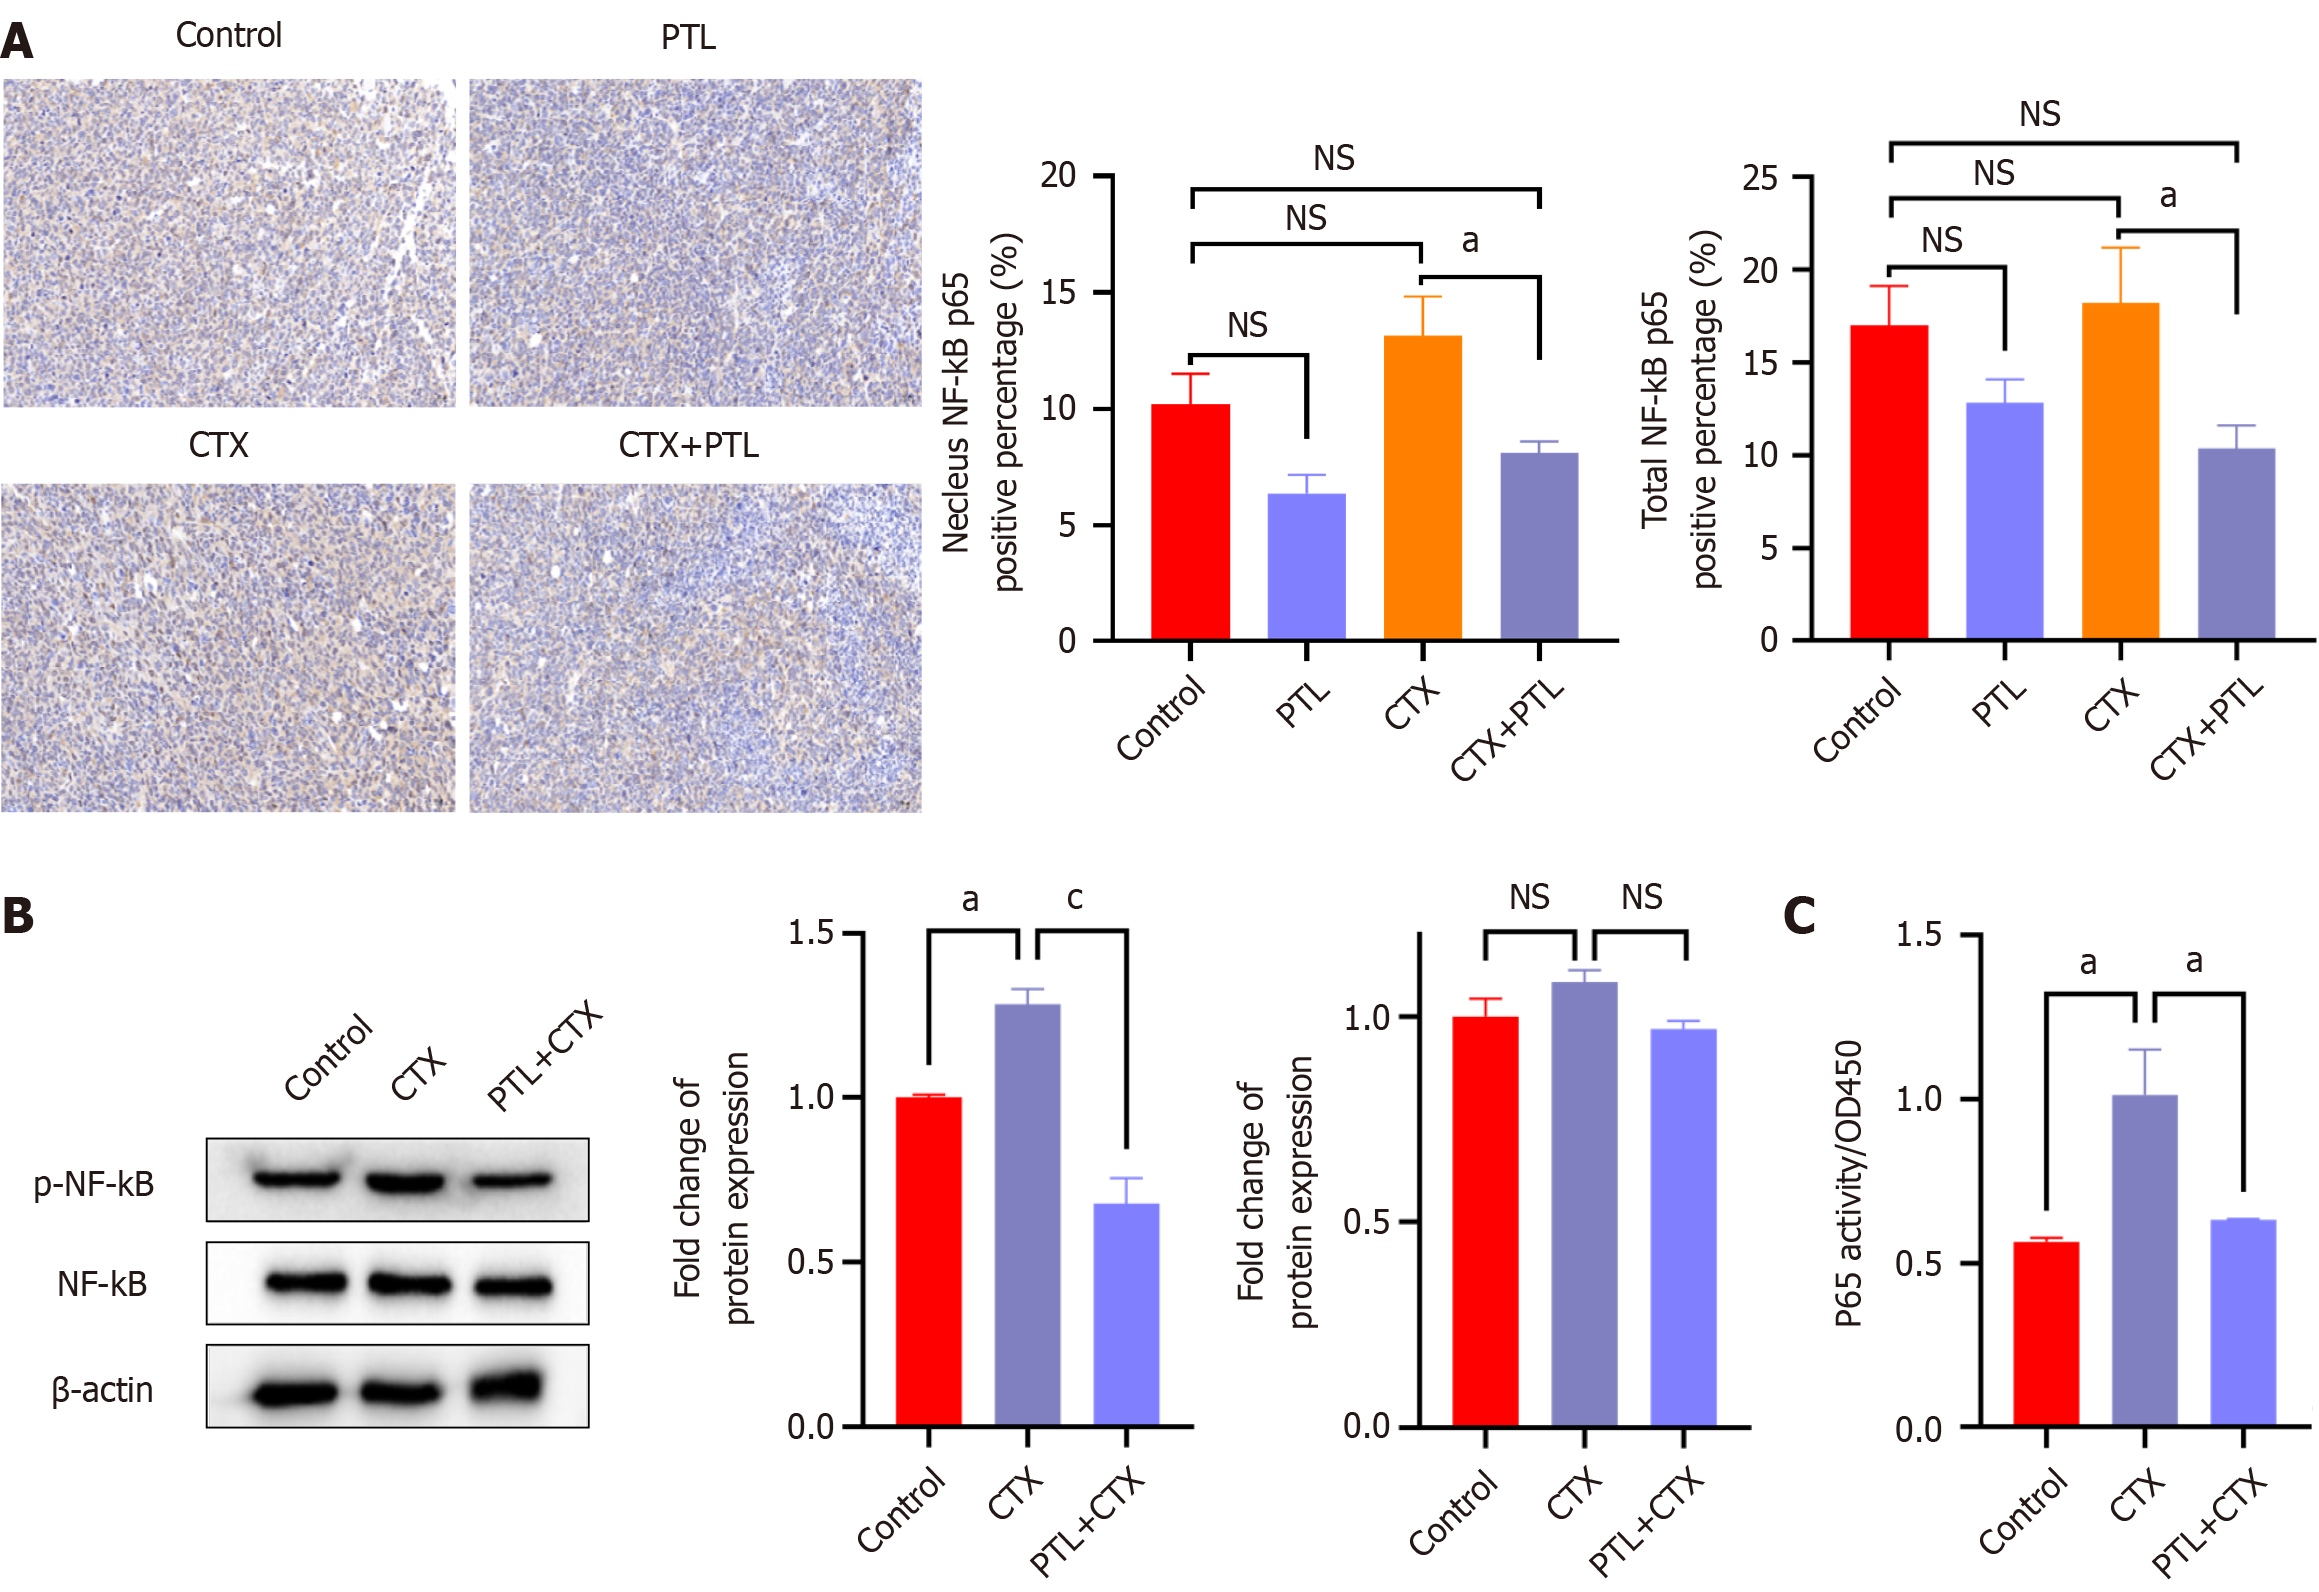
Figure 6 Parthenolide alleviated cyclophosphamide-induced NF-kB activation.
A: NF-κB immunohistochemistry staining as well as comparison of the percentage of total and nuclei NF-κB positive cells in transplanted tumors of mice in different treatment groups. Magnification: 200 ×; B: P-NF-κB and NF-κB protein immunoblotting as well as gray analysis. Full undamaged Gels and Blots images are shown in Supplementary Figure 2; C: Analysis of NF-κB P65 transcriptional activity. n = 10, aP < 0.05; cP < 0.001; NS: Not significant. PTL: Parthenolide; CTX: Cyclophosphamide.
- Citation: Cai Z, Gao L, Hu K, Wang QM. Parthenolide enhances the metronomic chemotherapy effect of cyclophosphamide in lung cancer by inhibiting the NF-kB signaling pathway. World J Clin Oncol 2024; 15(7): 895-907
- URL: https://www.wjgnet.com/2218-4333/full/v15/i7/895.htm
- DOI: https://dx.doi.org/10.5306/wjco.v15.i7.895


