©The Author(s) 2024.
World J Clin Oncol. Apr 24, 2024; 15(4): 554-565
Published online Apr 24, 2024. doi: 10.5306/wjco.v15.i4.554
Published online Apr 24, 2024. doi: 10.5306/wjco.v15.i4.554
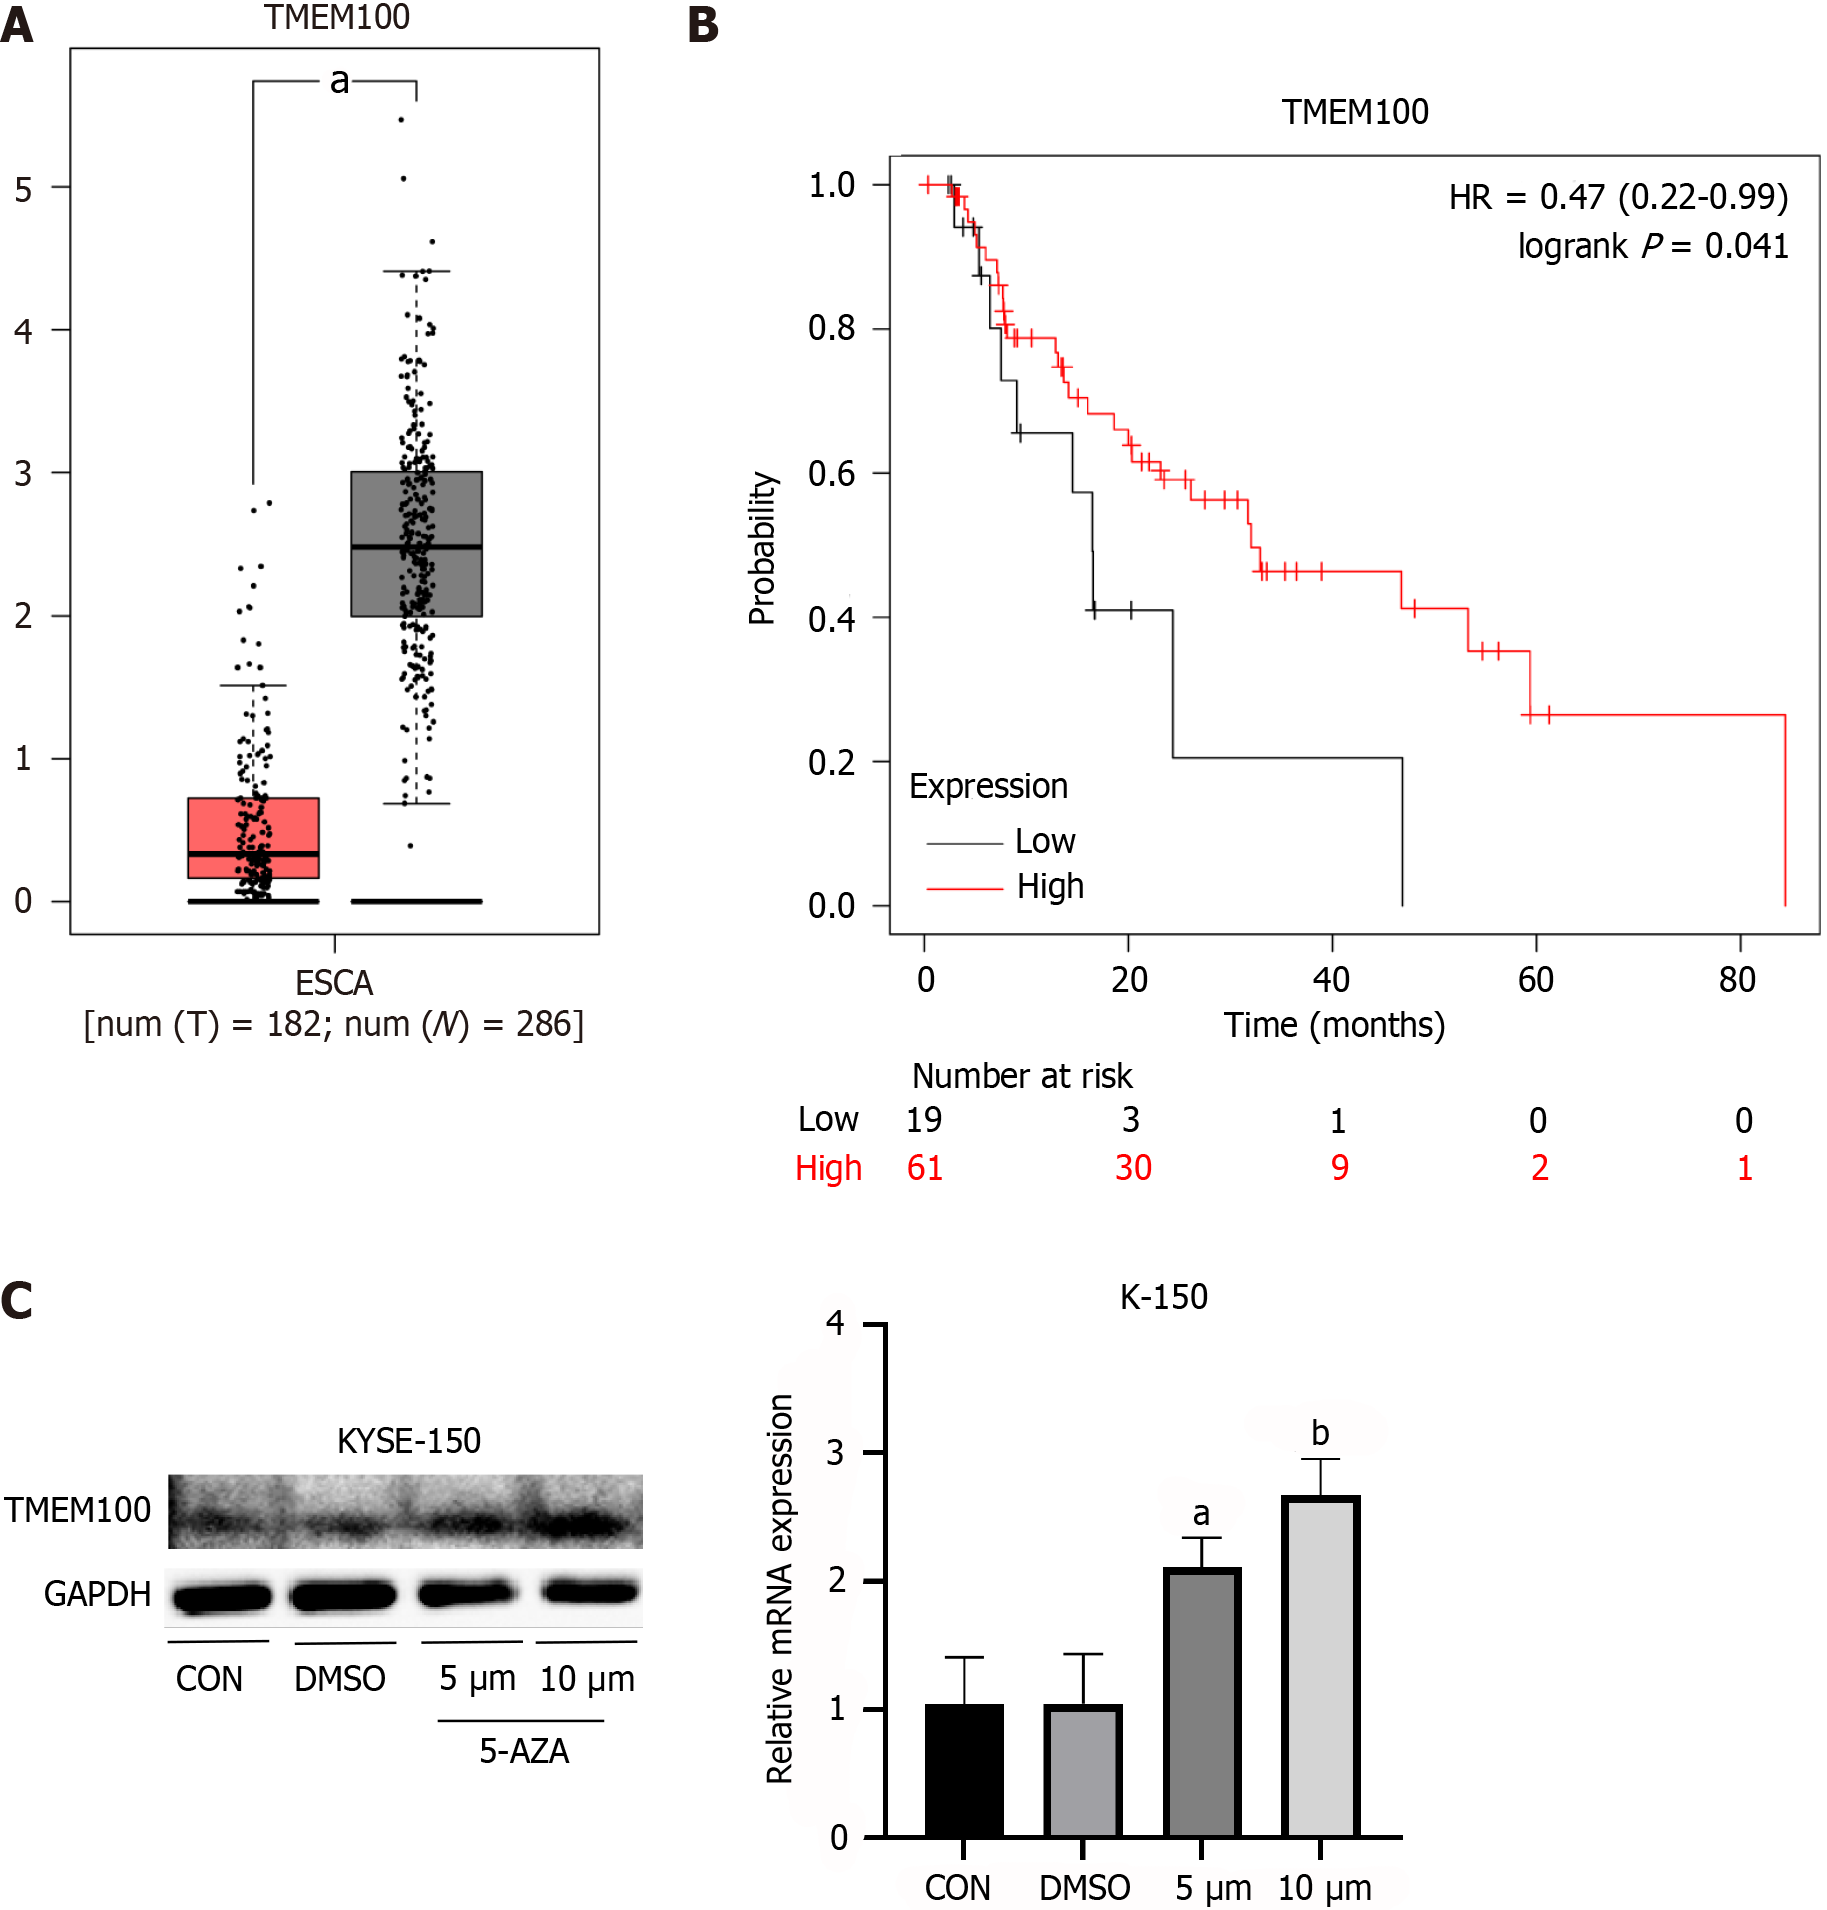
Figure 1 Relationship between low TMEM100 expression in esophageal cancer and patient survival and the effect of 5-AZA on TMEM100 expression in esophageal squamous cell carcinoma lines.
A: Expression profile of TMEM100 in EC samples compared with normal samples, showing reduced expression of TMEM100 in EC tissues; B: Overall survival of patients with high vs low TMEM100 expression levels. Survival was poorer for those with low TMEM100 expression (P = 0.041); C: 5-AZA induced a dose-dependent expression of TMEM100 in K-150 cells. Real-time PCR and western blotting results showed that after 24 h of treatment, TMEM100 expression increased with increasing 5-AZA concentration. aP < 0.05, bP < 0.01. DMSO: Dimethyl sulfoxide; EC: Esophageal cancer; ESCA: Esophageal cancer; HR: Hazard Ratio.
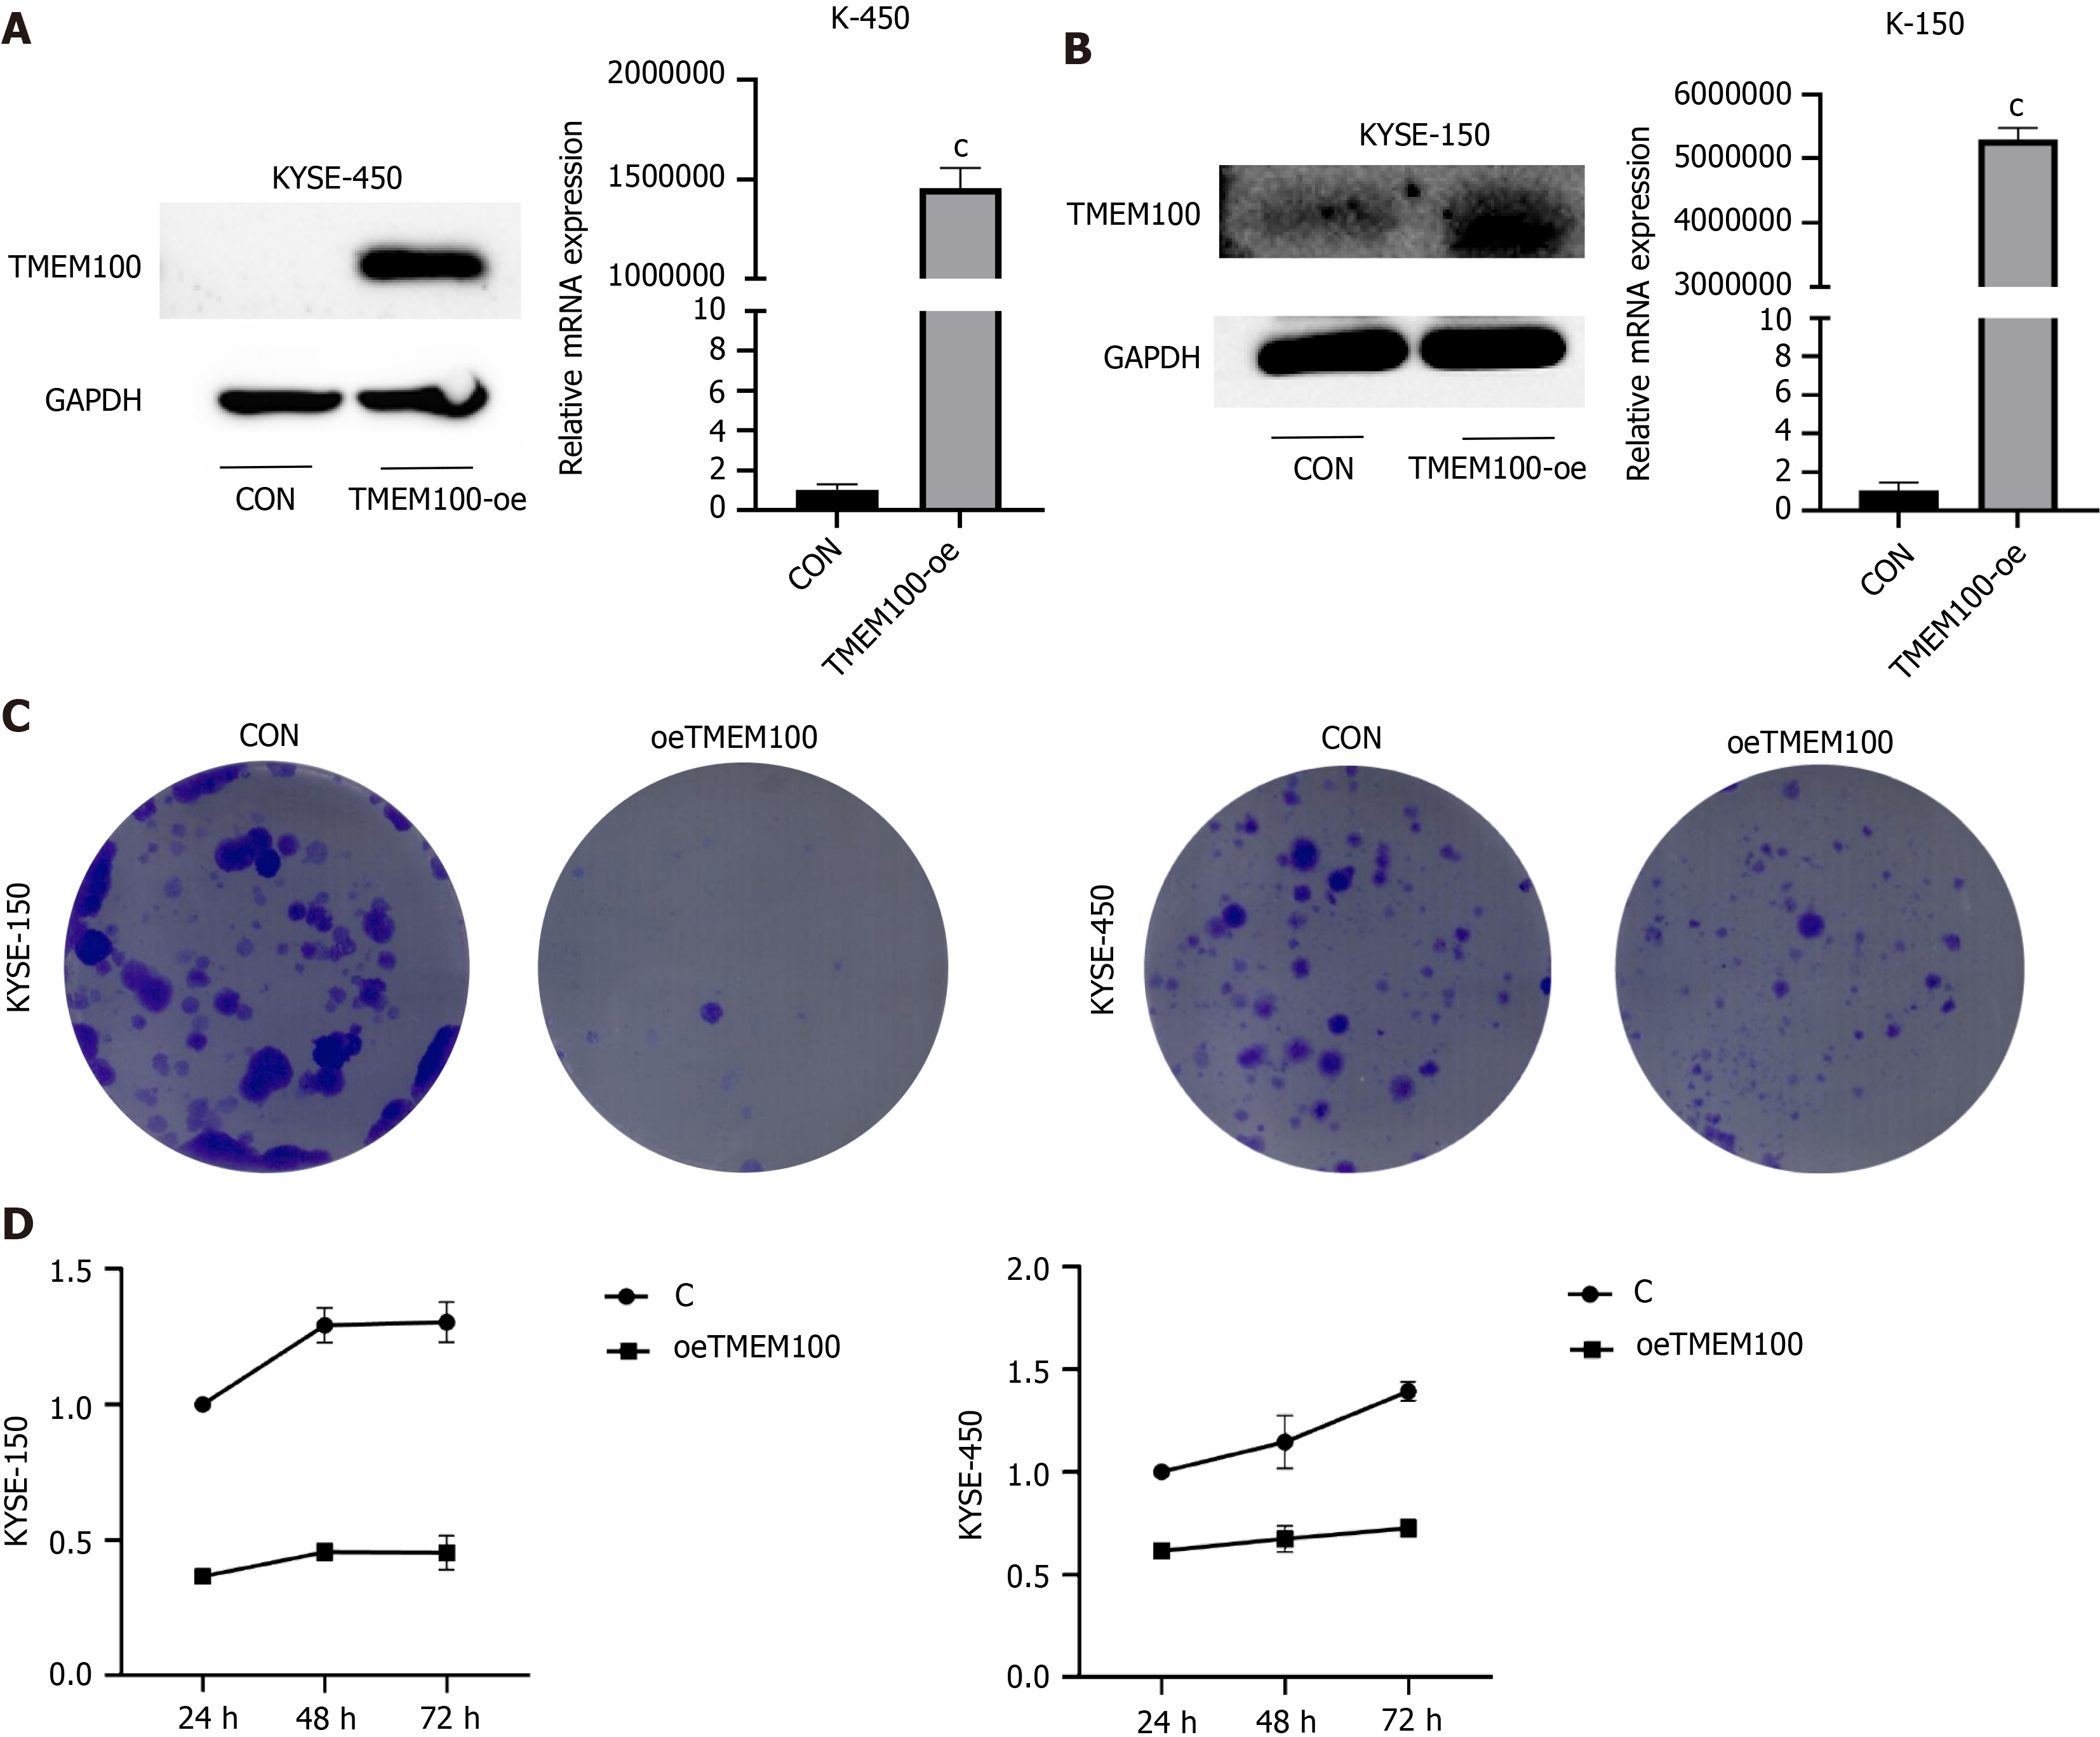
Figure 2 Overexpression effect of TMEM100 in esophageal squamous cell carcinoma lines and the inhibitory effect of TMEM100 over
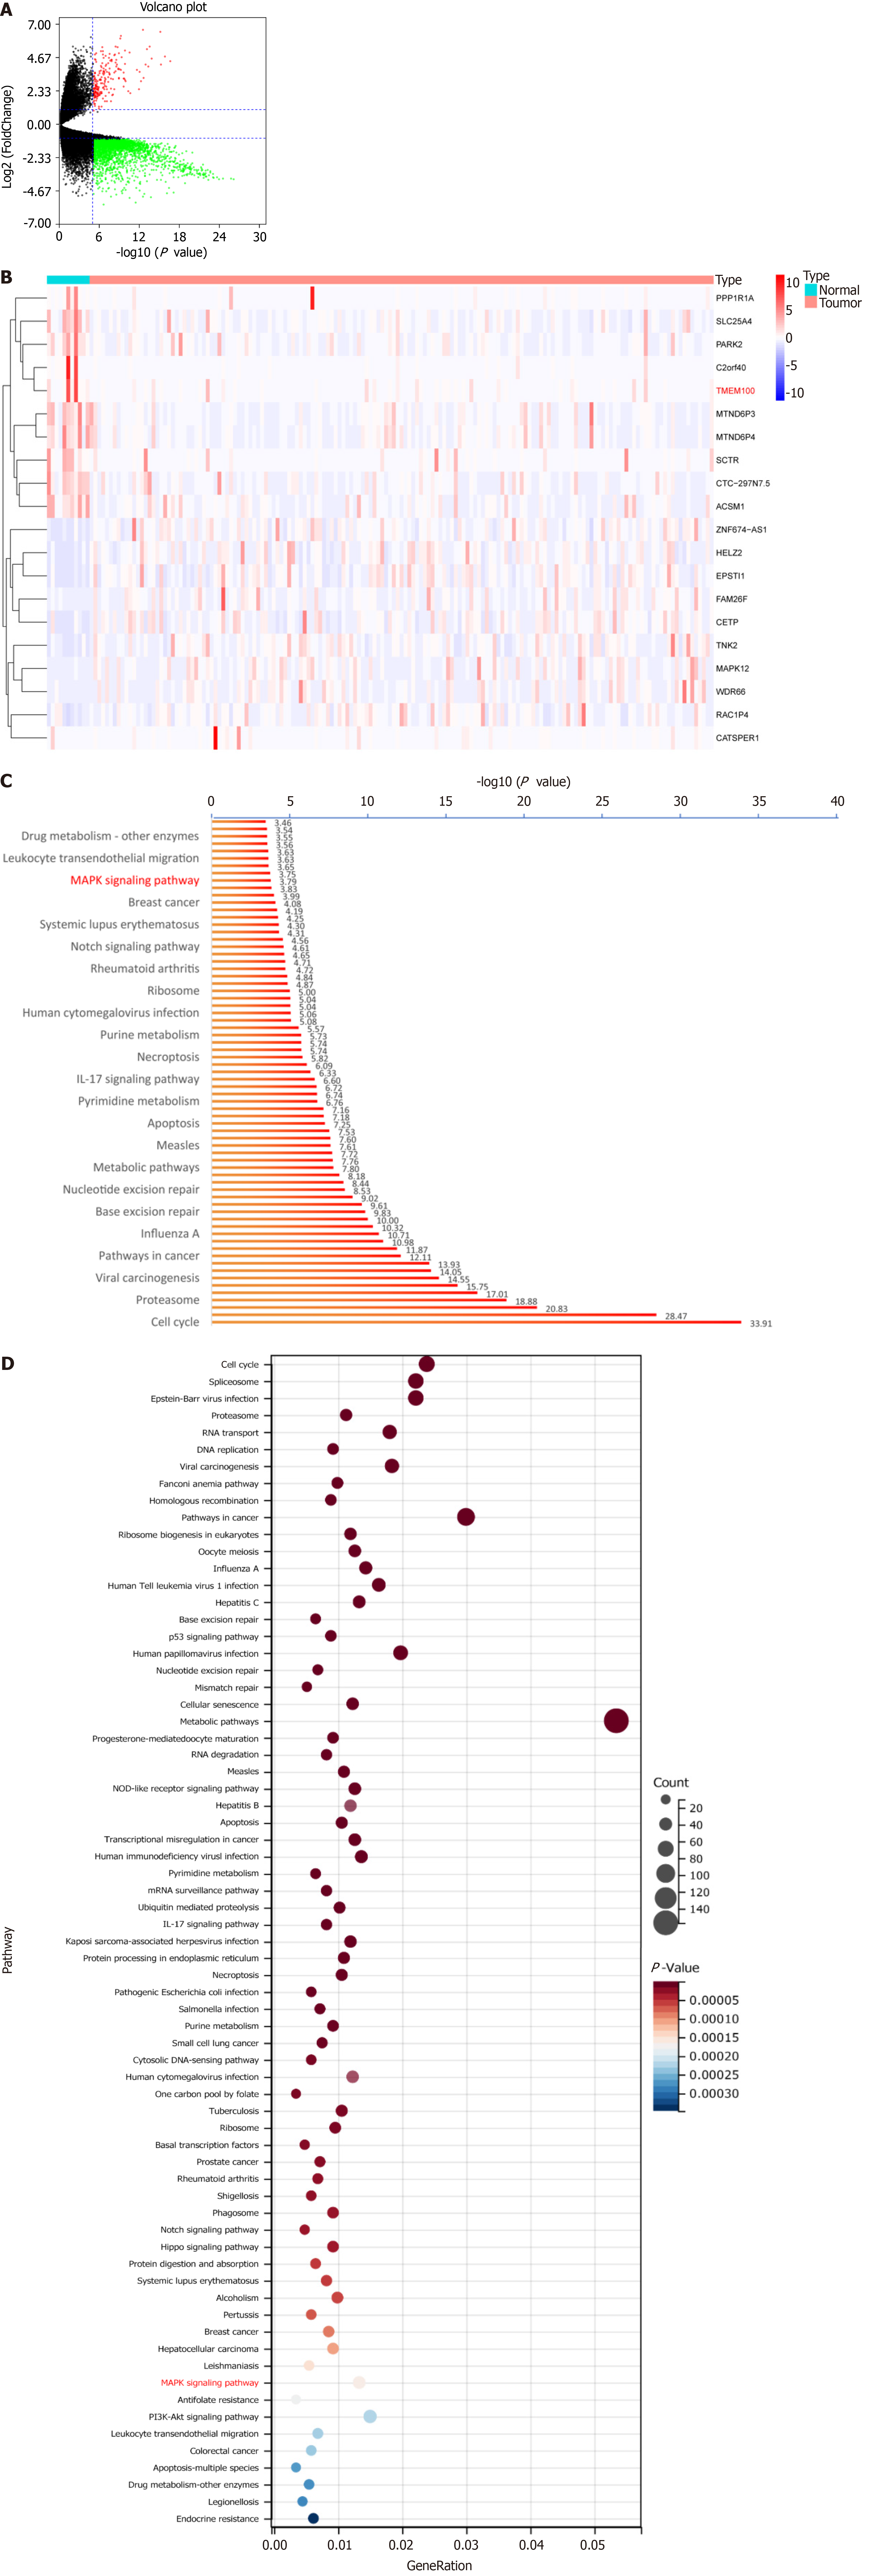
Figure 3 Identification of differentially expressed genes and functional enrichment analysis.
A: In the volcano plot, upregulated genes are indicated by red dots, and downregulated genes are indicated by green dots; B: The heatmap represents the expression levels of the genes, with the blue to red spectrum indicating low to high expression; C and D: The top 69 enriched Kyoto Encyclopedia of Genes and Genomes pathways.
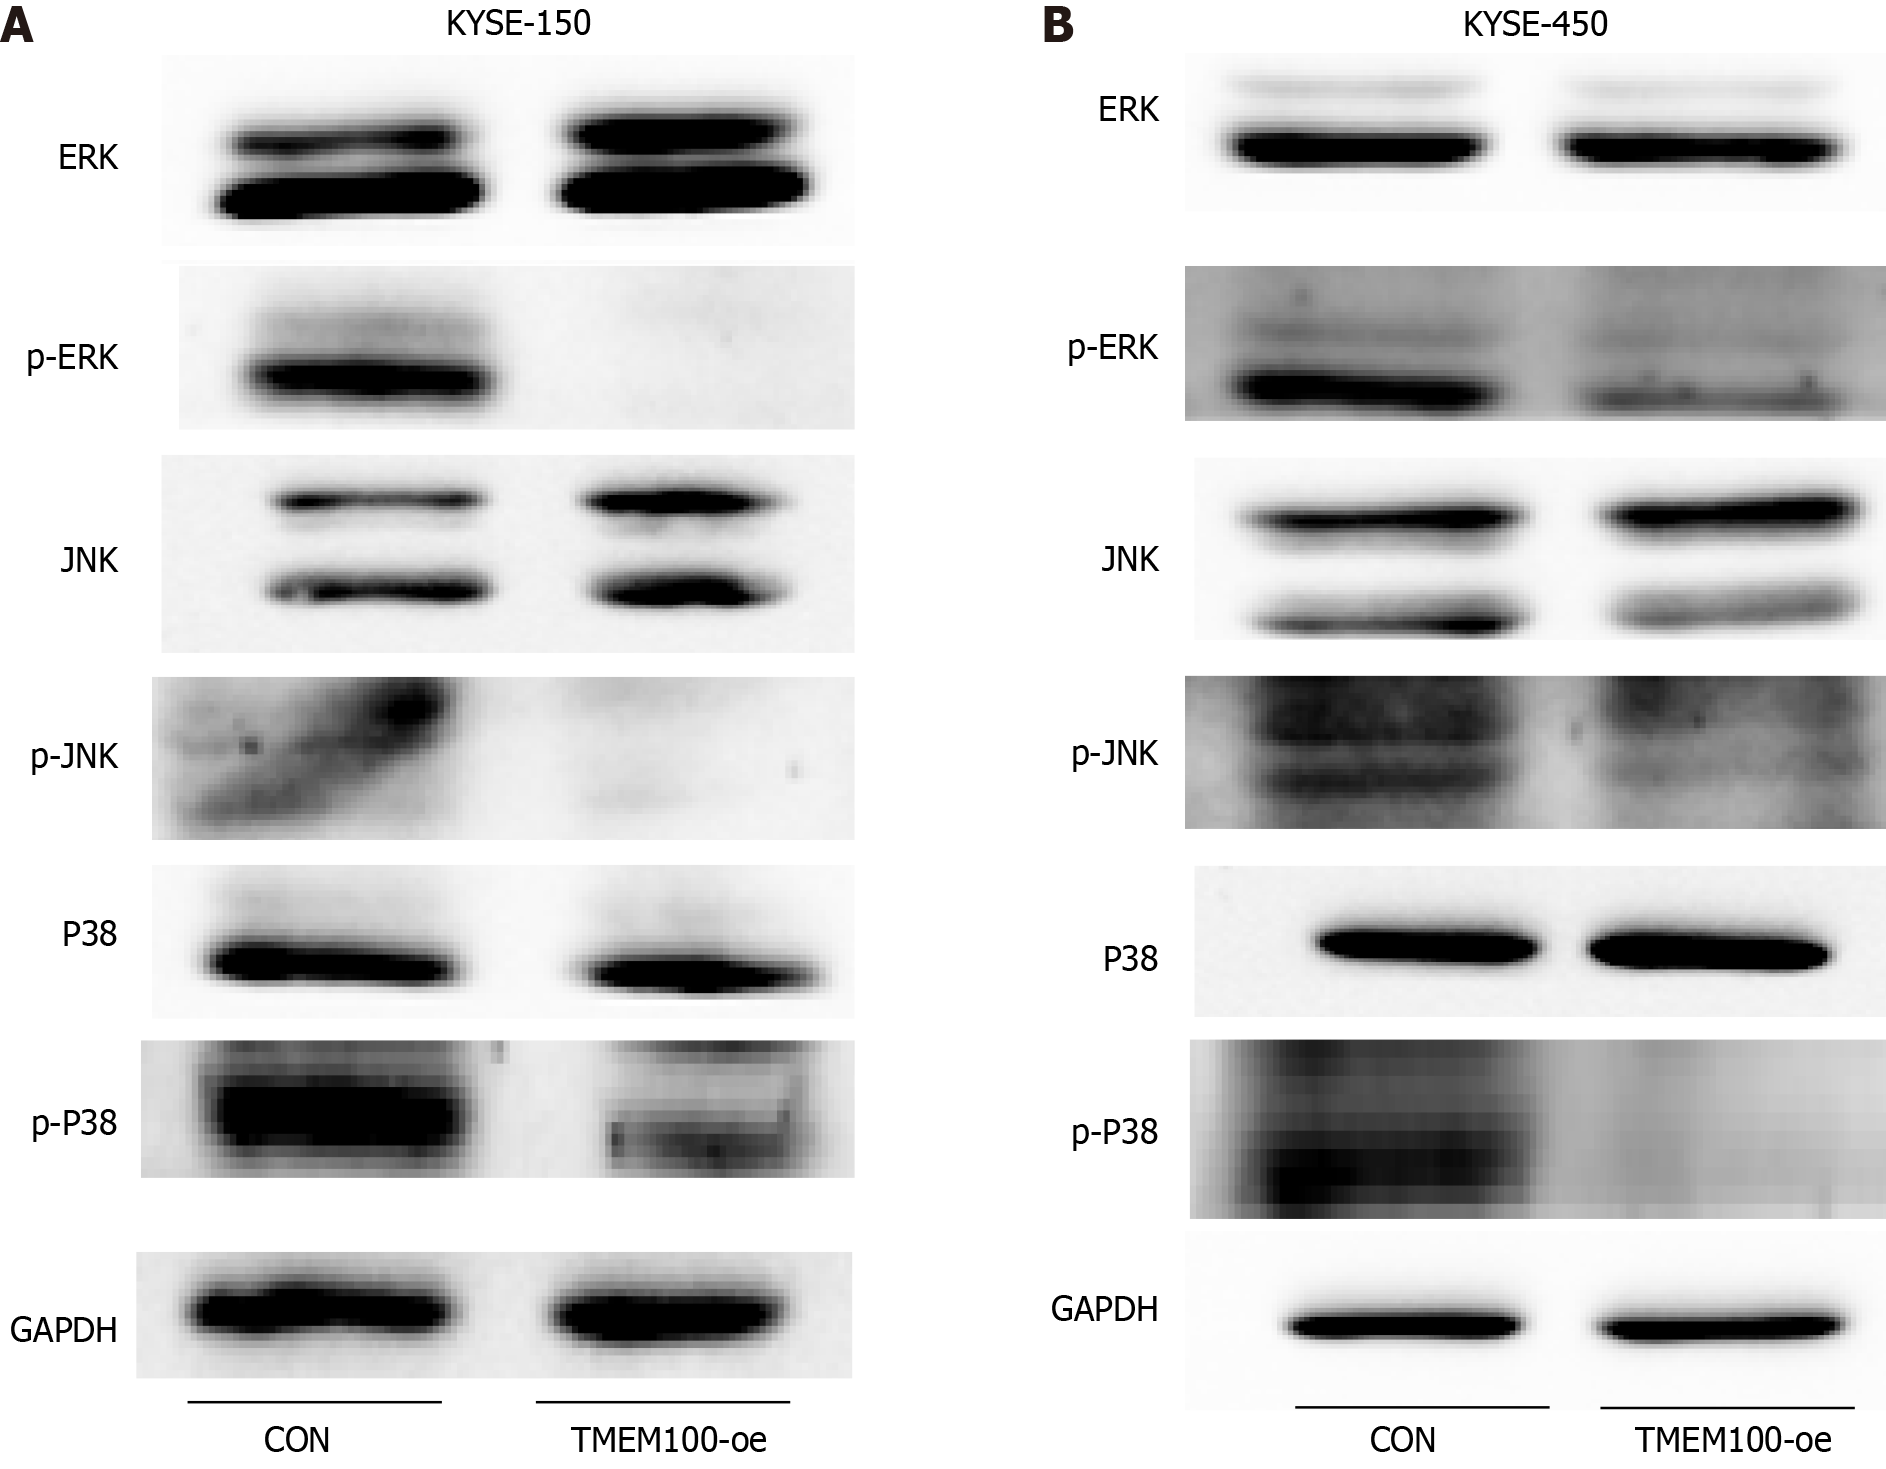
Figure 4 Effect of TMEM100 overexpression on mitogen-activated protein kinase pathway activation in KYSE-150/KYSE-450 cells.
A: K-150 cells were harvested 24 h after transfection with TMEM100-oe, and total proteins were extracted for western blotting analysis. Phosphorylated-extracellular regulated kinase (p-ERK) and ERK, phosphorylated-c-Jun N-terminal kinase (p-JNK) and JNK, and p-p38 and p38 were analysed. The result demonstrated a reduction in the expression of p-ERK, p-p38, and p-JNK in K-150/K-450 cells transfected with TMEM100-oe; B: The experiment was repeated again with K-450 cells. p-ERK: Phosphorylated-extracellular regulated kinase; p-JNK: Phosphorylated-c-Jun N-terminal kinase.
- Citation: Xu YF, Dang Y, Kong WB, Wang HL, Chen X, Yao L, Zhao Y, Zhang RQ. Regulation of TMEM100 expression by epigenetic modification, effects on proliferation and invasion of esophageal squamous carcinoma. World J Clin Oncol 2024; 15(4): 554-565
- URL: https://www.wjgnet.com/2218-4333/full/v15/i4/554.htm
- DOI: https://dx.doi.org/10.5306/wjco.v15.i4.554


