©The Author(s) 2020.
World J Clin Oncol. Sep 24, 2020; 11(9): 732-746
Published online Sep 24, 2020. doi: 10.5306/wjco.v11.i9.732
Published online Sep 24, 2020. doi: 10.5306/wjco.v11.i9.732
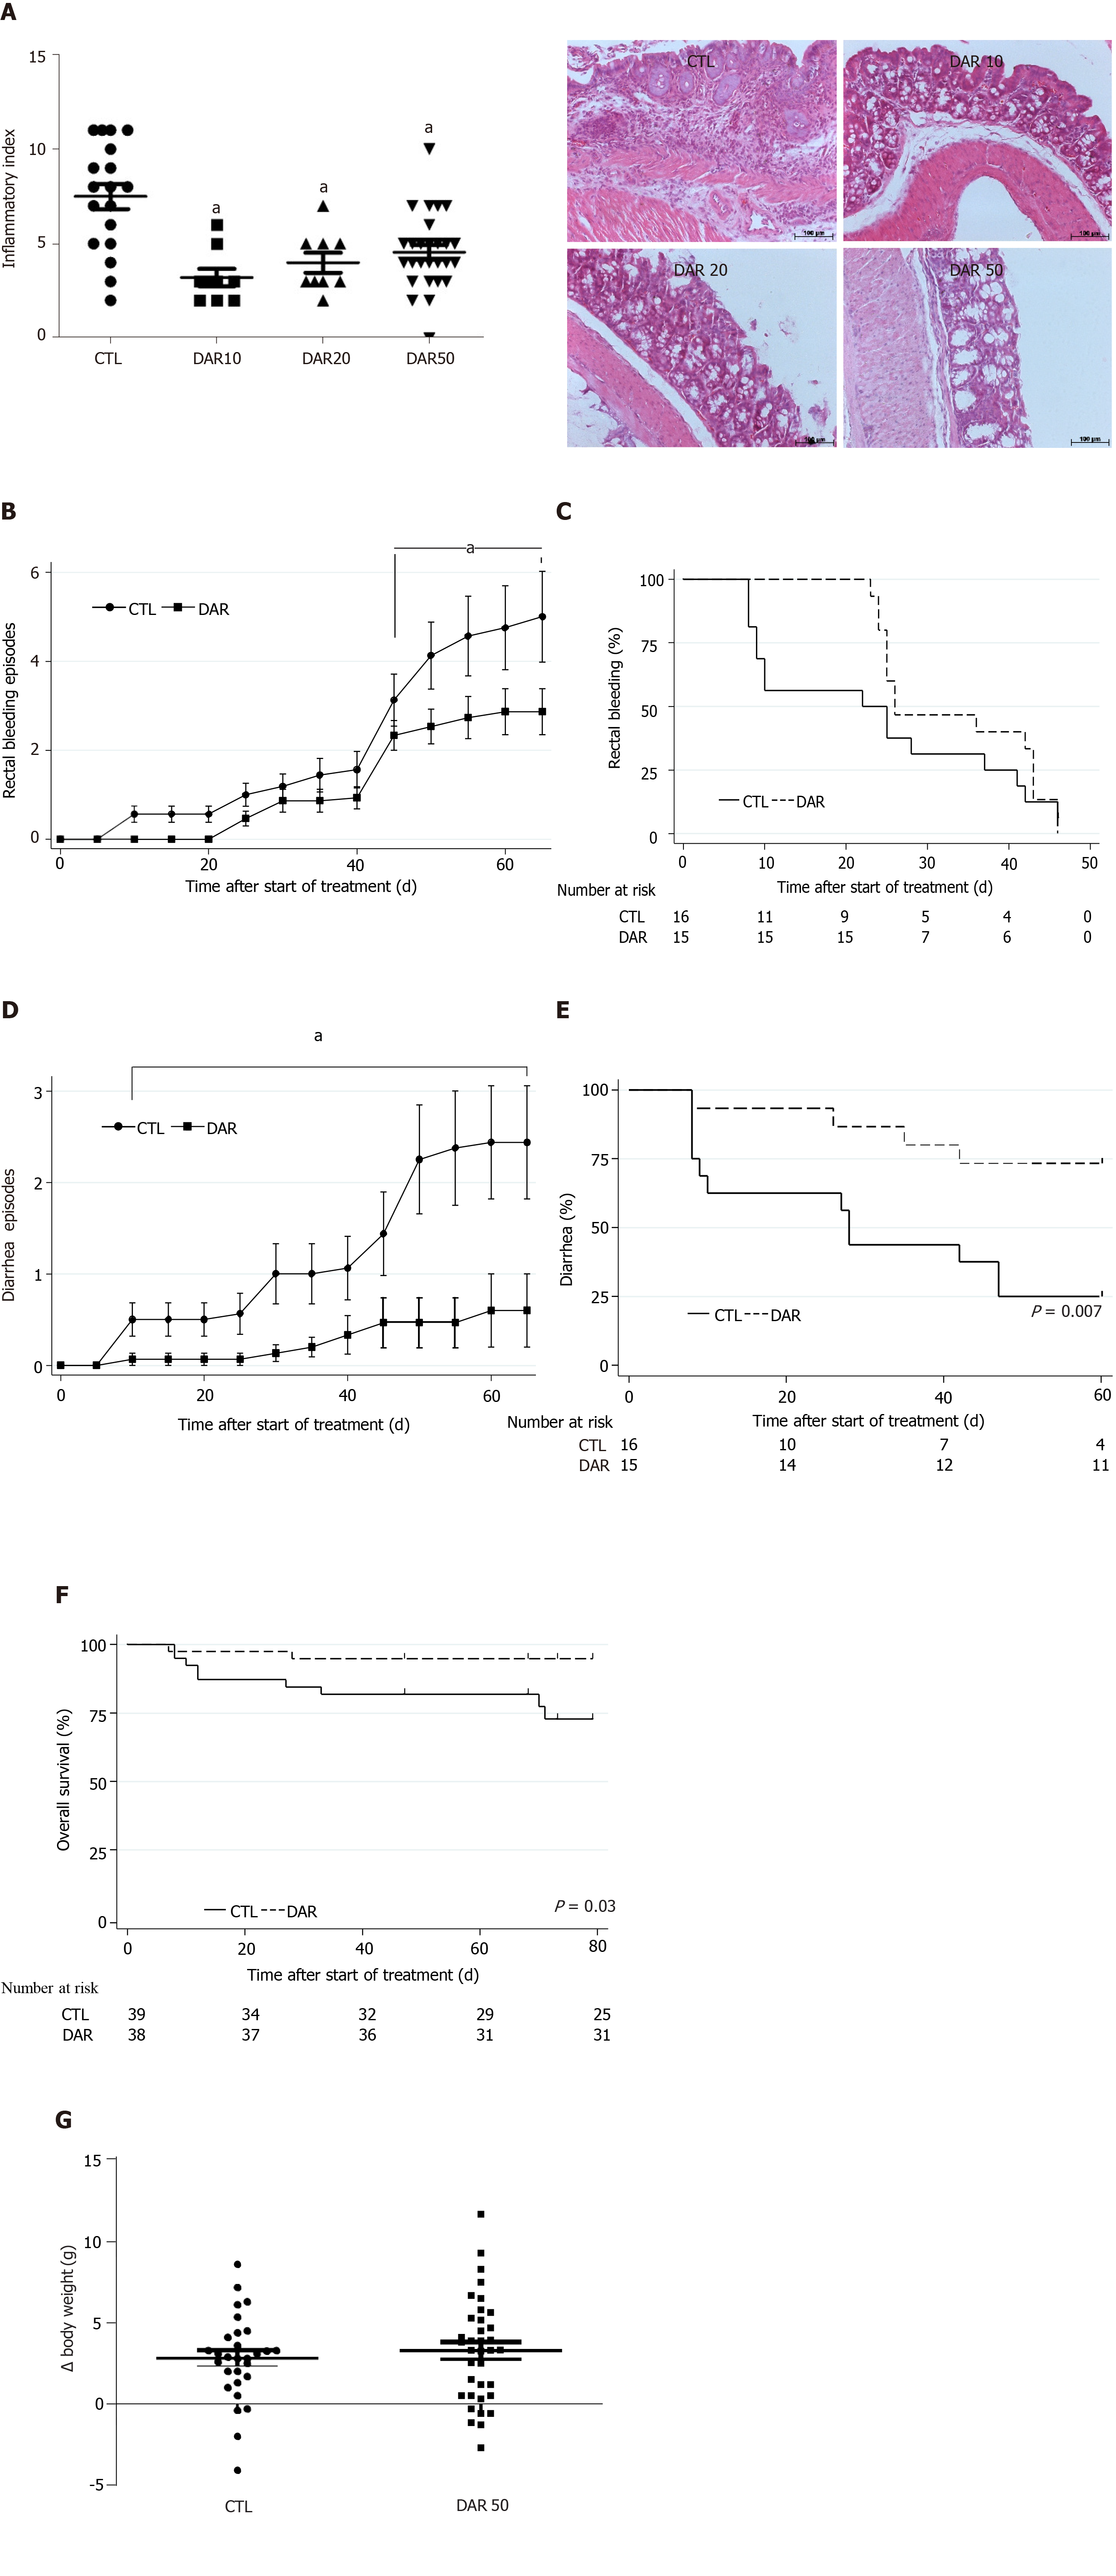
Figure 1 Diacerein treatment suppresses chemically induced colitis.
Swiss mice that underwent colitis induction by a single dose of azoxymethane and dextran sulphate sodium were randomly divided into four groups, control (CTL) and diacerein (DAR) 10 (treated with 10 mg/kg/d), DAR20 (treated with 20 mg/kg/d) and DAR50 (treated with 50 mg/kg/d). A: Inflammatory index and microphotographic representation of colon sections (magnification 20 ×) stained with hematoxylin and eosin in CTL and DAR groups, scale bar: 100 µm; B: Number of bleeding rectal episodes over time; C: Time to first rectal bleeding episode; D: Number of episodes of diarrhea over time in Swiss mice; E: Time to the first episode of diarrhea; F: Overall survival of Swiss animals in CTL and DAR50-treated groups; G: Body weight. Data are presented as mean ± standard error. aP < 0.05.
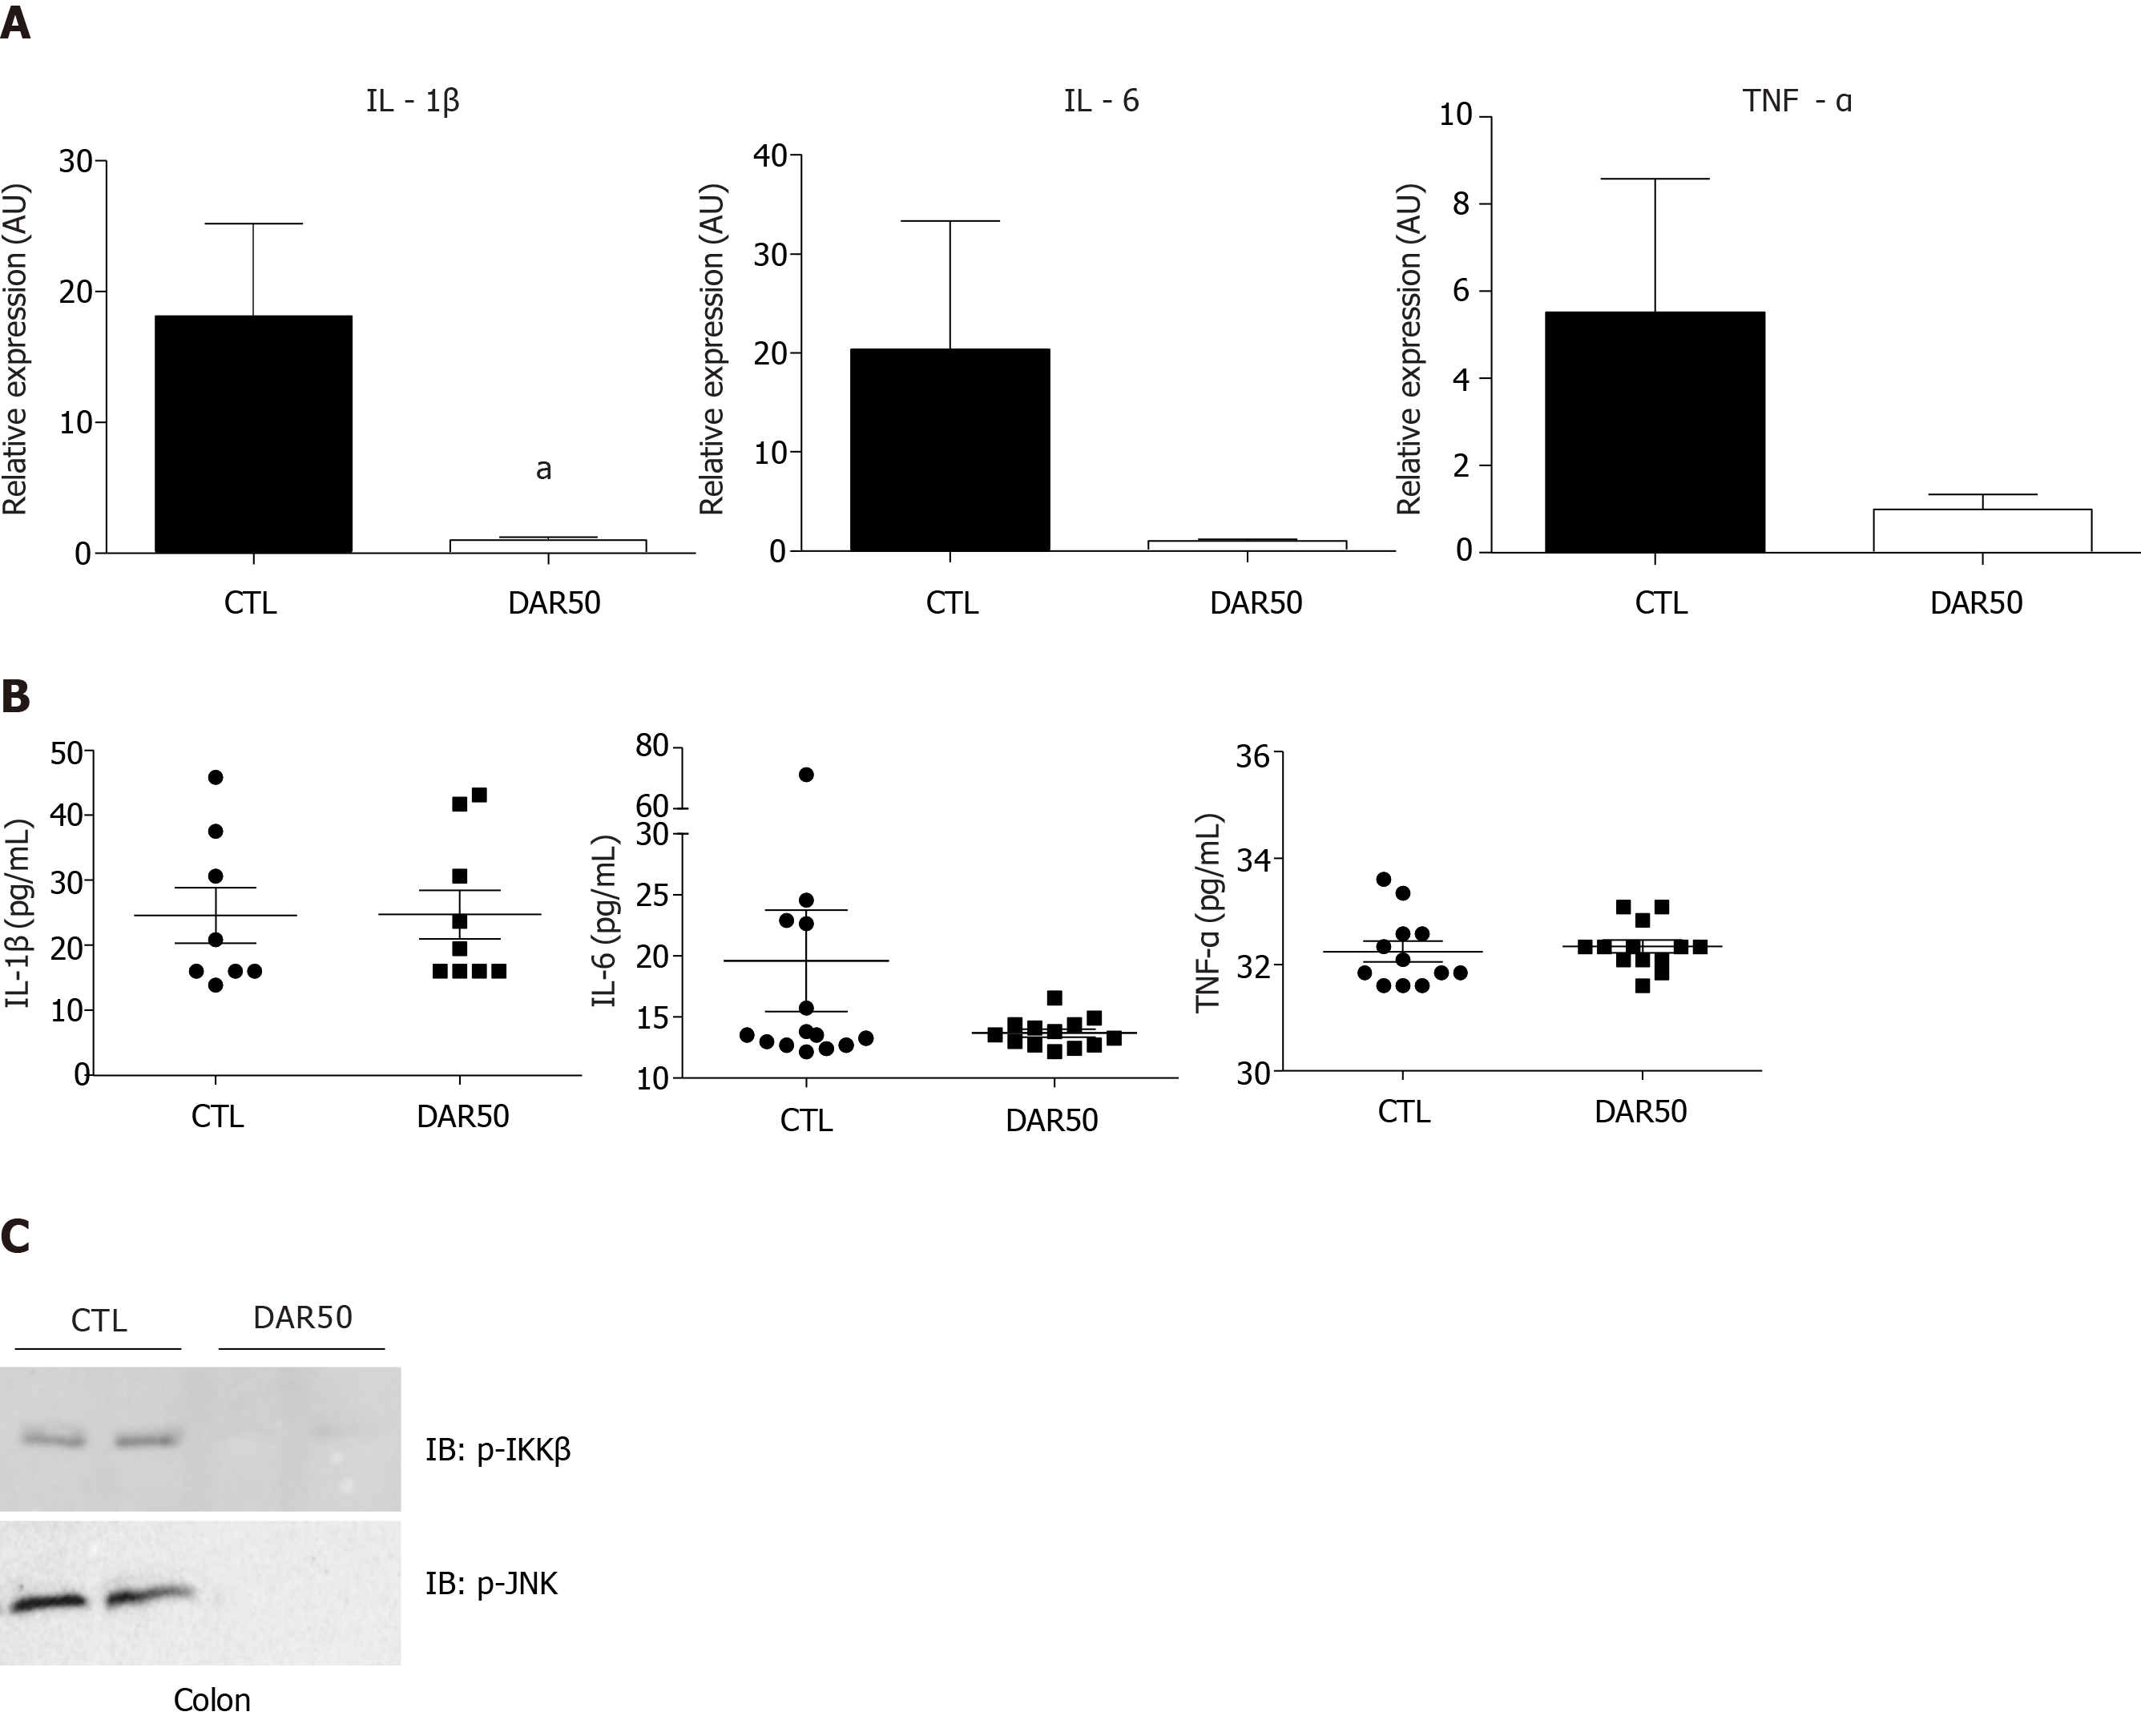
Figure 2 Diacerein treatment attenuates the expression of pro-inflammatory cytokines.
A: Quantitative reverse transcription polymerase chain reaction analysis of interleukin (IL)-1β, IL-6 and tumor necrosis factor (TNF)-α genes in peritumoral colonic tissue of Swiss mice treated with vehicle or diacerein50 (n = 17–18 mice/group); B: Quantification of serum IL-1β, IL-6 and TNF-α (n = 6–10 mice/group); C: Analysis of pro-inflammatory protein expression (p-IKK, p-JNK) by immunoblot in the peritumoral colonic tissue (Supplementary Figure 1). Data are presented as mean ± standard error. aP < 0.05.
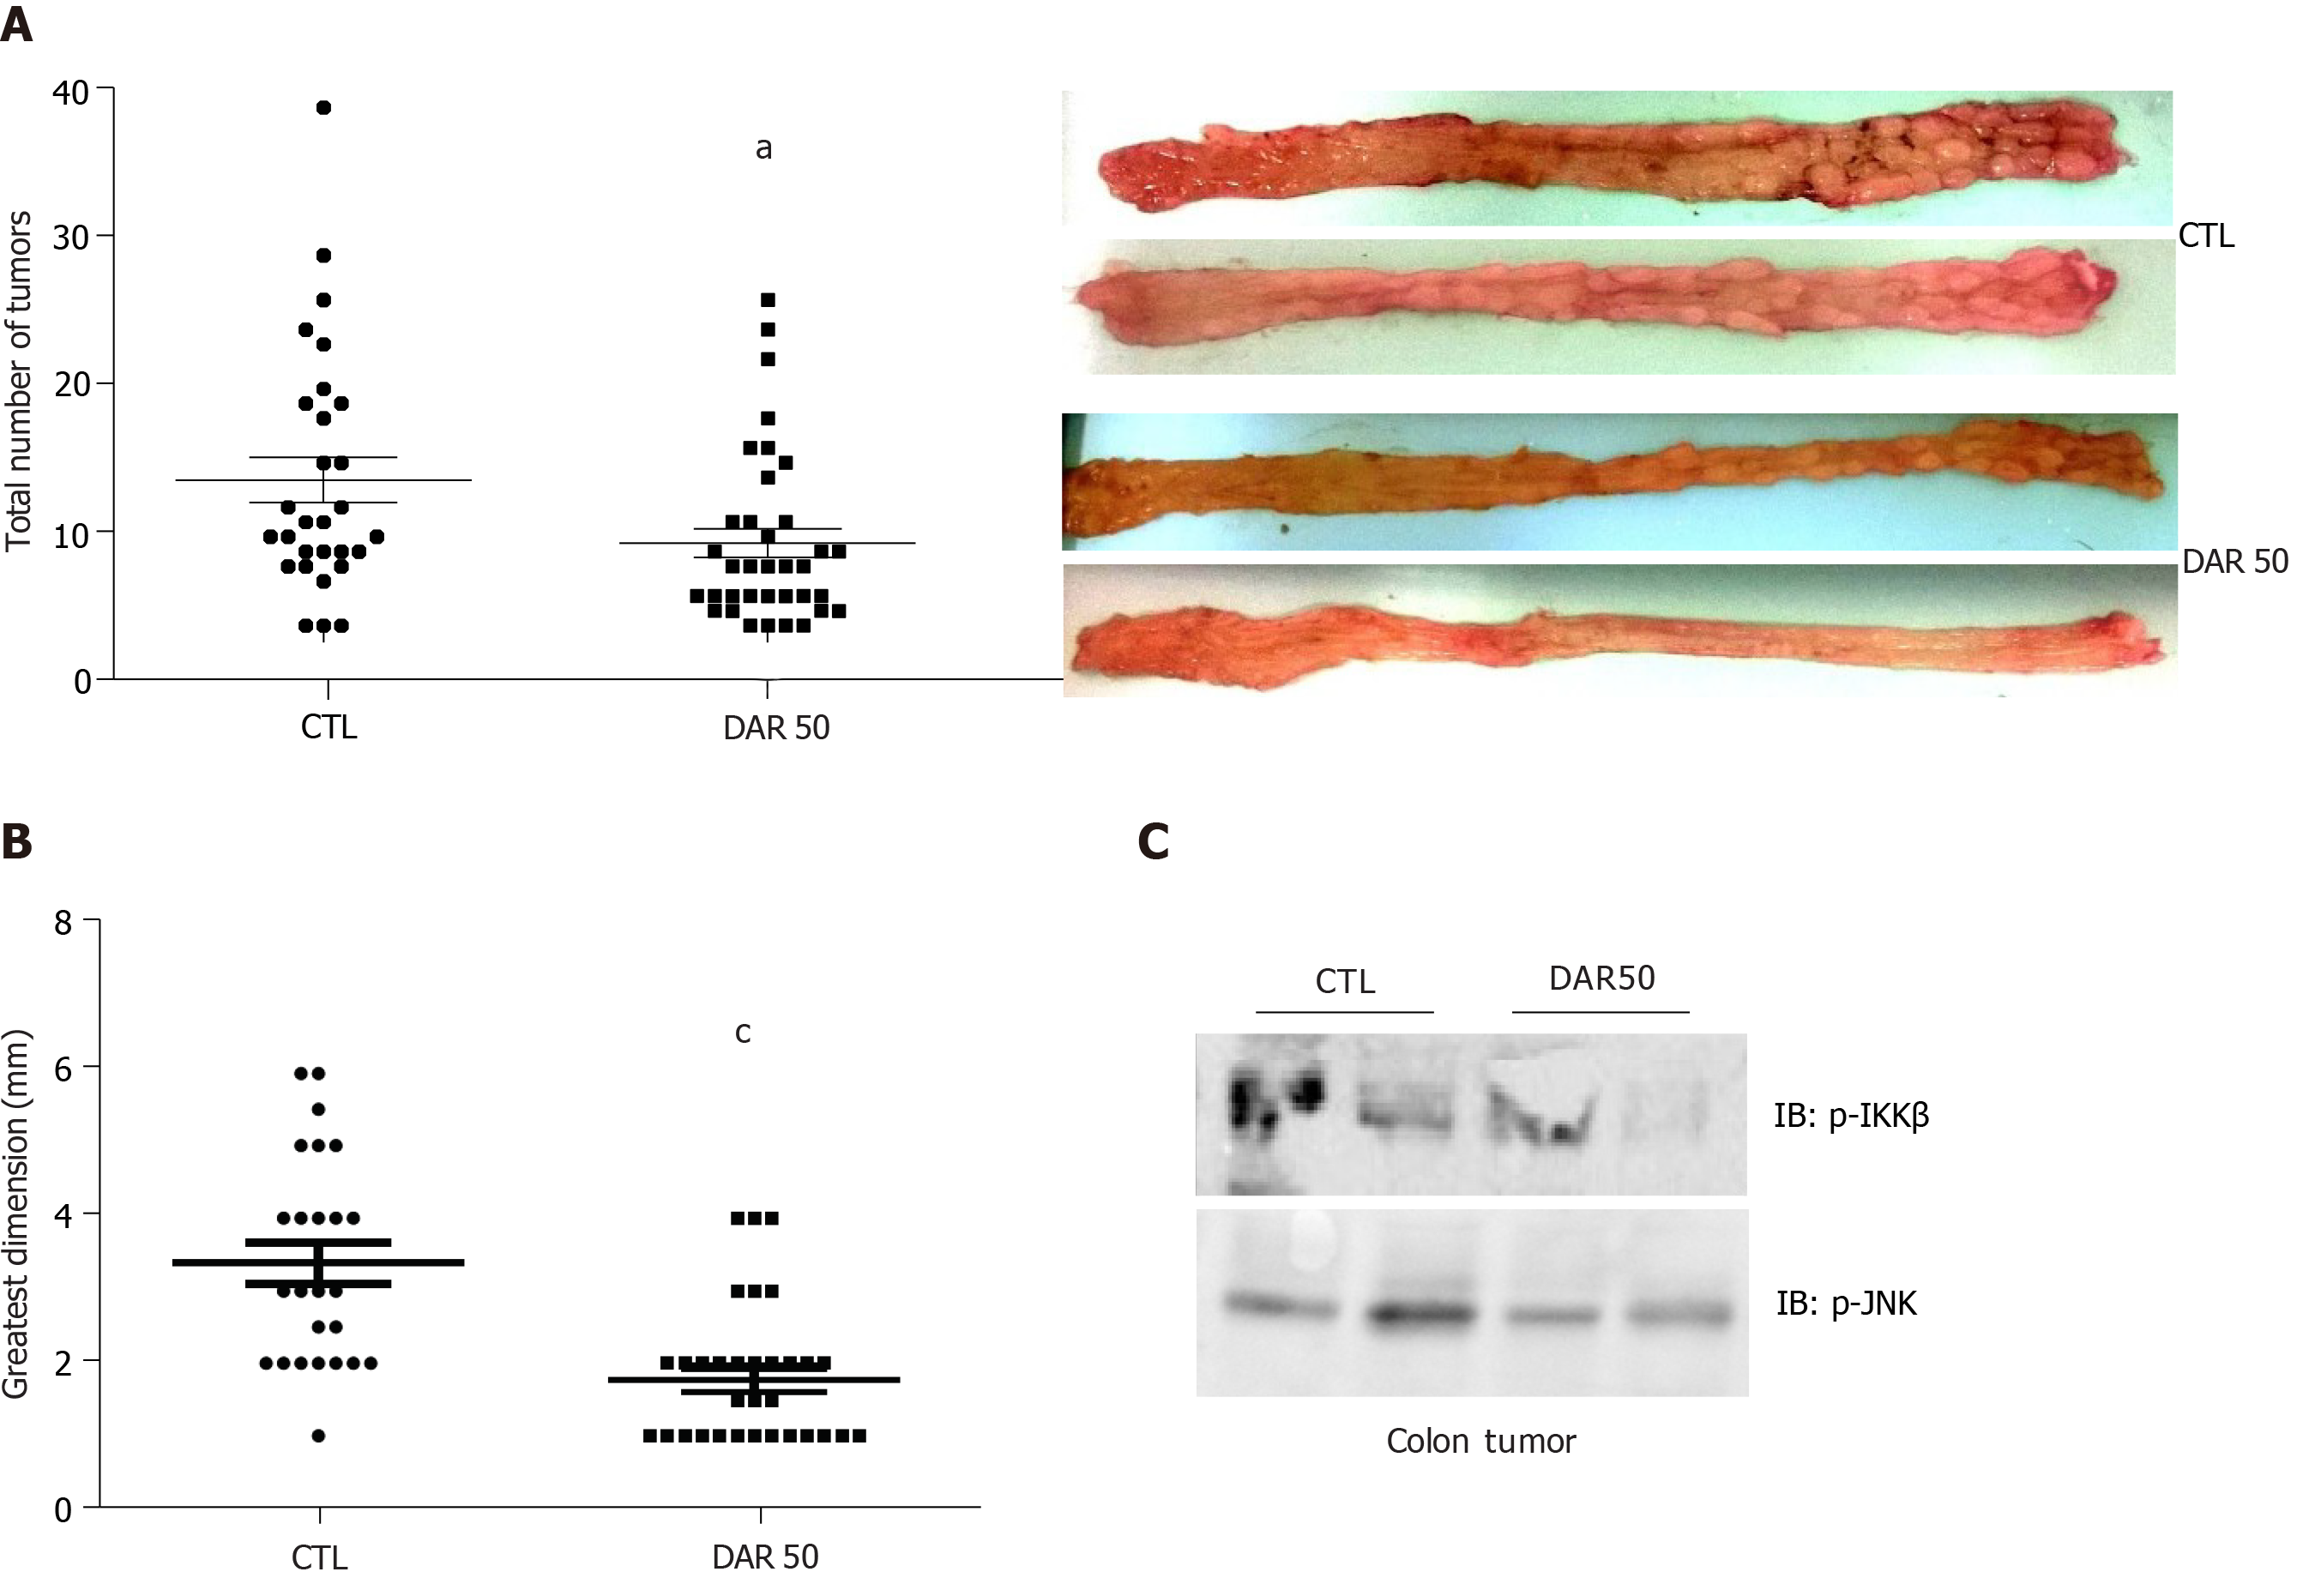
Figure 3 Diacerein prevents inflammation-induced colon carcinogenesis.
Swiss mice underwent colon cancer induction by azoxymethane and dextran sulphate sodium treatment over 3 mo, control. A: Tumor number (n = 29–36 mice/group); B: Tumor size (n = 25–33 mice/group); C: Analysis of pro-inflammatory protein expression (p-IKK, p-JNK) by immunoblot (Supplementary Figure 2). Data are presented as mean ± standard error. aP < 0.05; cP < 0.001.
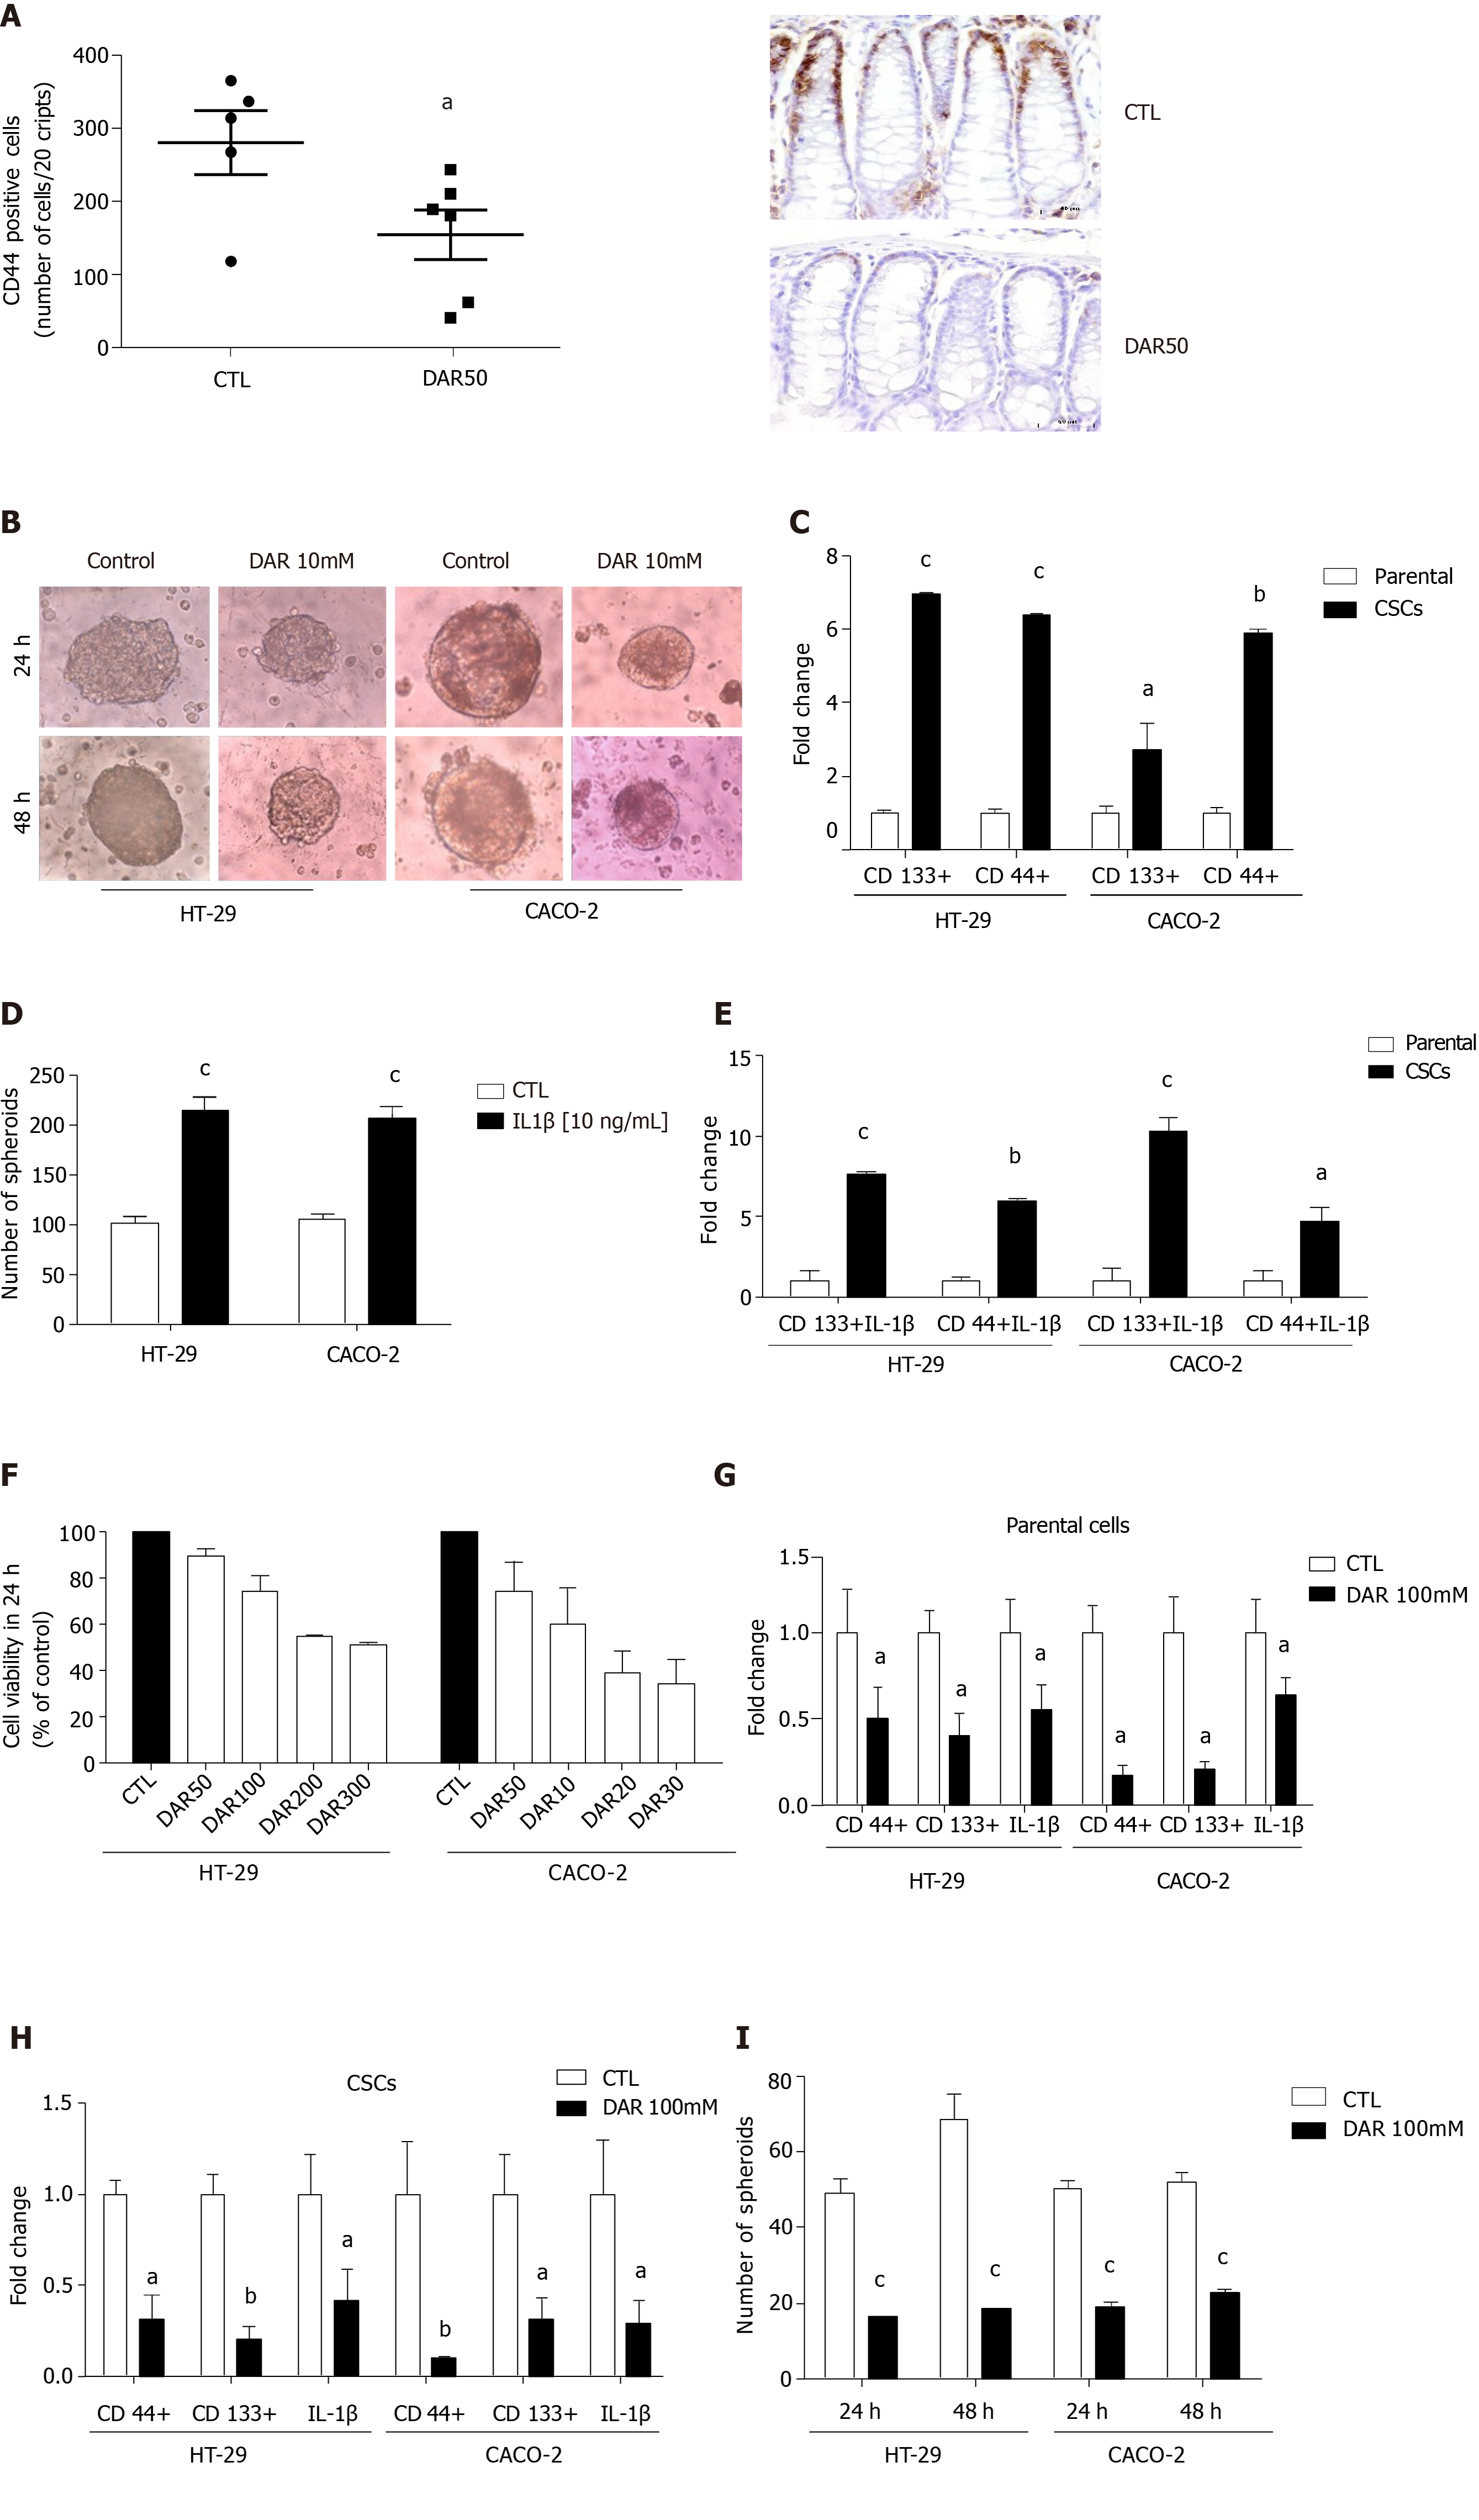
Figure 4 Diacerein effects on cancer stem cells.
A: Quantification of CD44 and representative microphotographs of stained colon sections (magnification 40 ×), scale bar: 50 µm; B: Representative images of cancer stem cells (CSCs) cultured in serum or stem-selective conditions with or without diacerein (DAR) 100 mM in HT-29 and CACO-2 cells; C: Quantitative reverse transcription polymerase chain reaction (RT-PCR) analysis of CSC markers CD133 and CD44 in parental cells and CSCs (n = 3) in HT-29 and CACO-2 cells; D: Number of spheres in HT-29 and CACO-2 cells after treatment with interleukin (IL)-1β (10 ng/mL) for 24 h (n = 8); E: Quantitative RT-PCR analysis of CD44 and CD133 in parental cells and CSCs; Parental: cells cultivated with Dulbecco’s modified Eagle’s medium (DMEM) + IL-1β (10 ng/mL); CSCs: cells cultivated with DMEM + IL-1β (10 ng/mL, n = 3); F: Cell viability evaluated through MTT assay. Control: Cells cultivated with DMEM; DAR 50 mM, 100 mM, 200 mM and 300 mM: Cells cultivated with DMEM + DAR in different concentrations (n = 3); G: Quantitative RT-PCR analysis of CD44, CD133 and IL-1β in parental cells. Control: Cells cultivated with DMEM; DAR 100 mM: Cells cultivated with DMEM + DAR 100 mM (n = 3); H: Quantitative RT-PCR analysis of CD44, CD133 and IL-1β in CSCs. Control: Cells cultivated with DMEM; DAR 100 mM: Cells cultivated with DMEM + DAR 100 mM (n = 3); I: Number of spheres in HT-29 and CACO-2 cells after treatment with DAR 100 mM or vehicle after 24 h (n = 8) and 48 h (n = 8). Data are presented as mean ± standard error. aP < 0.05; bP < 0.01; cP < 0.001.
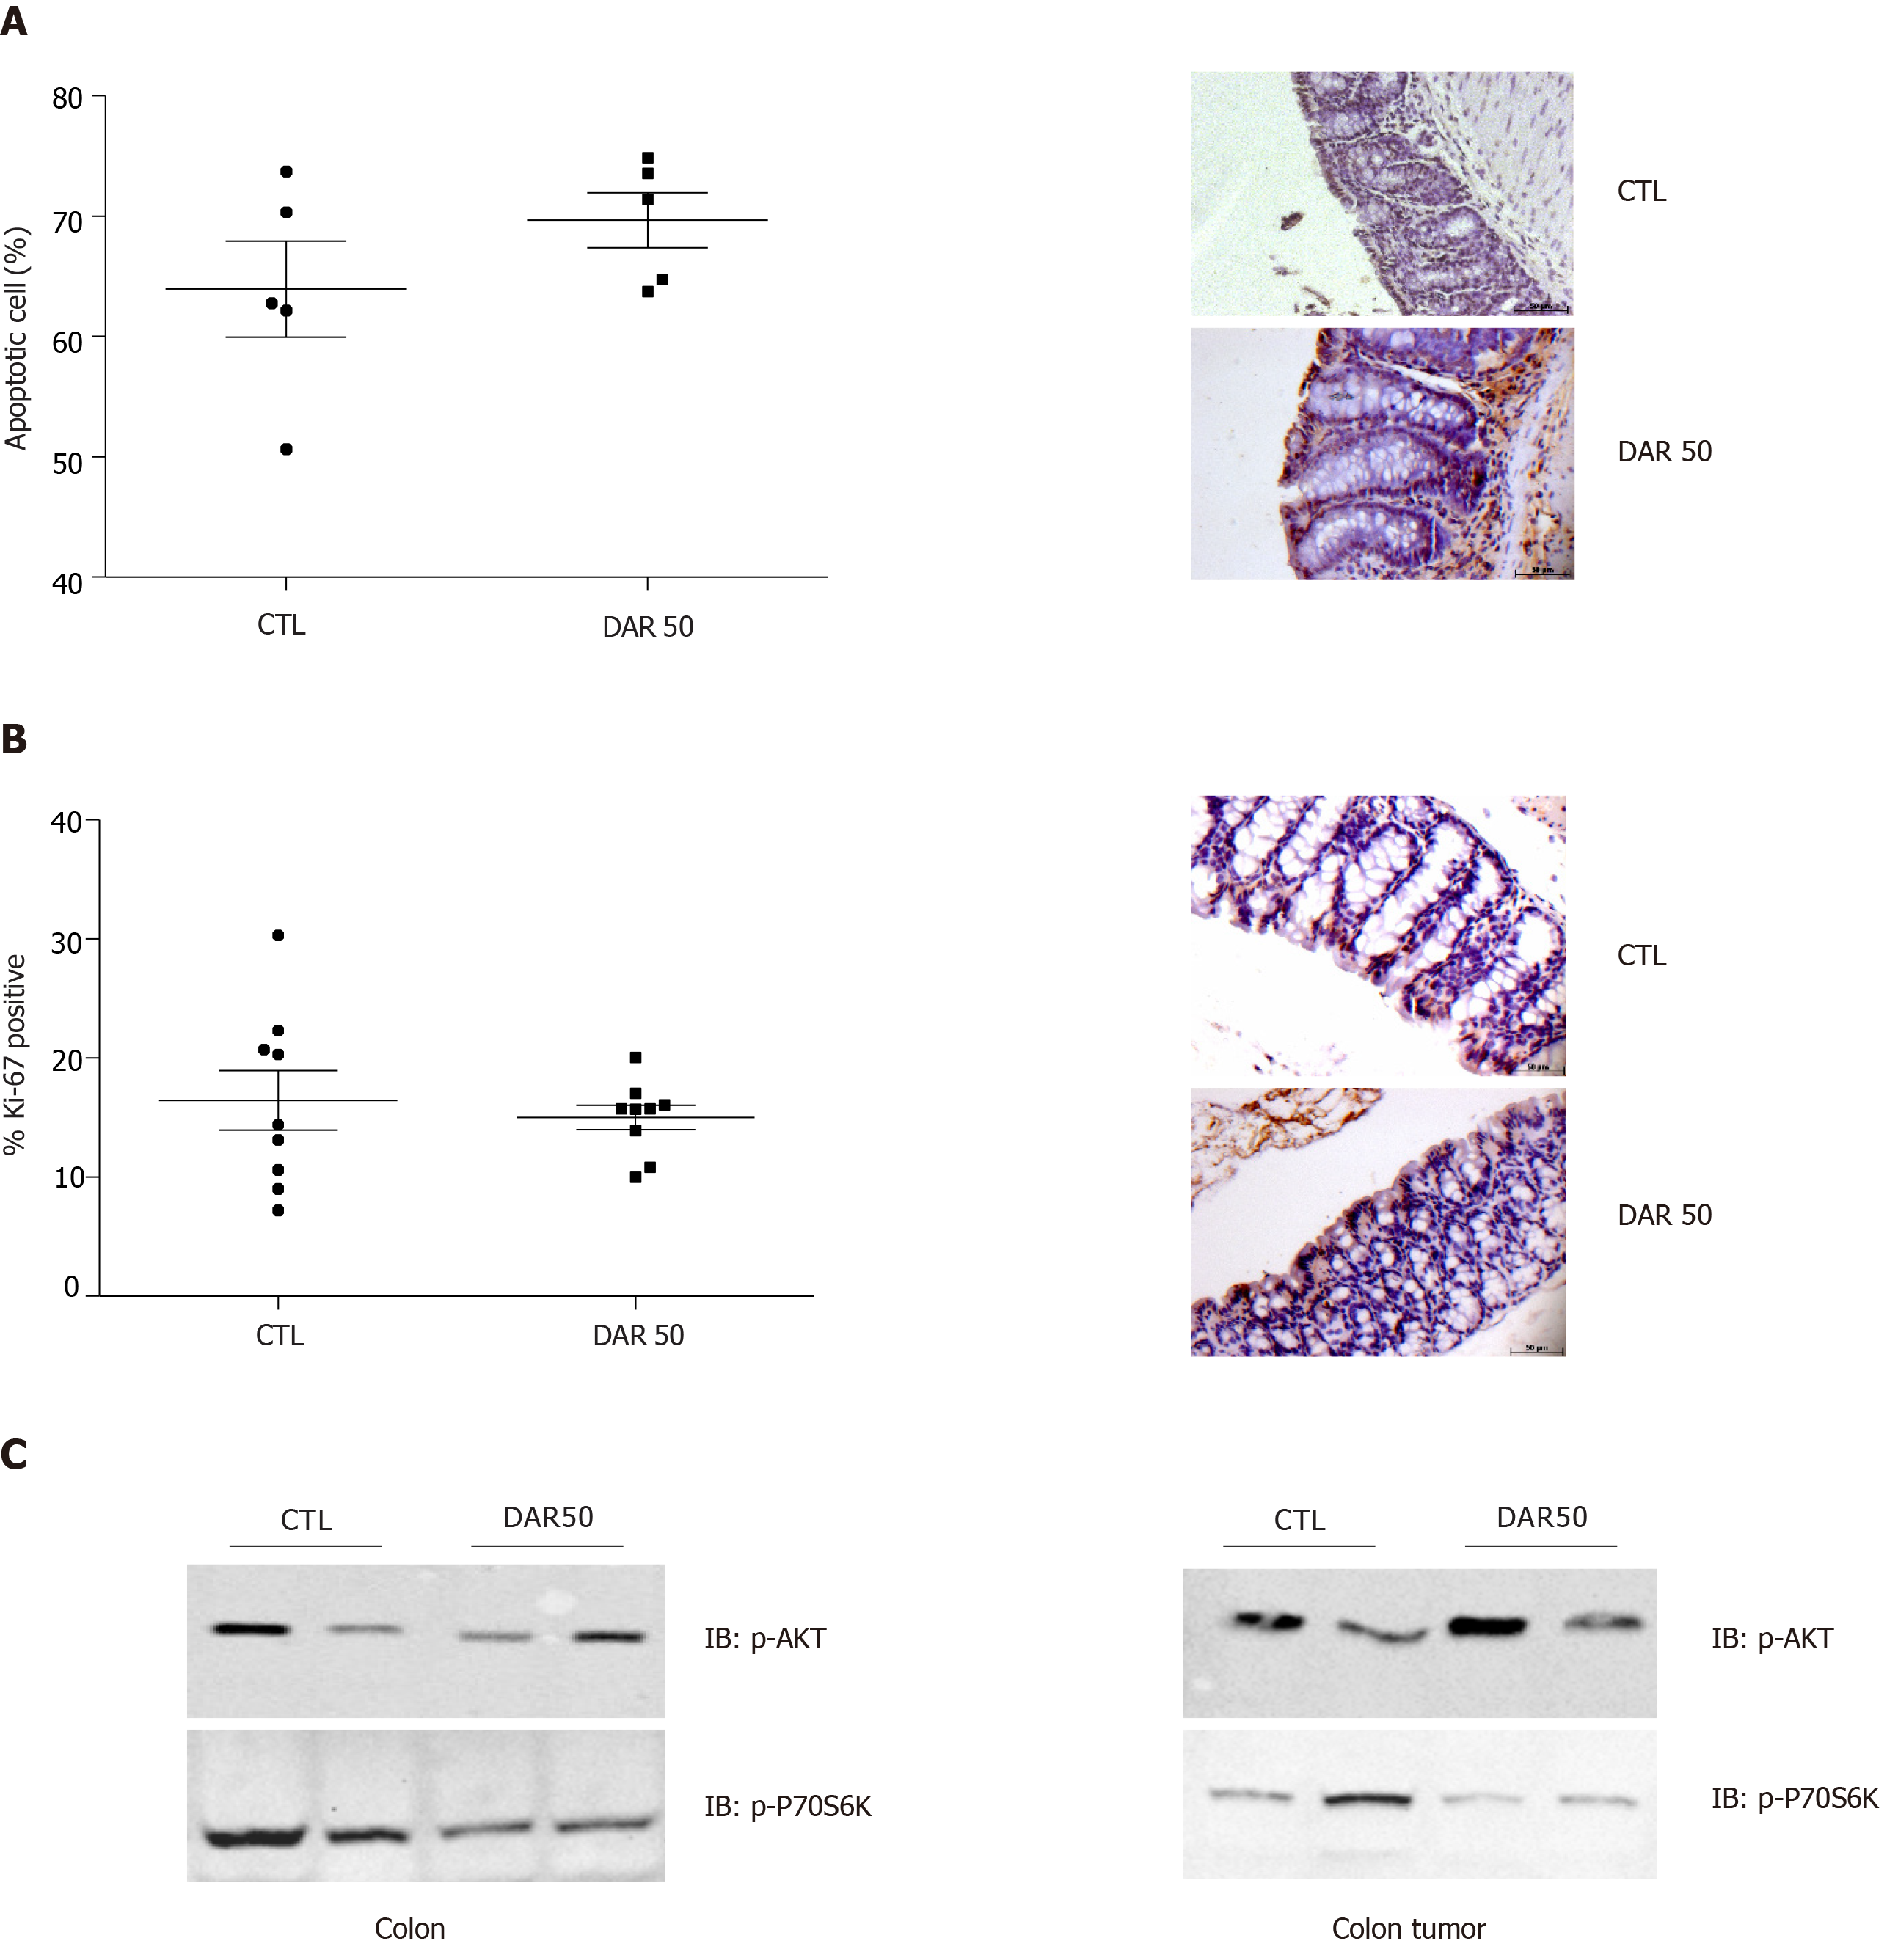
Figure 5 Diacerein treatment does not induce apoptosis or modulate cell proliferation.
A: Quantification of apoptosis by terminal deoxynucleotidyl transferase-mediated dUTP nick end labelling and representative microphotographs of stained colon sections containing tumors of control (CTL) and diacerein (DAR) 50-treated mice (magnification 40 ×), scale bar: 50 µm; n = 5; five fields per colonic tissue section; mean ± standard error; B: Quantification of Ki-67+ and representative microphotographs of stained colon sections containing tumors of CTL and DAR50-treated mice (magnification 40 ×), scale bar: 50 µm, n = 5; five fields per colonic tissue section; mean ± standard error; C: Analysis of protein expression involved in tumor growth signaling pathways (p-AKT, p-70S6K) by immunoblot analysis in colons and colonic tumors of Swiss mice (CTL and DAR50) (Supplementary Figures 3 and 4). Data are presented as mean ± standard error.
- Citation: Paulino DSM, Mendes MCS, Camargo JA, Brambilla SR, Wood Dos Santos T, Ribeiro ML, Carvalheira JBC. Diacerein treatment prevents colitis-associated cancer in mice. World J Clin Oncol 2020; 11(9): 732-746
- URL: https://www.wjgnet.com/2218-4333/full/v11/i9/732.htm
- DOI: https://dx.doi.org/10.5306/wjco.v11.i9.732


