Copyright
©2012 Baishideng Publishing Group Co.
World J Gastrointest Pharmacol Ther. Dec 6, 2012; 3(6): 86-92
Published online Dec 6, 2012. doi: 10.4292/wjgpt.v3.i6.86
Published online Dec 6, 2012. doi: 10.4292/wjgpt.v3.i6.86
Figure 1 Mean of serum glutamate oxaloacetate transaminase, serum glutamate pyruvate transaminase and alkaline phosphatase levels measured terminally (n = 6).
Normal control, carbon tetrachloride (CCl4) control, silymarin (100 mg/kg), heparin (2000 IU/kg), silymarin and heparin (combination) group and control treated animals. SGOT: Serum glutamate oxaloacetate transaminase; SGPT: Serum glutamate pyruvate transaminase; ALP: Alkaline phosphatase. aP < 0.05; bP < 0.01; dP < 0.001. A: Normal control vs CCl4 control; B: CCl4 control vs treatment group; C: Normal control vs control treated.
Figure 2 Mean of total, direct, indirect bilirubin and total protein levels measured terminally (n = 6).
Normal control, carbon tetrachloride (CCl4) control, Silymarin (100 mg/kg), Heparin (2000 IU/kg), Silymarin and Heparin (combination) group and control treated animals. bP < 0.001. A: Normal control vs CCl4 control; B: CCl4 control vs treatment group; C: Normal control vs control treated.
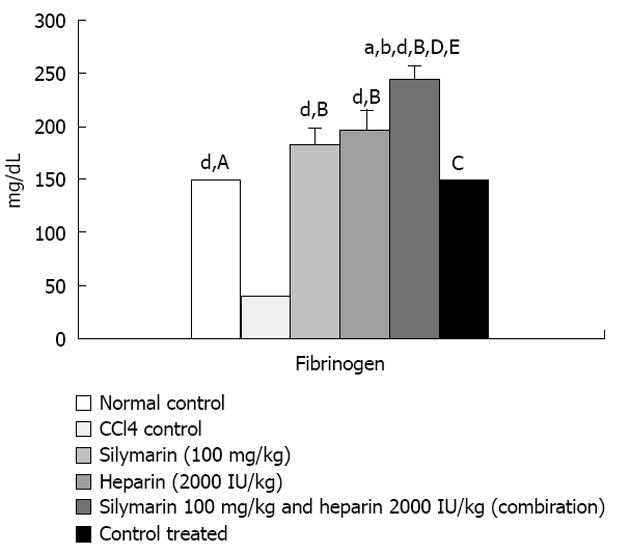
Figure 3 Mean fibrinogen levels measured terminally (n = 6).
Normal control, carbon tetrachloride (CCl4) control, silymarin (100 mg/kg), heparin (2000 IU/kg), silymarin and heparin (combination) group and control treated animals. aP < 0.05, bP < 0.01, dP < 0.001. A: Normal control vs CCl4 control; B: CCl4 control vs treatment group; C: Normal control vs control treated; D: Silymarin vs silymarin and heparin combination group; E: Heparin vs silymarin and heparin combination group.
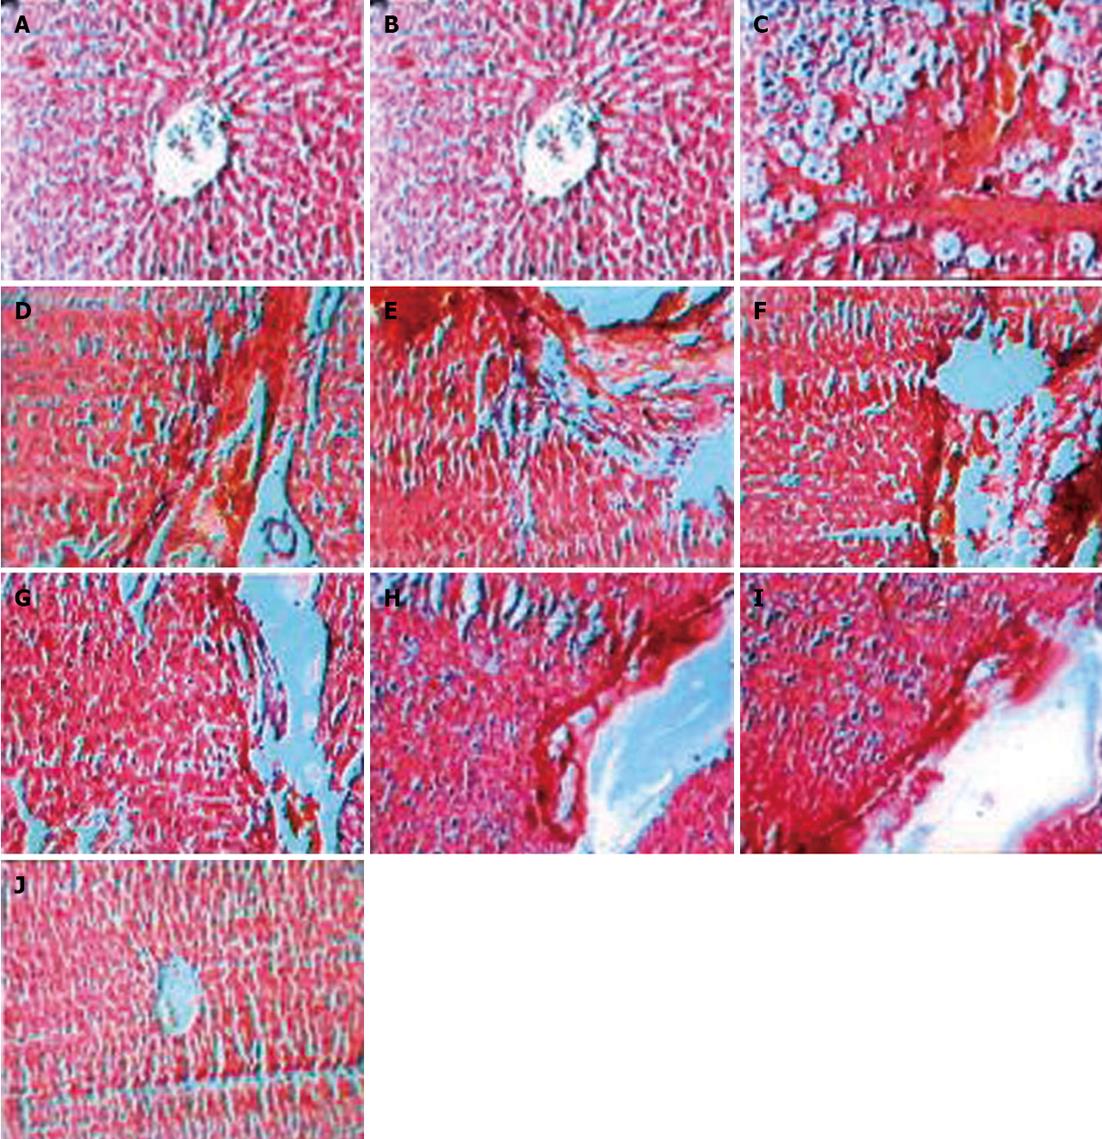
Figure 4 Photomicrograph of liver sections.
Normal control (normal arrangement of central vein and intact parenchyma) (A) and carbon tetrachloride control rats development of large septa of connective tissue flowing together and penetrating into the parenchyma, initiation of fibrous septa formation (B) and progressive septa formation which have a tendency to develop nodules of the liver architecture with loss of the structure of the hepatic lobules, seen in (C). Silymarin treated rats showing progressive breakage of fibrous septa (D) and mild degree of fibrolysis with lymphocytic infiltration (E), Heparin treated rats showing progressive breakage of fibrous septa (F) and moderate degree of fibrolysis with lymphocytic infiltration (G), Silymarin and Heparin treated rats showing progressive breakage and almost dissolution of fibrous septa (H) and severe degree of fibrolysis with lymphocytic infiltration (I). Control treated rats showing normal arrangement of central vein and intact parenchymal cells (J).
- Citation: Shah B, Shah G. Antifibrotic effect of heparin on liver fibrosis model in rats. World J Gastrointest Pharmacol Ther 2012; 3(6): 86-92
- URL: https://www.wjgnet.com/2150-5349/full/v3/i6/86.htm
- DOI: https://dx.doi.org/10.4292/wjgpt.v3.i6.86


