Copyright
©The Author(s) 2021.
World J Gastrointest Pathophysiol. Nov 22, 2021; 12(6): 115-133
Published online Nov 22, 2021. doi: 10.4291/wjgp.v12.i6.115
Published online Nov 22, 2021. doi: 10.4291/wjgp.v12.i6.115
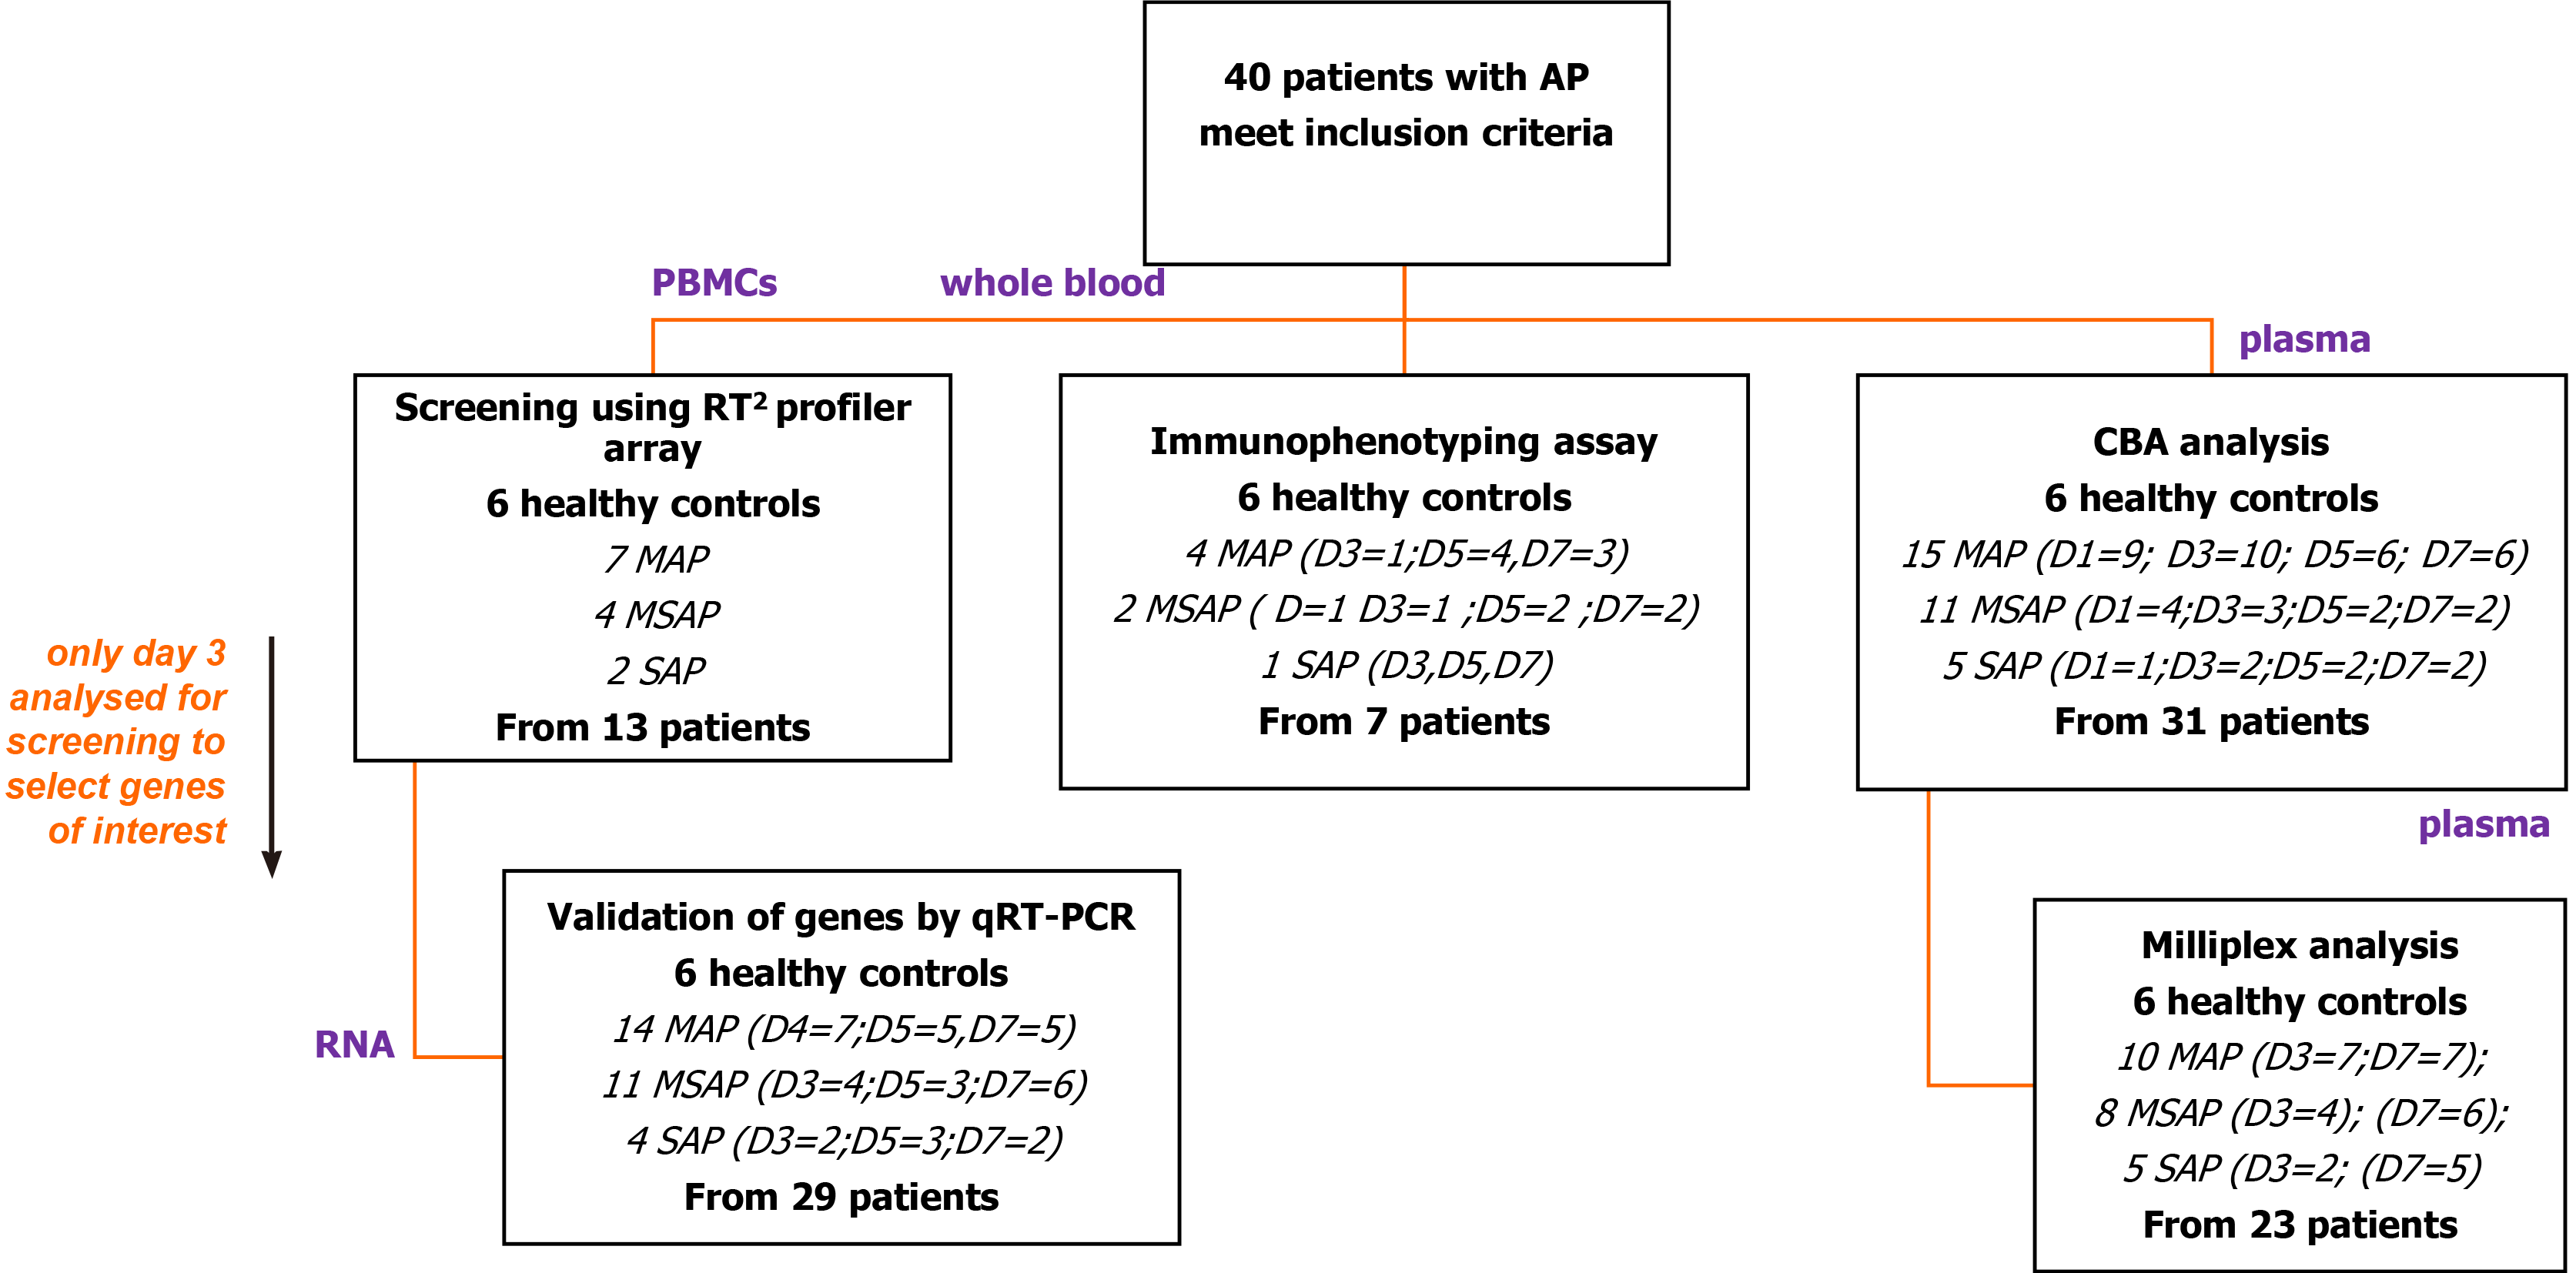
Figure 1 Flow diagram of patient recruitment.
From the 40 patients and 6 healthy controls recruited over the study period, peripheral blood mononuclear cells, whole blood and plasma were used for the various study assays as shown. Peripheral blood mononuclear cells (PBMCs) from 13 patients with Day 3 data were used to do a screening study of innate and adaptive immune cell genes using RT2 Profiler Array (Qiagen, Hilden, Germany). CCR8 was selected as a target gene and further verification studies done in 29 patients as depicted. For immunophenotyping, 12 antibodies were selected to discriminate monocytes, lymphocytes, and granulocytes and their subpopulations from blood samples of seven patients. An exploratory study of seven Th1/Th2/Th17 cytokines was done on 31 patient samples and 23 of these randomly selected for further analysis using the MILLIPLEX® assay. PBMCs: Peripheral blood mononuclear cells; RT2: Reverse transcriptase square; D: Day; MAP: Mild acute pancreatitis; MSAP: Moderately severe acute pancreatitis; SAP: Severe acute pancreatitis; CCR8: Chemokine receptor 8; Th1/Th2/Th17: T helper type 1/2/17.
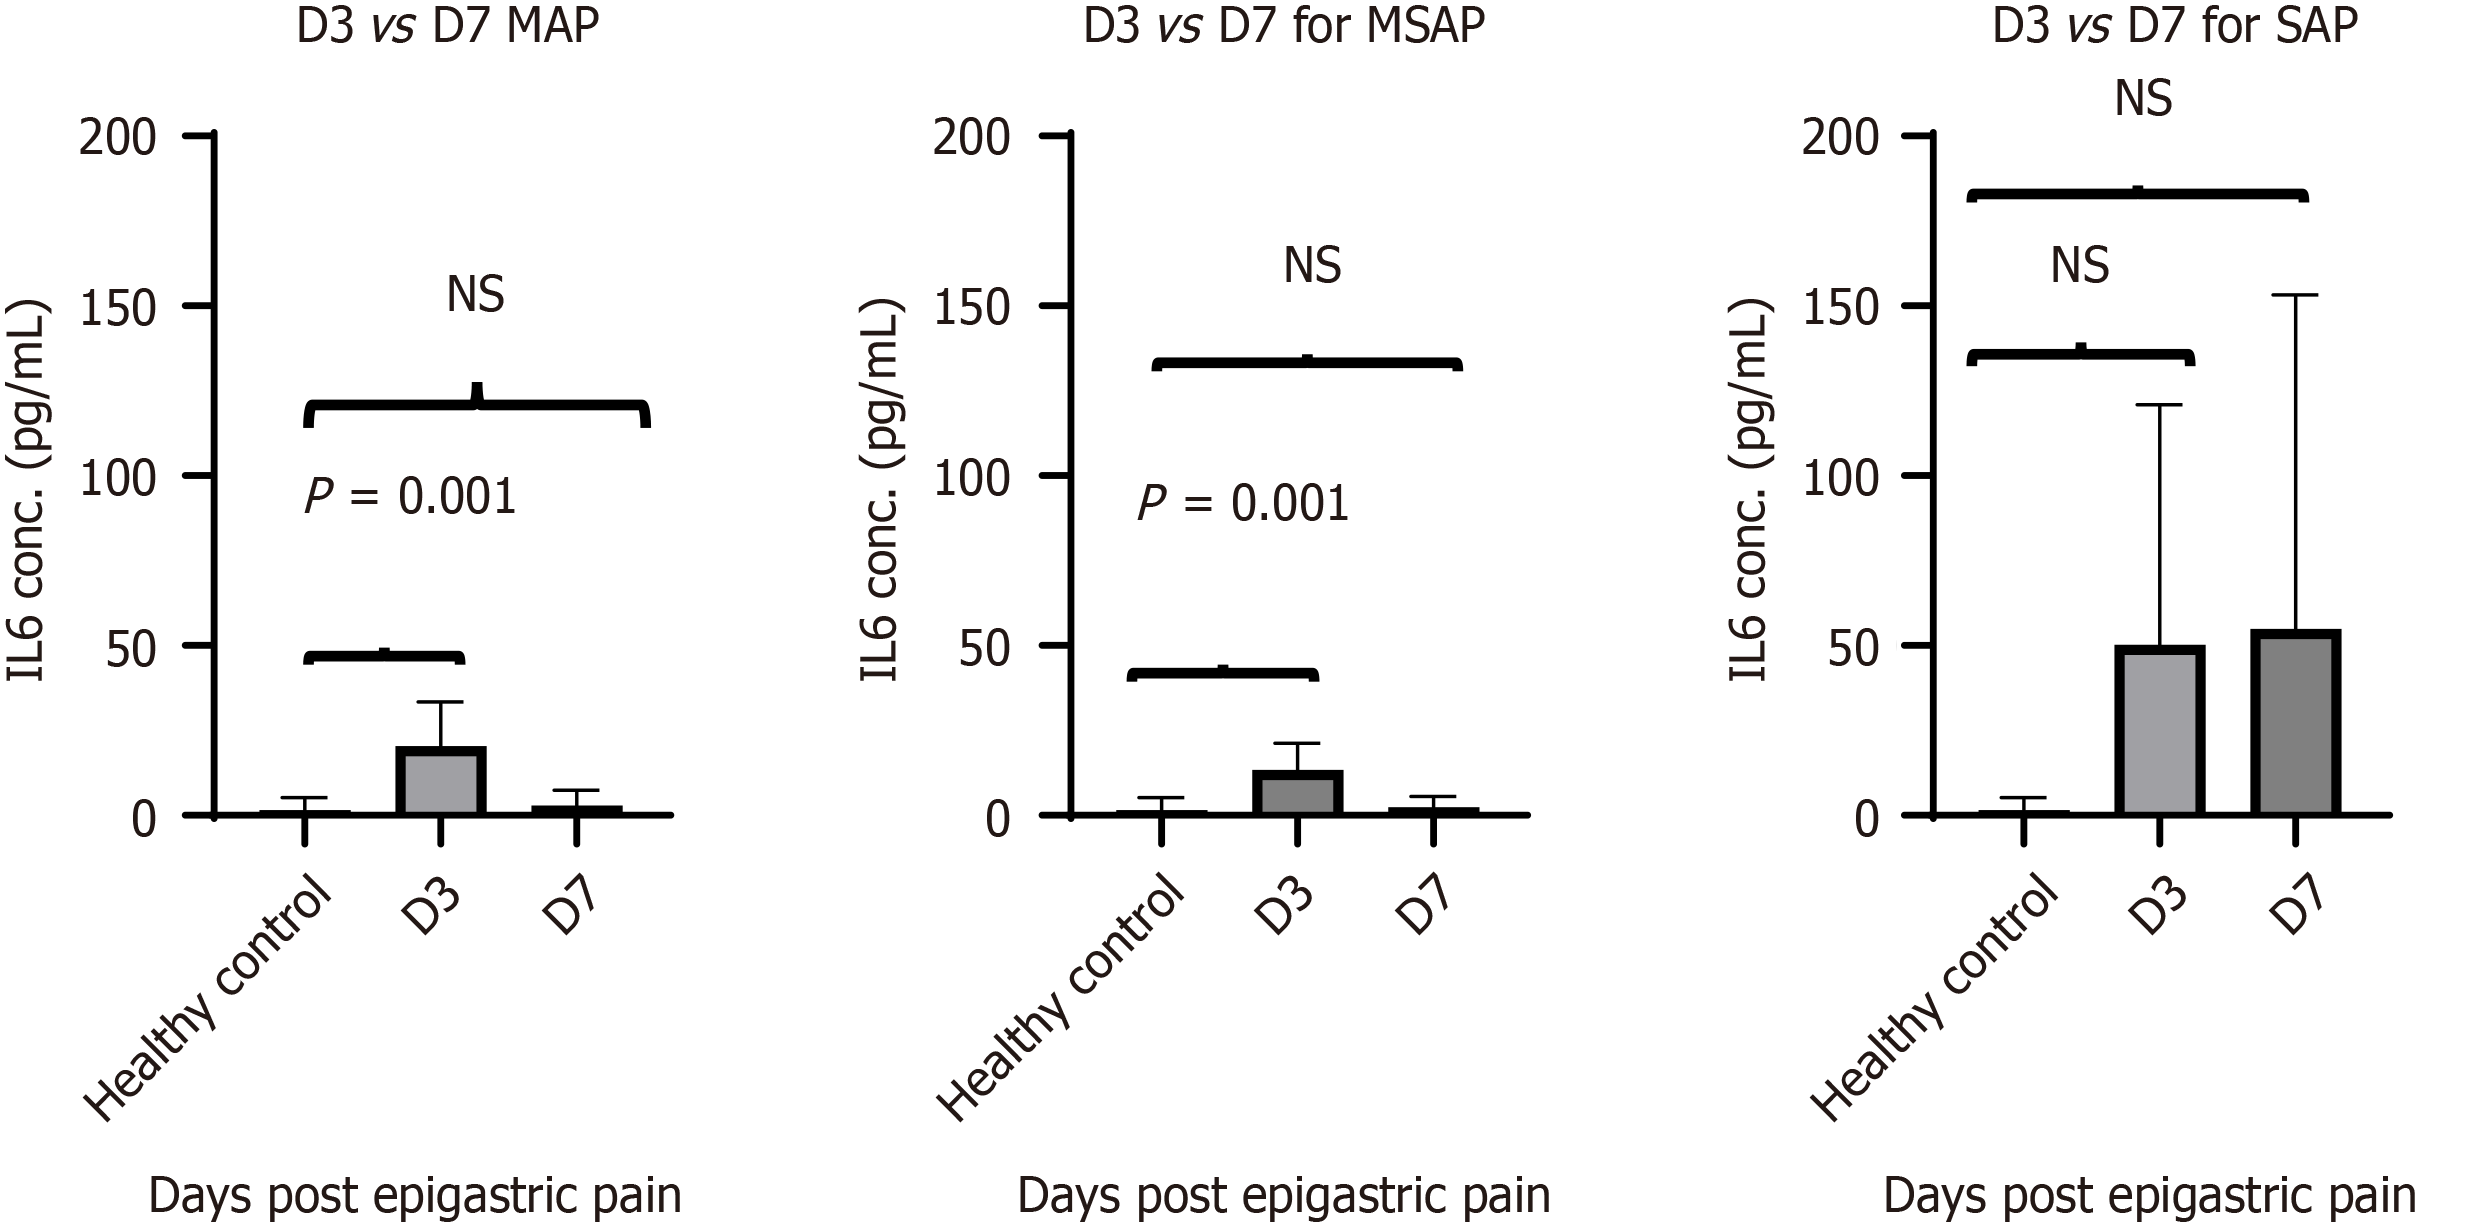
Figure 2 IL-6 secretion levels acquired using the MILLIPLEX® MAP Human Th17 Magnetic Bead Panel kit.
Analysis was done on 23 patients sampled on Day 3 and Day 7 and 6 healthy controls were included. The concentration of interleukin (IL)-6 was highest in the SAP group 50 ± 50 pg/mL and 65 ± 61 pg/ml on D3 (n = 2) and D7 (n = 5) respectively. The MAP group IL-6 levels were 13 ± 8 pg/mL (n = 7) and MSAP 20 ± 13 pg/mL groups (n = 4) on D3. Significant differences were observed between the healthy controls (n = 6) and MSAP at D3 (n = 4) with P = 0.014 and P = 0.013 respectively. A Dunn’s multiple comparison test was used as a post hoc to adjust P values. D: Day of the specific severity group; n: number; MAP: Mild acute pancreatitis; MSAP: Moderately severe acute pancreatitis; SAP: Severe acute pancreatitis; IL-6: Interleukin-6.
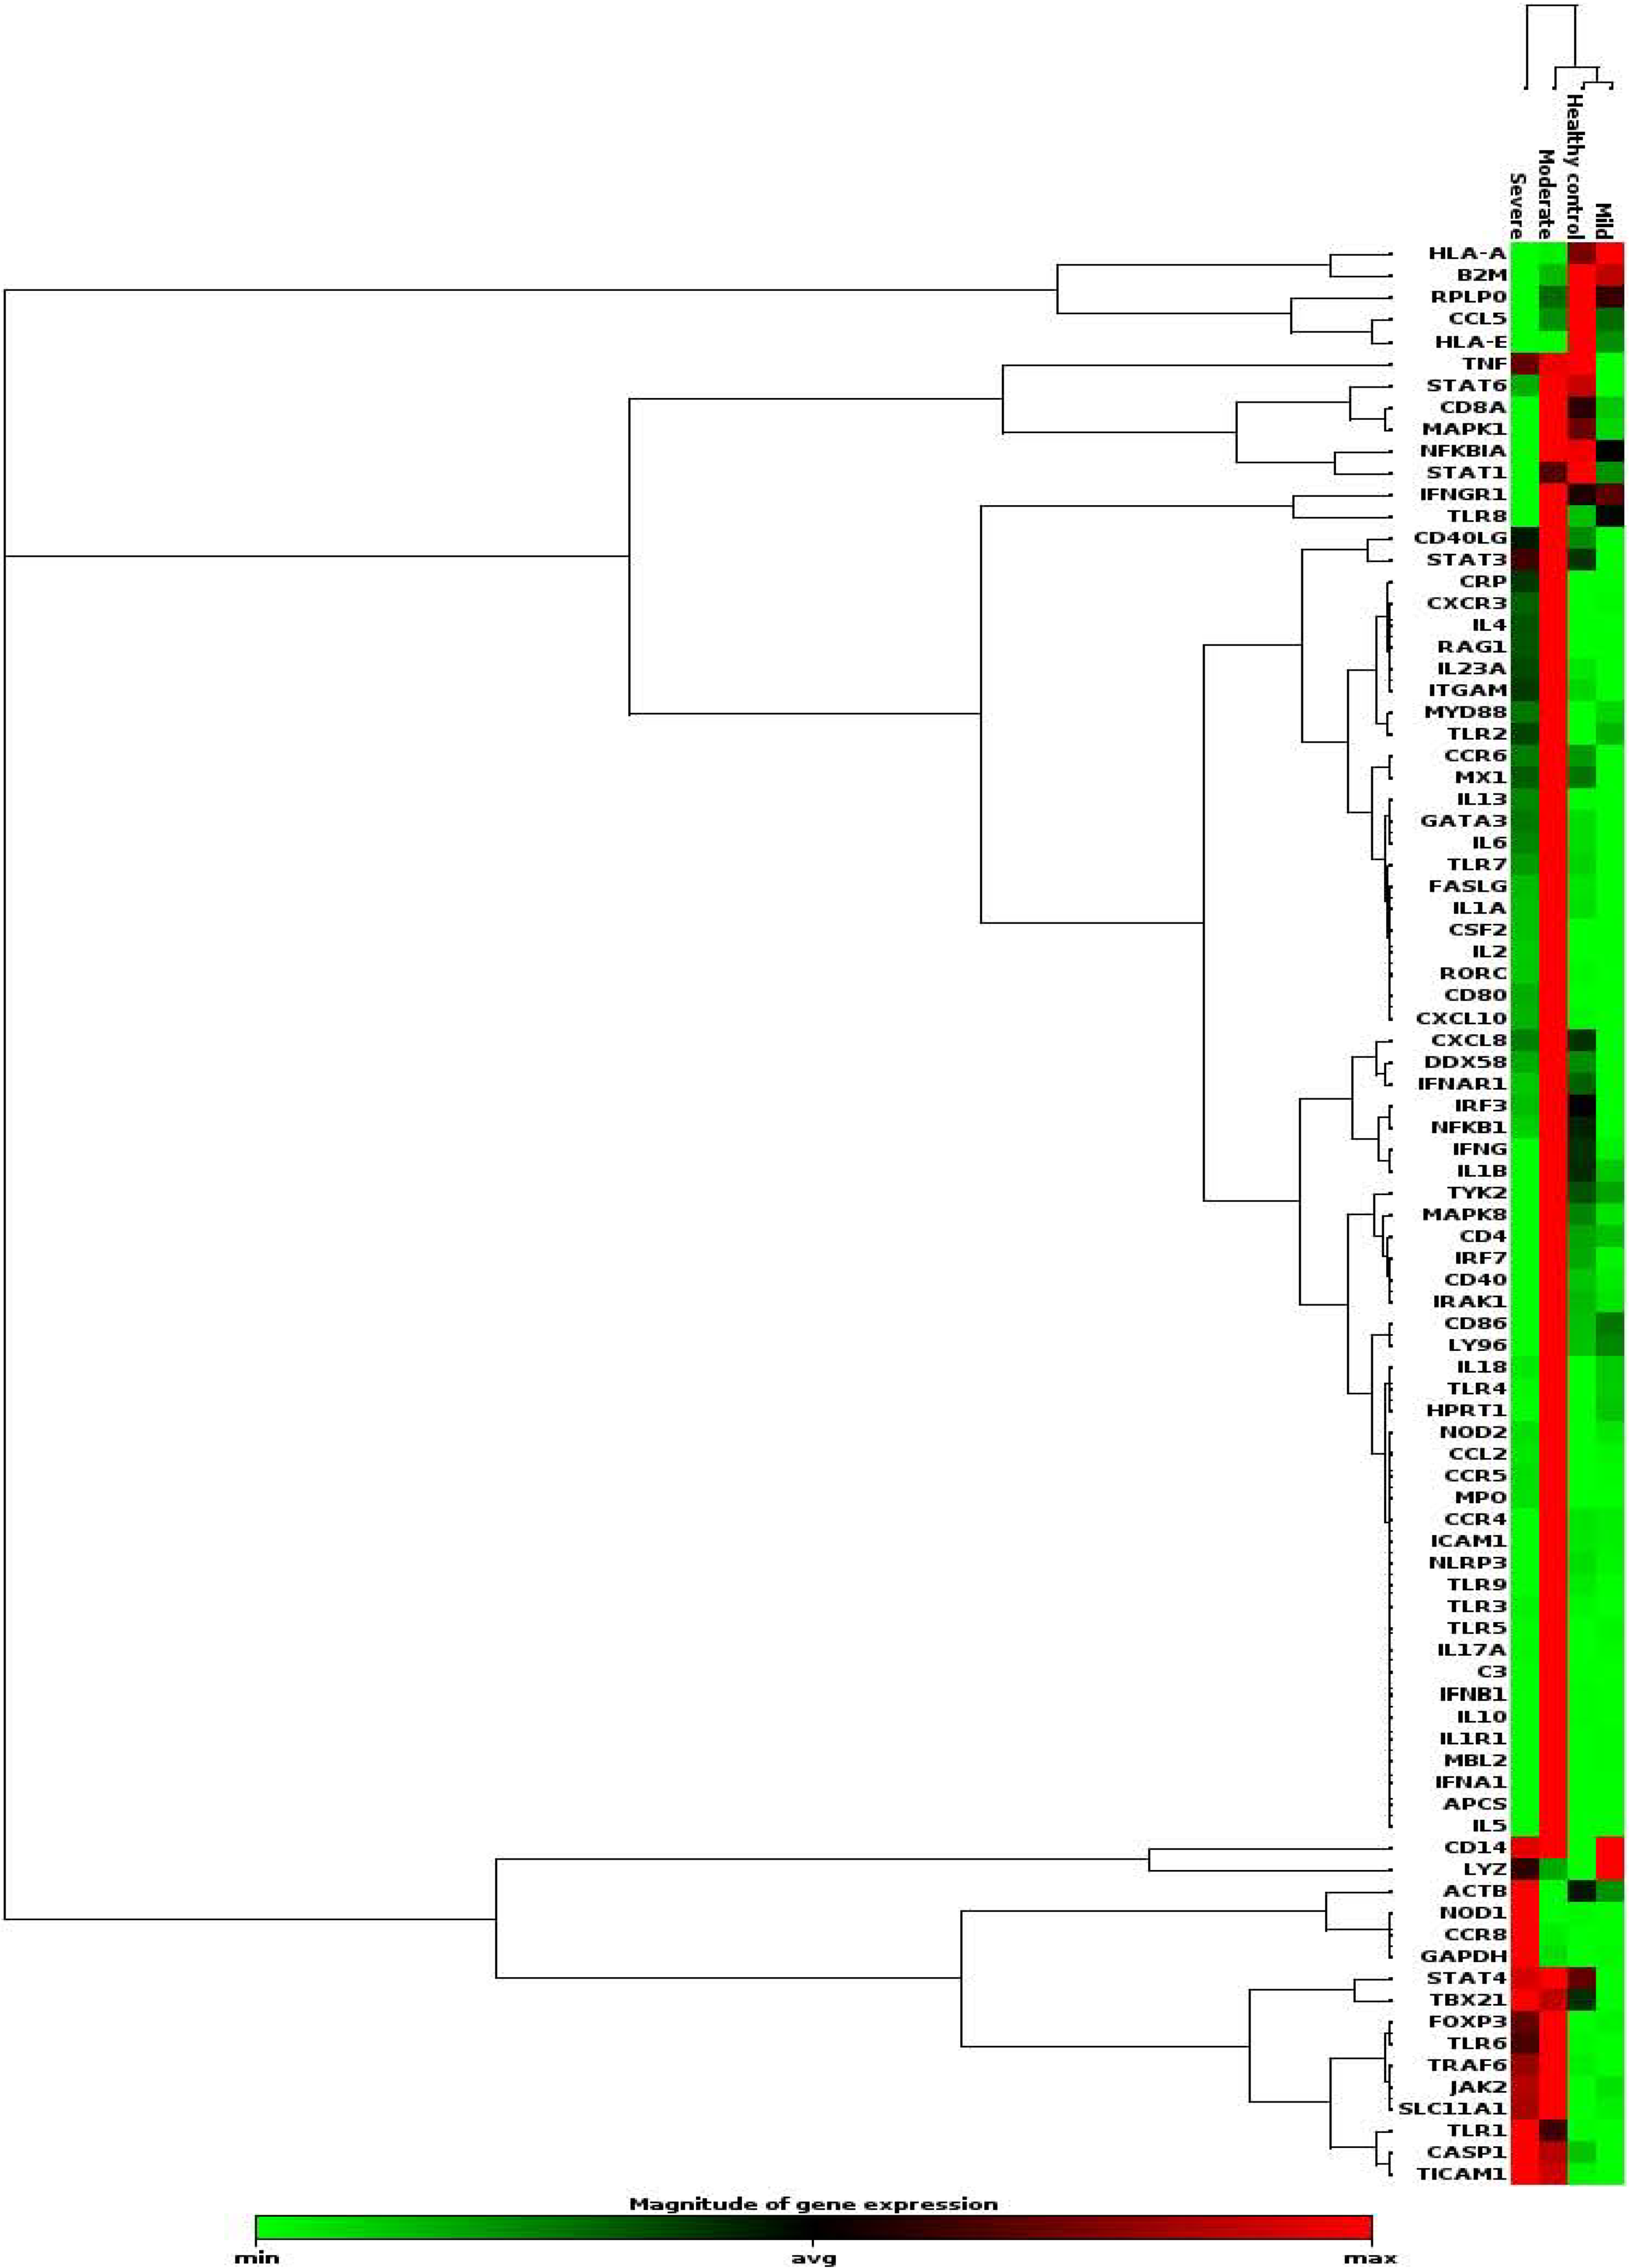
Figure 3 A heat map showing gene dysregulation in mild moderate and severe acute pancreatitis patients compared to healthy controls.
Hierarchical cluster of all the genes across patient severities are shown. Red colour represents upregulated genes, green is downregulated and black is unchanged. Chemokine receptor 8 (CCR8) was shown to increase with severity and so were GAPDH, NOD1, TRL 1, TICAM 1, TBX21, and CASP1, which are associated with CCR8 expression. GAPDH: Glyceraldehyde 3-phosphate dehydrogenase; NOD1: Nucleotide-binding oligomerization domain-containing protein 1; TRL 1: Toll like receptor 1; TICAM 1: Toll Like Receptor Adaptor Molecule 1; TBX21: T-Box Transcription Factor 21; CASP1: Caspase 1; apoptosis-related cysteine peptidase; CCR8: Chemokine receptor 8; MAP: Mild acute pancreatitis; MSAP: Moderately severe acute pancreatitis; SAP: Severe acute pancreatitis.
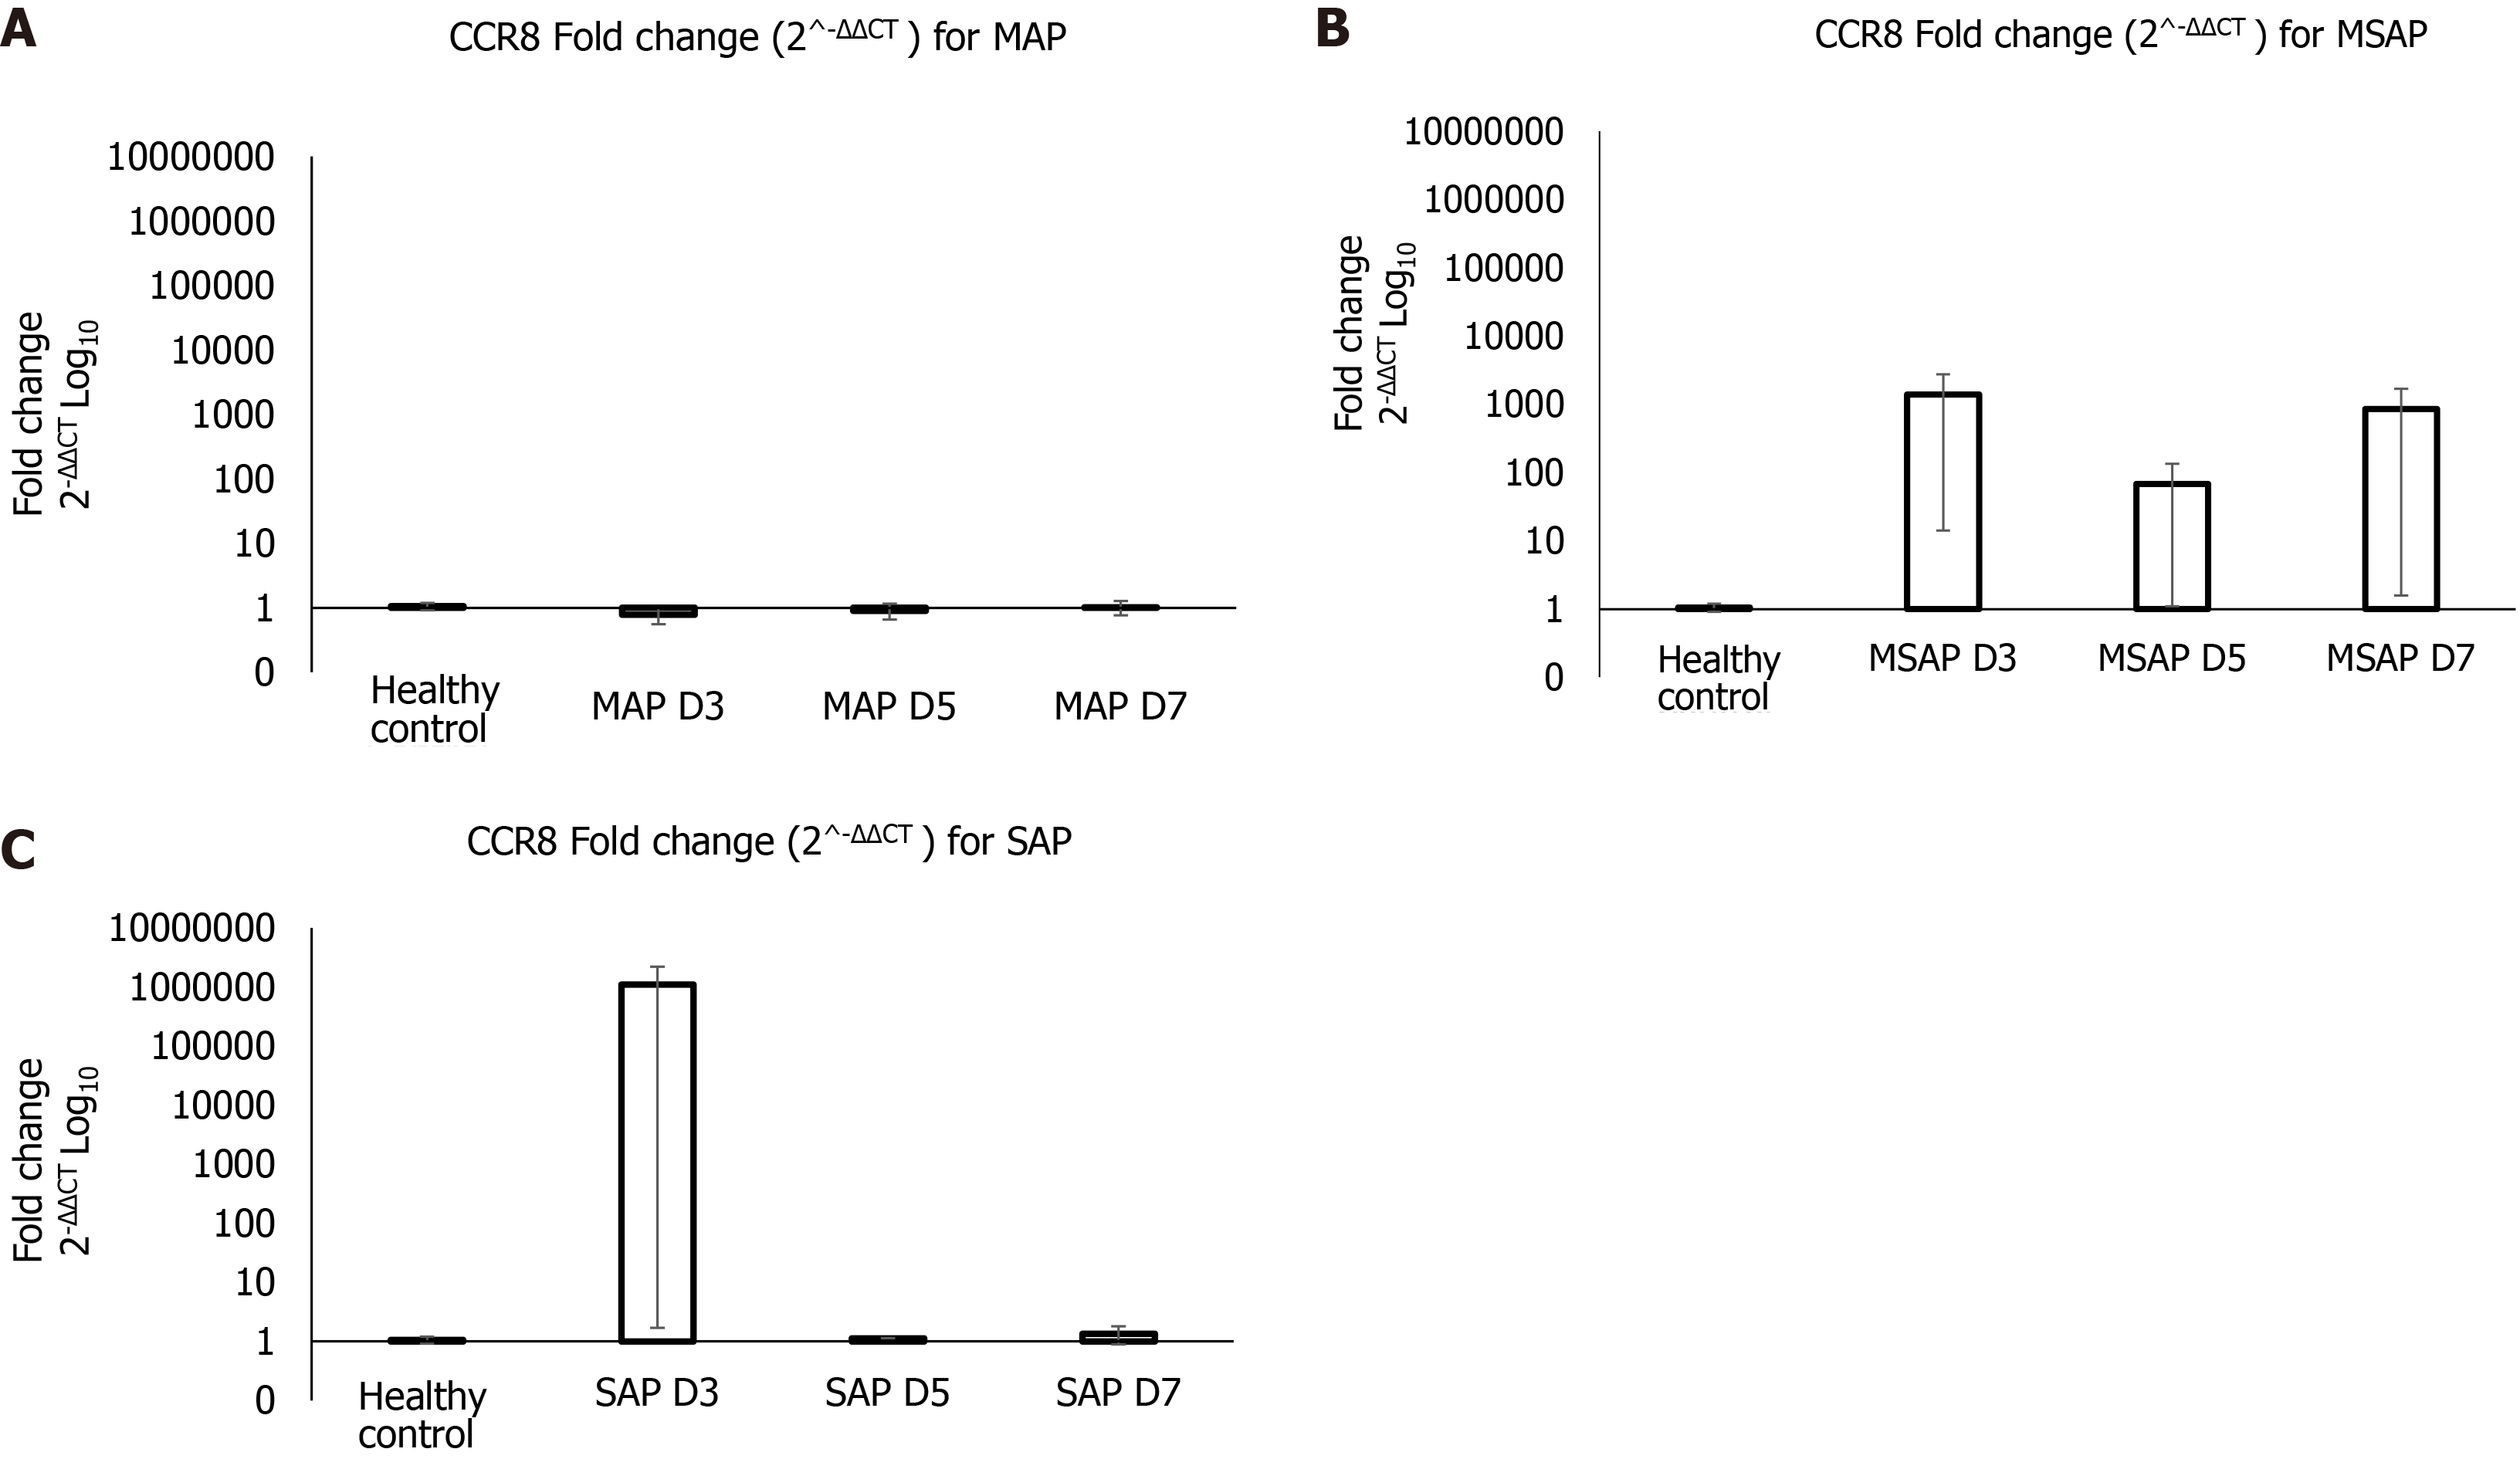
Figure 4 Gene expression analysis for chemokine receptor 8 in different severities at Day 3, 5 and 7 post epigastric pain due to acute pancreatitis for mild acute pancreatitis, moderately severe acute pancreatitis, and severe acute pancreatitis.
The data is shown on a Log10 transformed scale of the fold change (2-ΔΔCT) normalized using RPL13A gene on VIC fluorescent dye (Hs04194366_g1, Thermo Fischer Scientific) as reference gene. A: The FC of CCR8 was less than 1 at D3 and D5, then increased slightly to 1 at D7 for MAP group compared to healthy controls. B: At D3 and D7 the FC for the MSAP group was 1000 times more than in the healthy controls. C: In the SAP group the FC at D3 was 1000000 times more than in the healthy controls and the D5 and D7 was 1 time more. FC: fold change. D: D3 of the specific severity group; MAP: Mild acute pancreatitis: MSAP: Moderately severe acute pancreatitis; SAP: Severe acute pancreatitis; CCR8: Chemokine receptor 8.
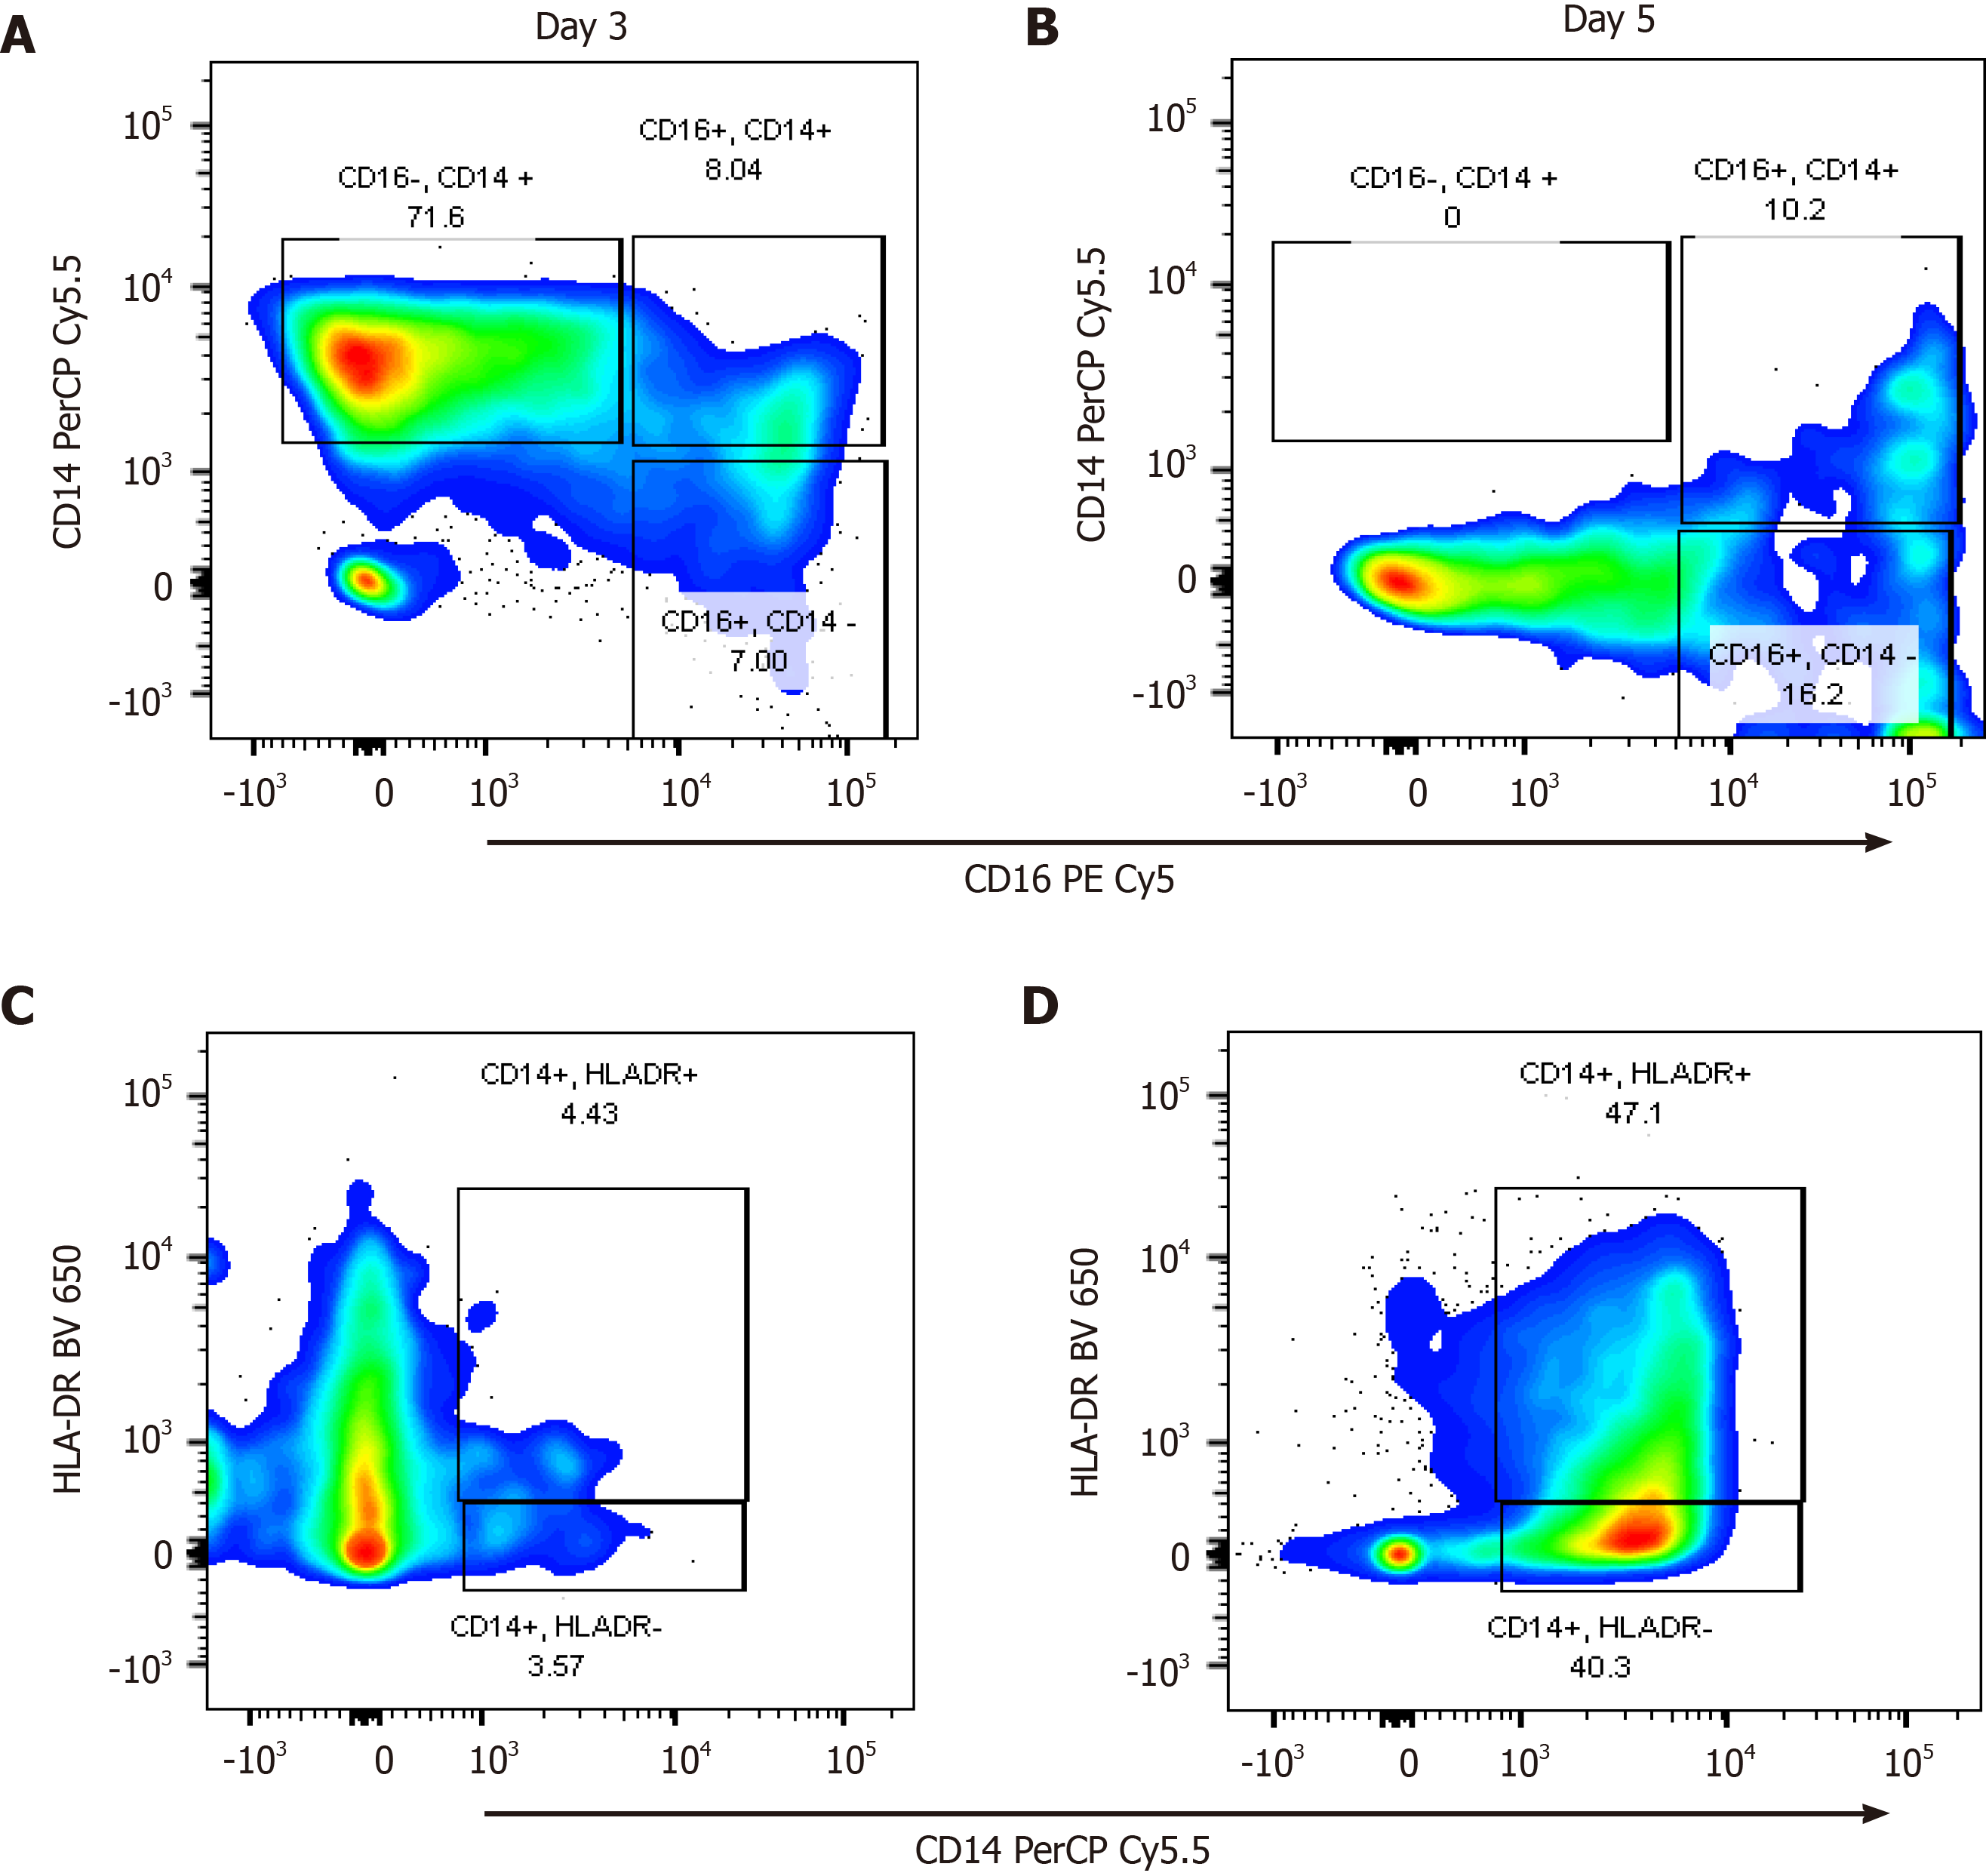
Figure 5 Representative moderately severe acute pancreatitis profile of the monocyte subpopulation.
Cells were gated into intermediate (CD14+CD16+), classical (CD14+CD16-), non-classical monocytes (CD16+CD14-) and HLA-DR+/- monocytes. A and B: They showed CD14 PerCP Cy5.5 and CD16 PECy5 plot for Day 3 and Day 5 respectively. Classical monocyte subpopulations (CD14+CD16-) were higher in more severe patients with the MSAP patient having as much as 70% of the parent population on Day 3, which subsequently dropped to undetectable levels on Day 5. C and D: They showed a plot of CD14 PerCP Cy5.5 and HLA-DR BV650 for Day 3 and 5 respectively. The percentage of HLA-DR+ monocytes increased from 4% on Day 3 to 47% on Day 5. BUV: BD Horizon Brilliant™ Ultraviolet; Cy: Cyanine; BV: Brilliant Violet™; HLA DR: Human leukocyte D related; PE: Phycoerythrin; PerCP: Peridinin-Chlorophyll-protein; CD: Cluster of differentiation.
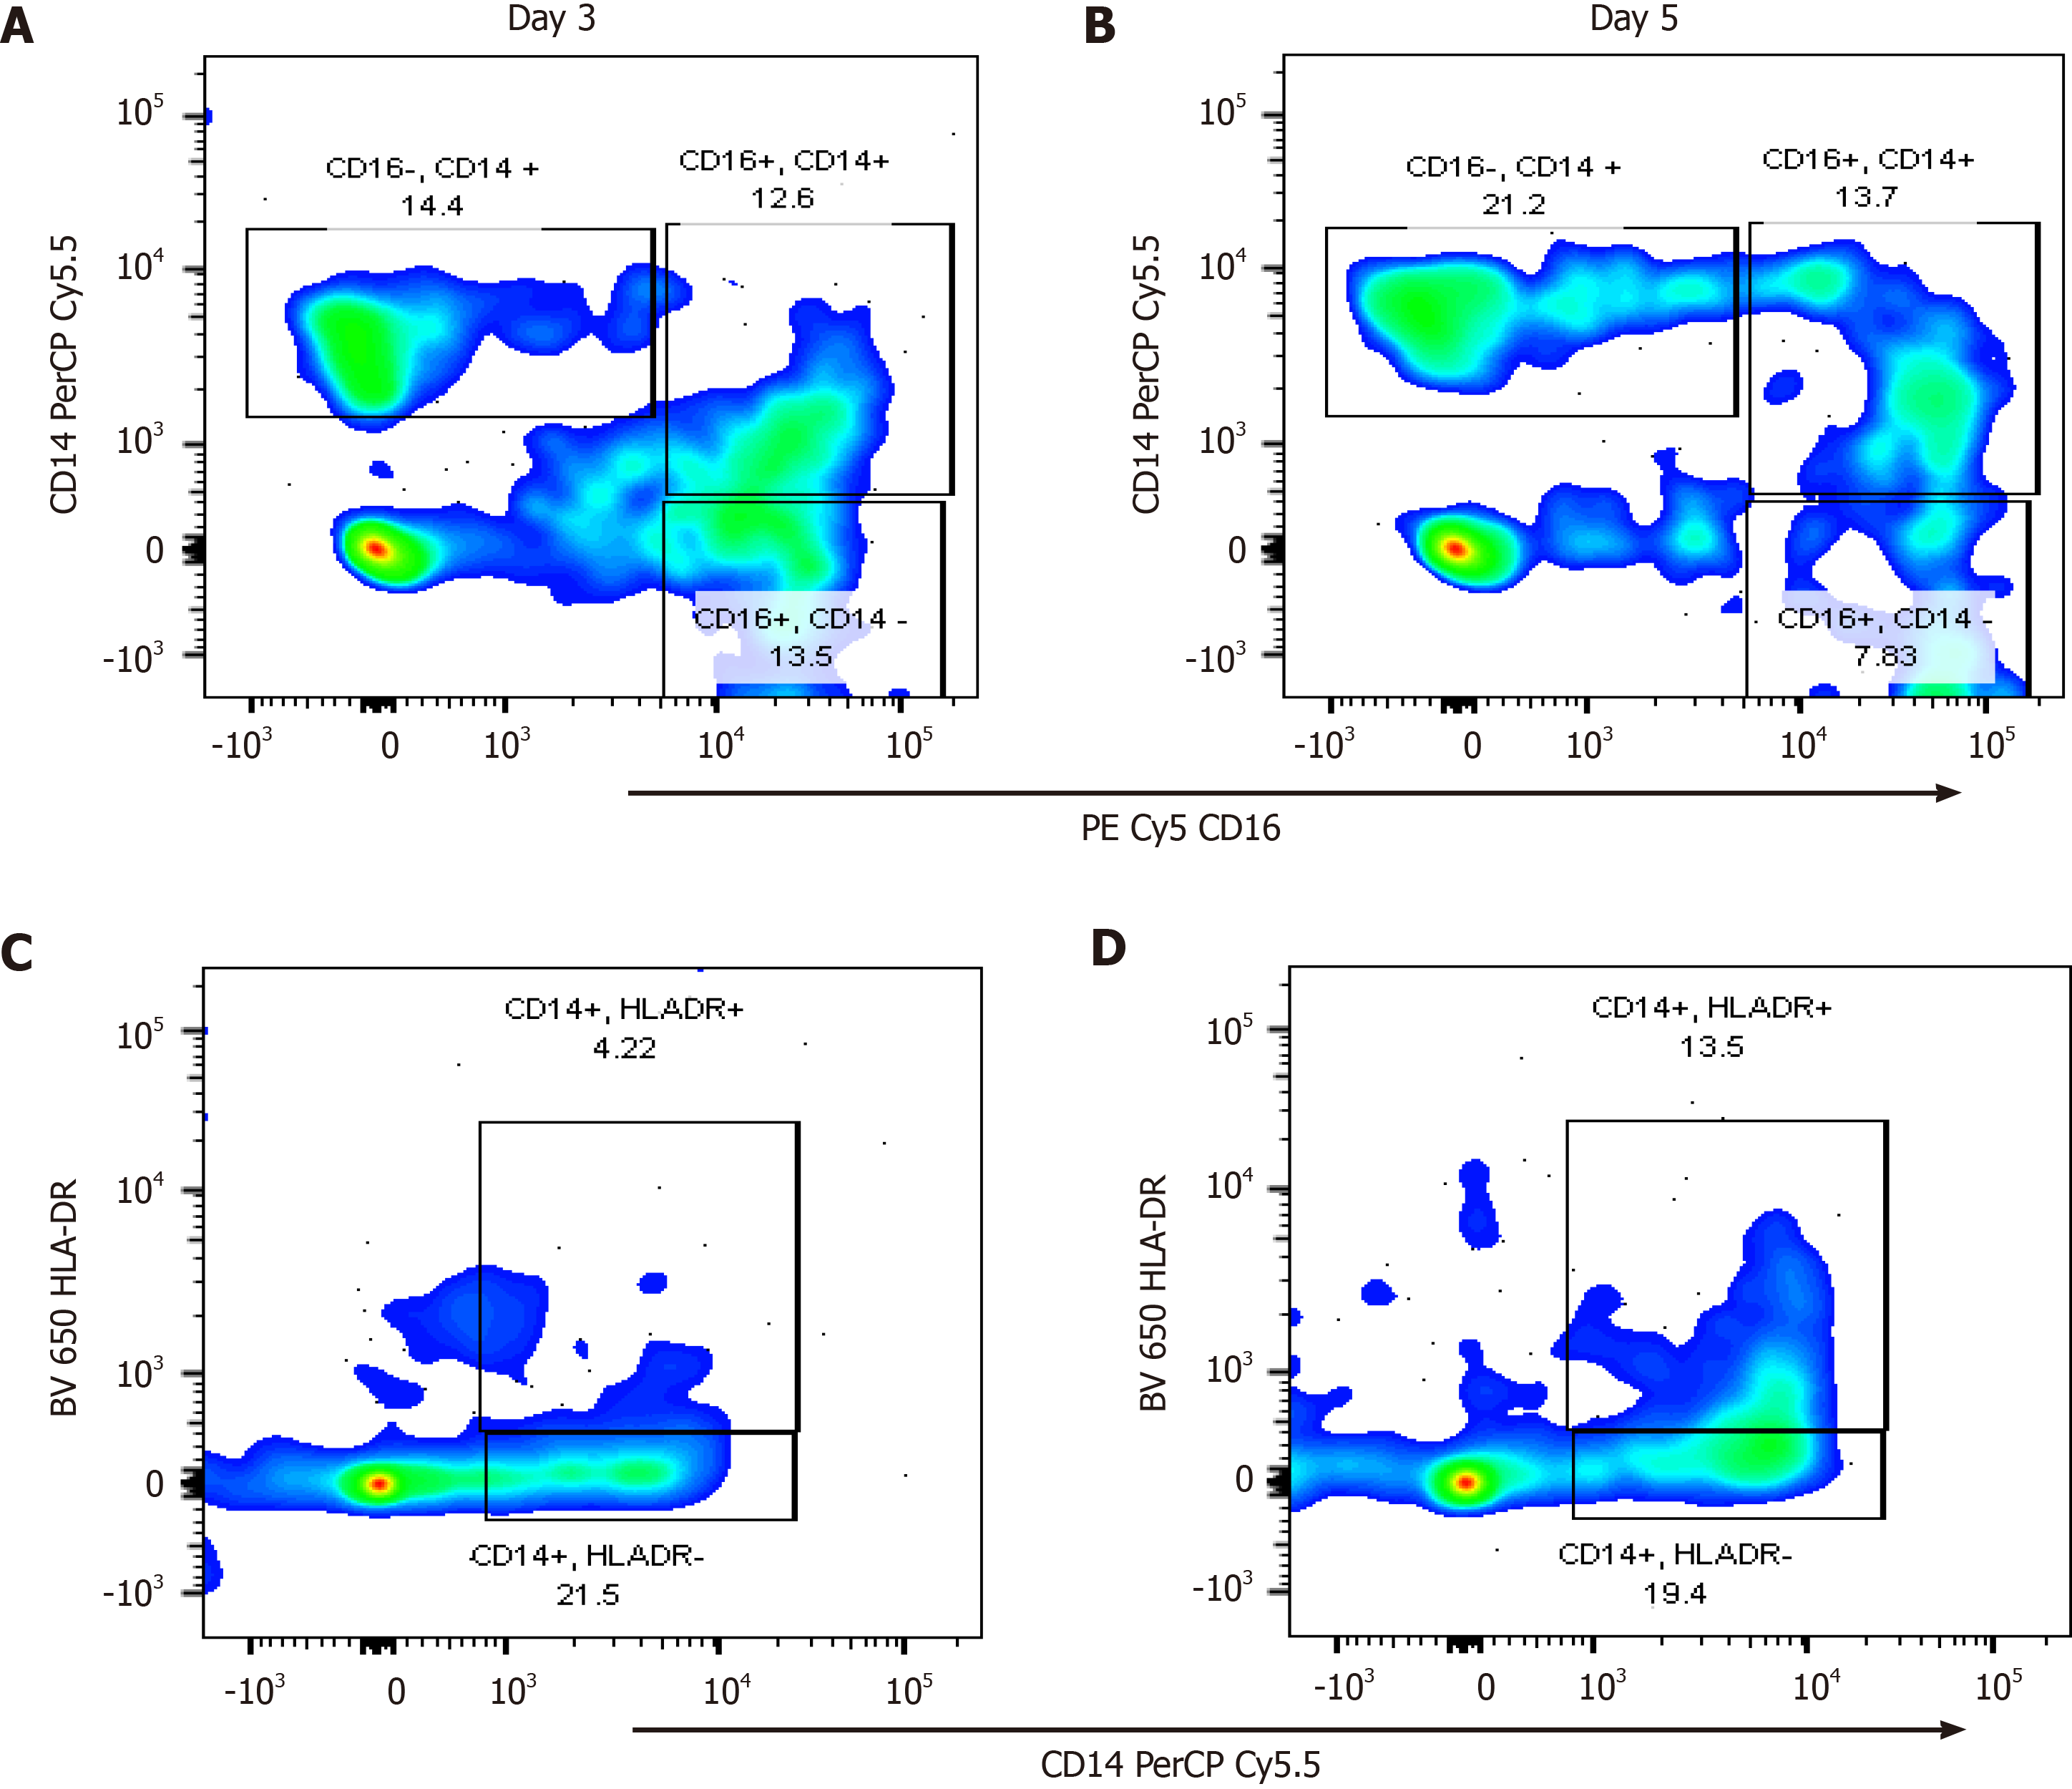
Figure 6 A plot generated from FlowJo™ version 10 (Oregon, United States) of an severe acute pancreatitis patient for the monocyte subpopulations.
Cells were gated into intermediate (CD16+CD14+), classical (CD16-CD14+) and non-classical monocytes (CD16+CD14-). A and B: They showed CD14CD16 plot for Day 3 and Day 5 respectively. C and D: They showed a plot of CD14HLA-DR for Day 3 and 5 respectively. The percentage of HLA-DR+ monocytes increased from 4% on Day 3 to 13% on Day 5. BUV: BD Horizon Brilliant™ Ultraviolet; CD: Cluster of differentiation; Cy: Cyanine; BV: Brilliant Violet™; HLA DR: Human leukocyte D related; PE: Phycoerythrin; PerCP: Peridinin-Chlorophyll-protein; CD: Cluster of differentiation.
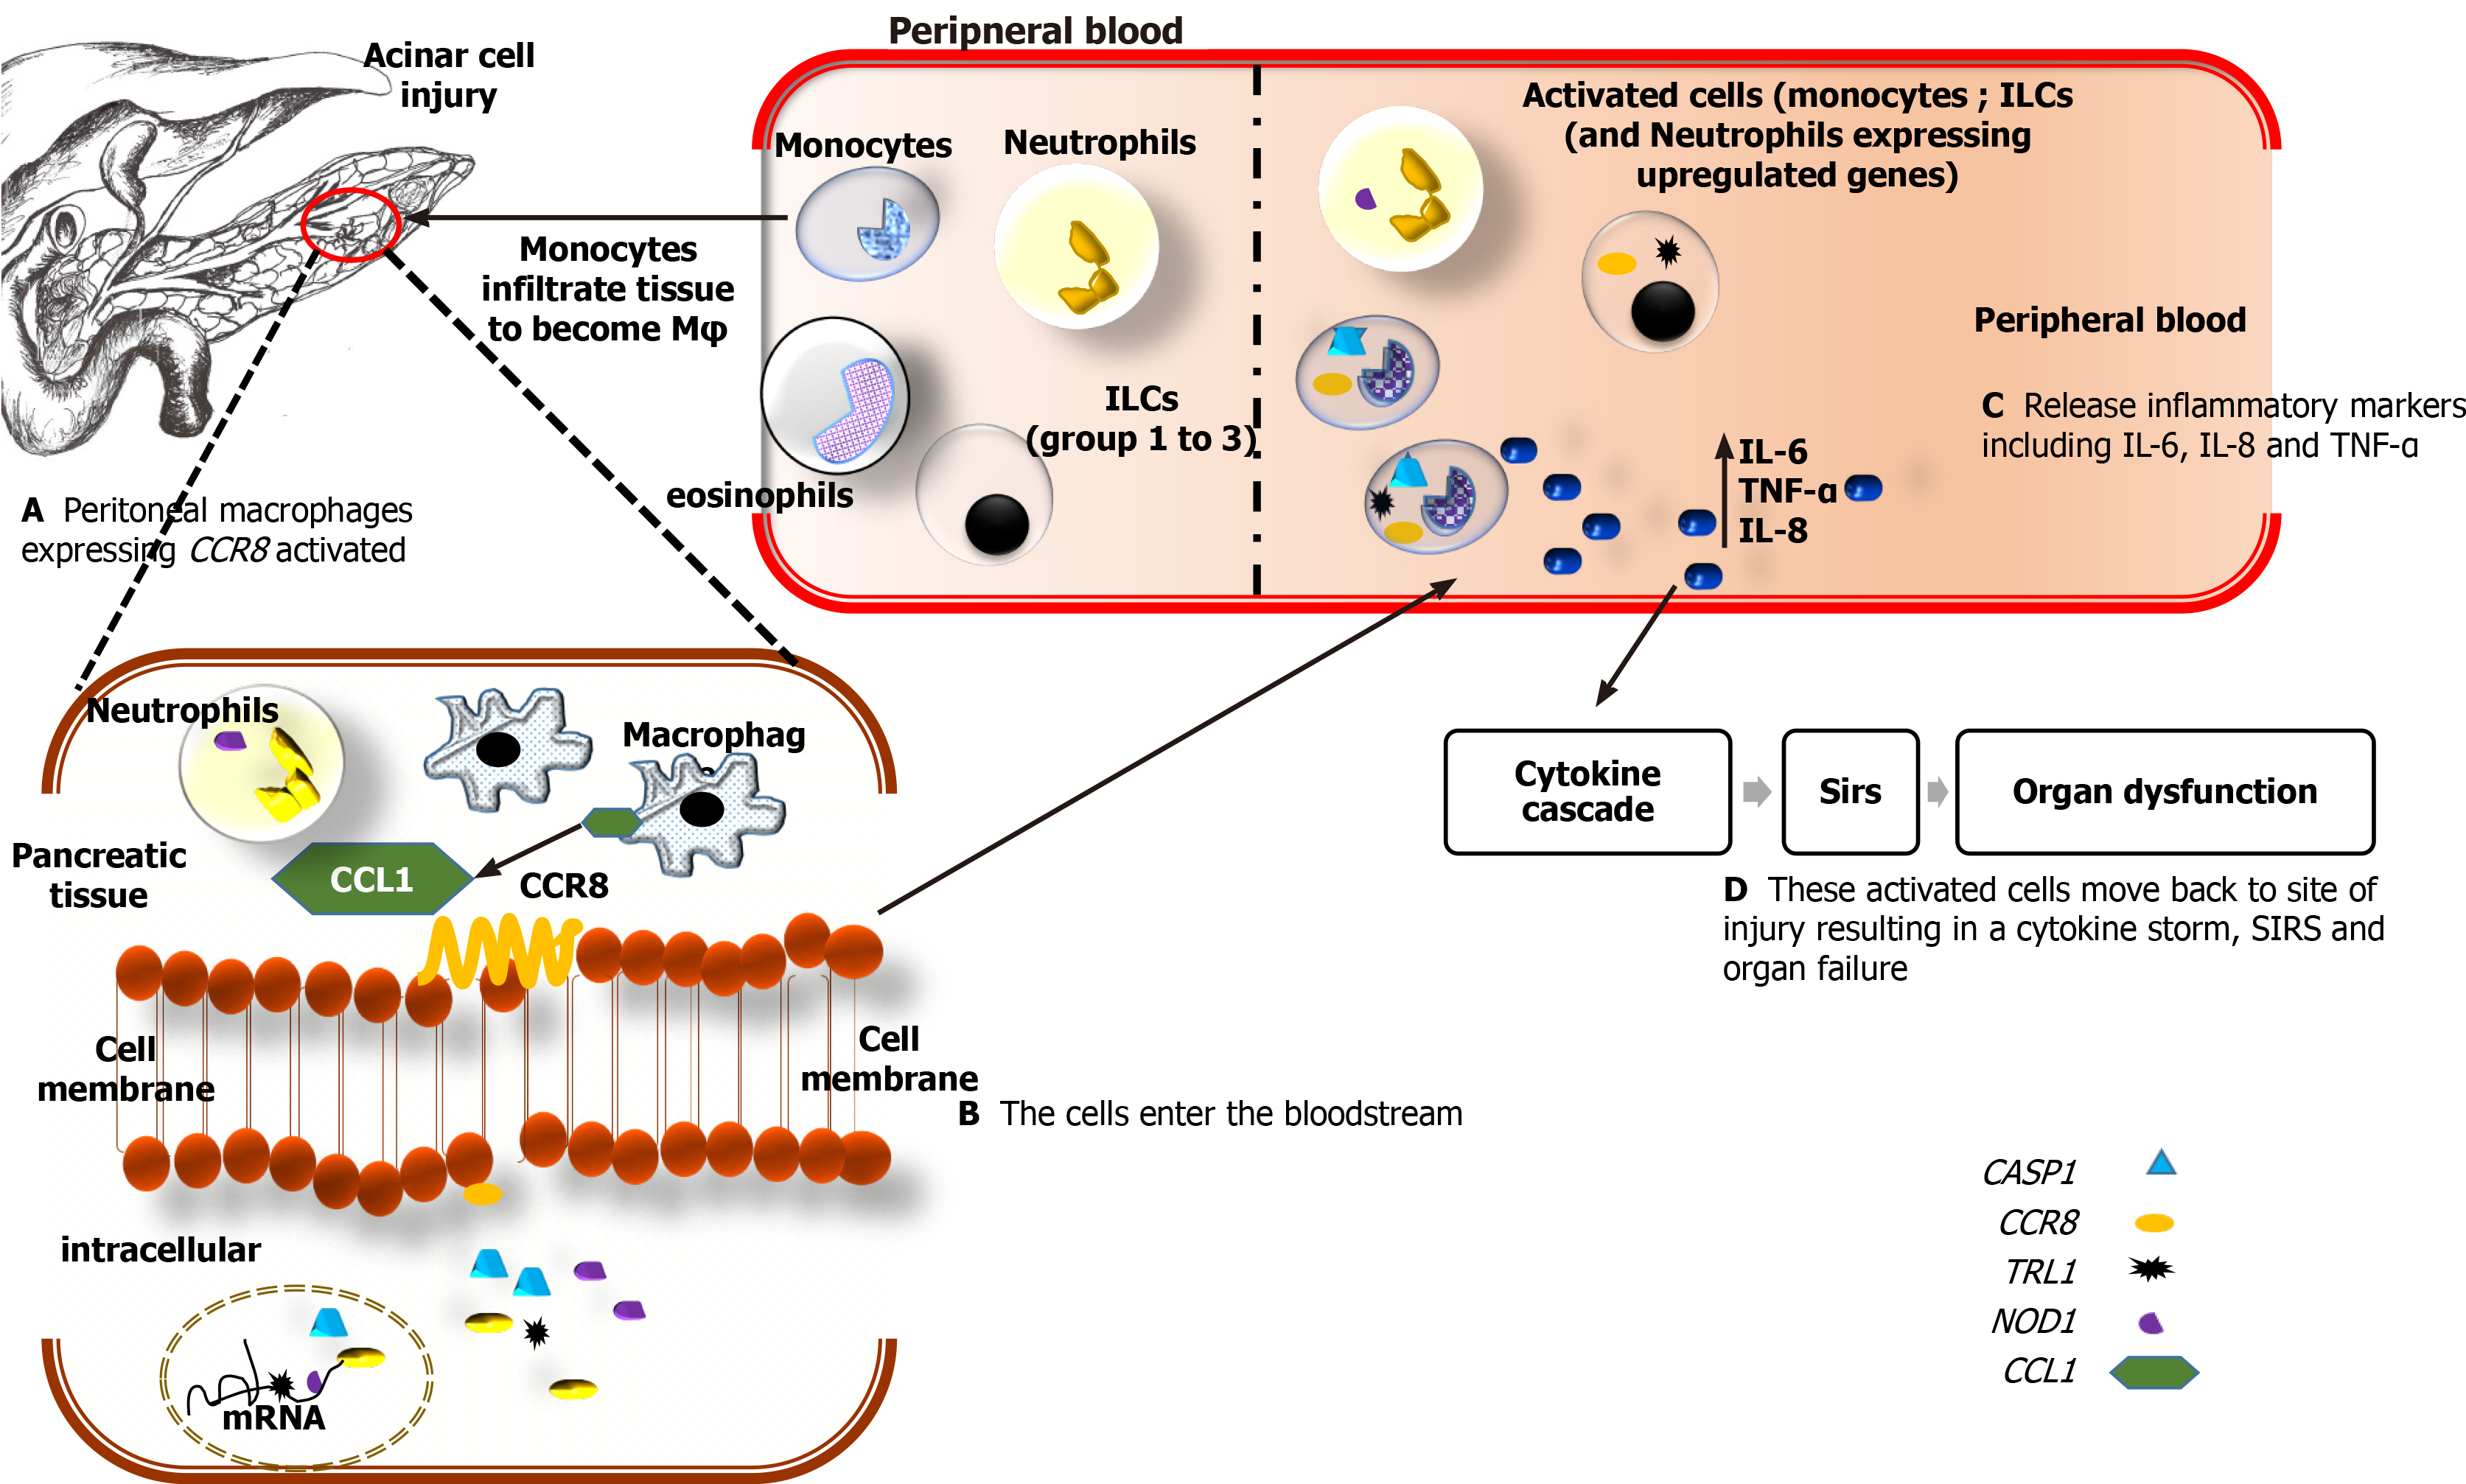
Figure 7 The schematic shows the possible mechanism by which chemokine receptor 8 is upregulated in peripheral blood.
A: Upon elevation of trypsin in the pancreas due to acinar cell injury in patients with acute pancreatitis, monocytes, lymphoid cell groups (ILCs), neutrophils and eosinophils migrate to the site of injury. Once in the pancreatic tissue, the monocytes become activated to macrophages (φ) which then express the chemokine (C-C motif) ligand 1 (CCL1) gene. The CCL1 binds in turn binds to the chemokine receptor 8 (CCR8) receptor on the surface of macrophages, ILC2 cells, and neutrophils. In patients with MSAP, ILC2 related cytokines, interleukin-4 (IL-4), IL-5, and IL-13 are upregulated while downregulation of these cytokines was observed in SAP patients (Supplementary Table 3). The observed increases in CCR8 in the SAP patients may be due to excessive activation of macrophages and monocytes. The activated cells (ILCs, neutrophils, monocytes) may be releasing IL-1-β, tumor necrosis factor alpha (TNF-α), IL-6 at local sites, which send signals that activate and recruit inflammatory cells which include macrophages, neutrophils, ILC2, and ILC3; B-D: These cells migrate into the bloodstream and will express Toll-like receptor 1, Nucleotide-binding oligomerization domain, caspase 1 genes. These genes are mainly expressed on monocytes that will release proinflammatory cytokines such as IL-6, IL-8, and TNF-α and, depending on their levels in the peripheral blood, will cause dysregulation that leads to a systemic inflammatory response and consequently single or multiple organ failure. IL: Interleukin; CASP1: Caspase 1, apoptosis-related cysteine peptidase; CCR8: Chemokine receptor 8; TRL1: Toll-like receptor-1; NOD1: Nucleotide-binding oligomerization domain-containing protein 1; CCL1: Chemokine ligand 1; TNF-α: Tumor necrosis factor alpha.
- Citation: Nalisa M, Nweke EE, Smith MD, Omoshoro-Jones J, Devar JW, Metzger R, Augustine TN, Fru PN. Chemokine receptor 8 expression may be linked to disease severity and elevated interleukin 6 secretion in acute pancreatitis. World J Gastrointest Pathophysiol 2021; 12(6): 115-133
- URL: https://www.wjgnet.com/2150-5330/full/v12/i6/115.htm
- DOI: https://dx.doi.org/10.4291/wjgp.v12.i6.115


