©The Author(s) 2021.
World J Gastrointest Pathophysiol. Jan 22, 2021; 12(1): 1-13
Published online Jan 22, 2021. doi: 10.4291/wjgp.v12.i1.1
Published online Jan 22, 2021. doi: 10.4291/wjgp.v12.i1.1
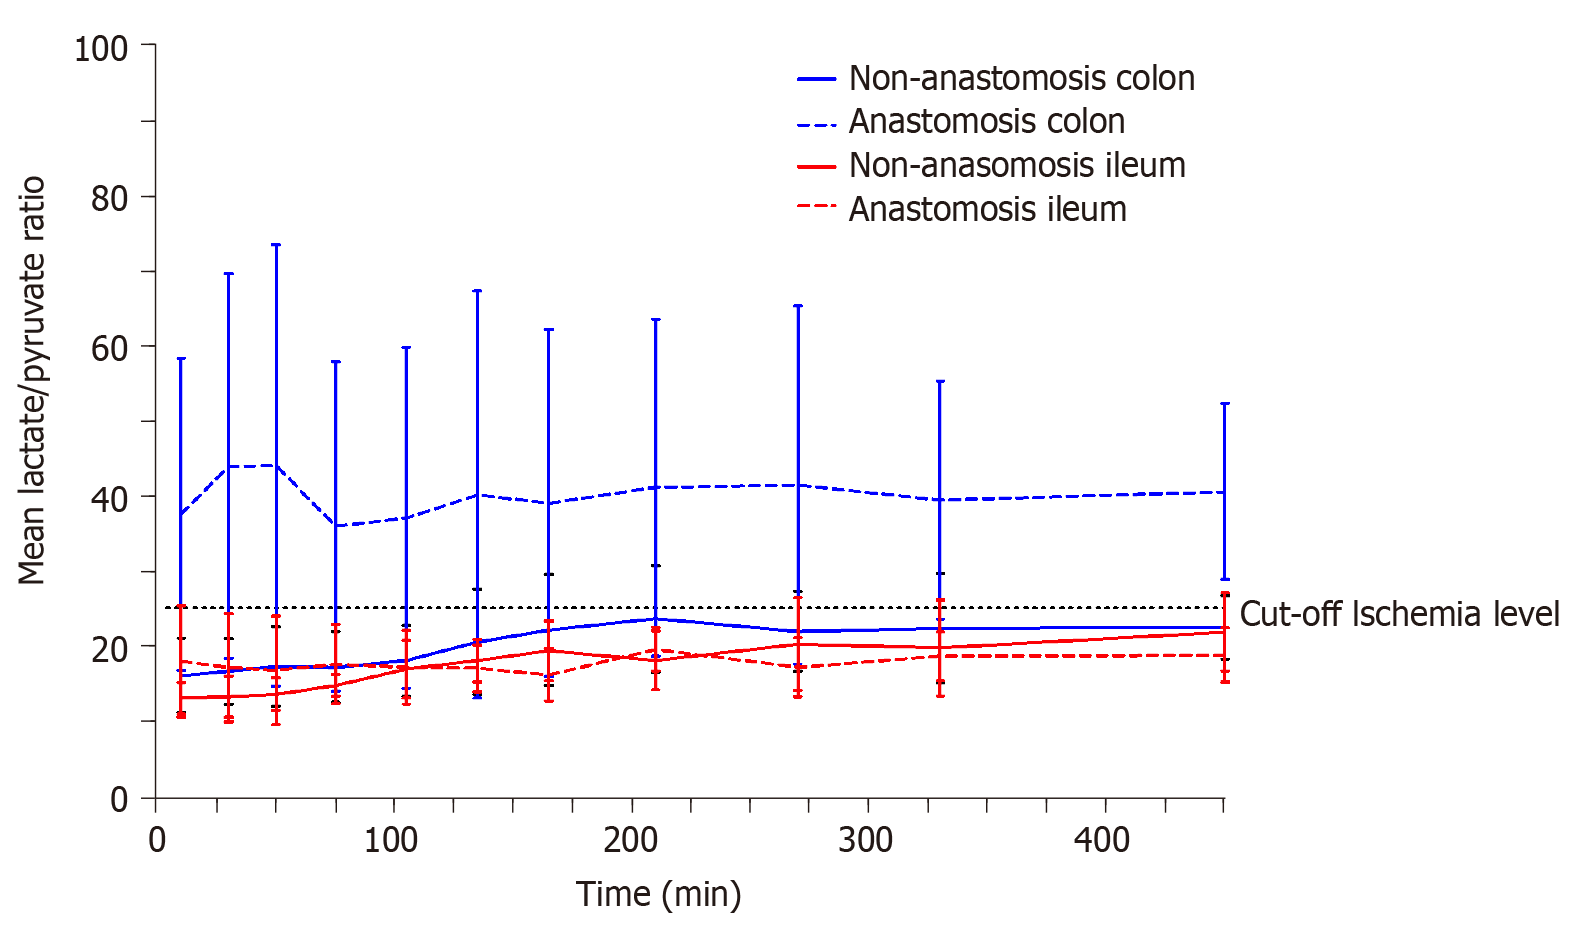
Figure 1 The mean lactate/pyruvate ratios for anastomosis and non-anastomosis ileum and colon.
The ischemic cut-off of 25 is marked with a dotted line. Bars represent 95% confidence interval.
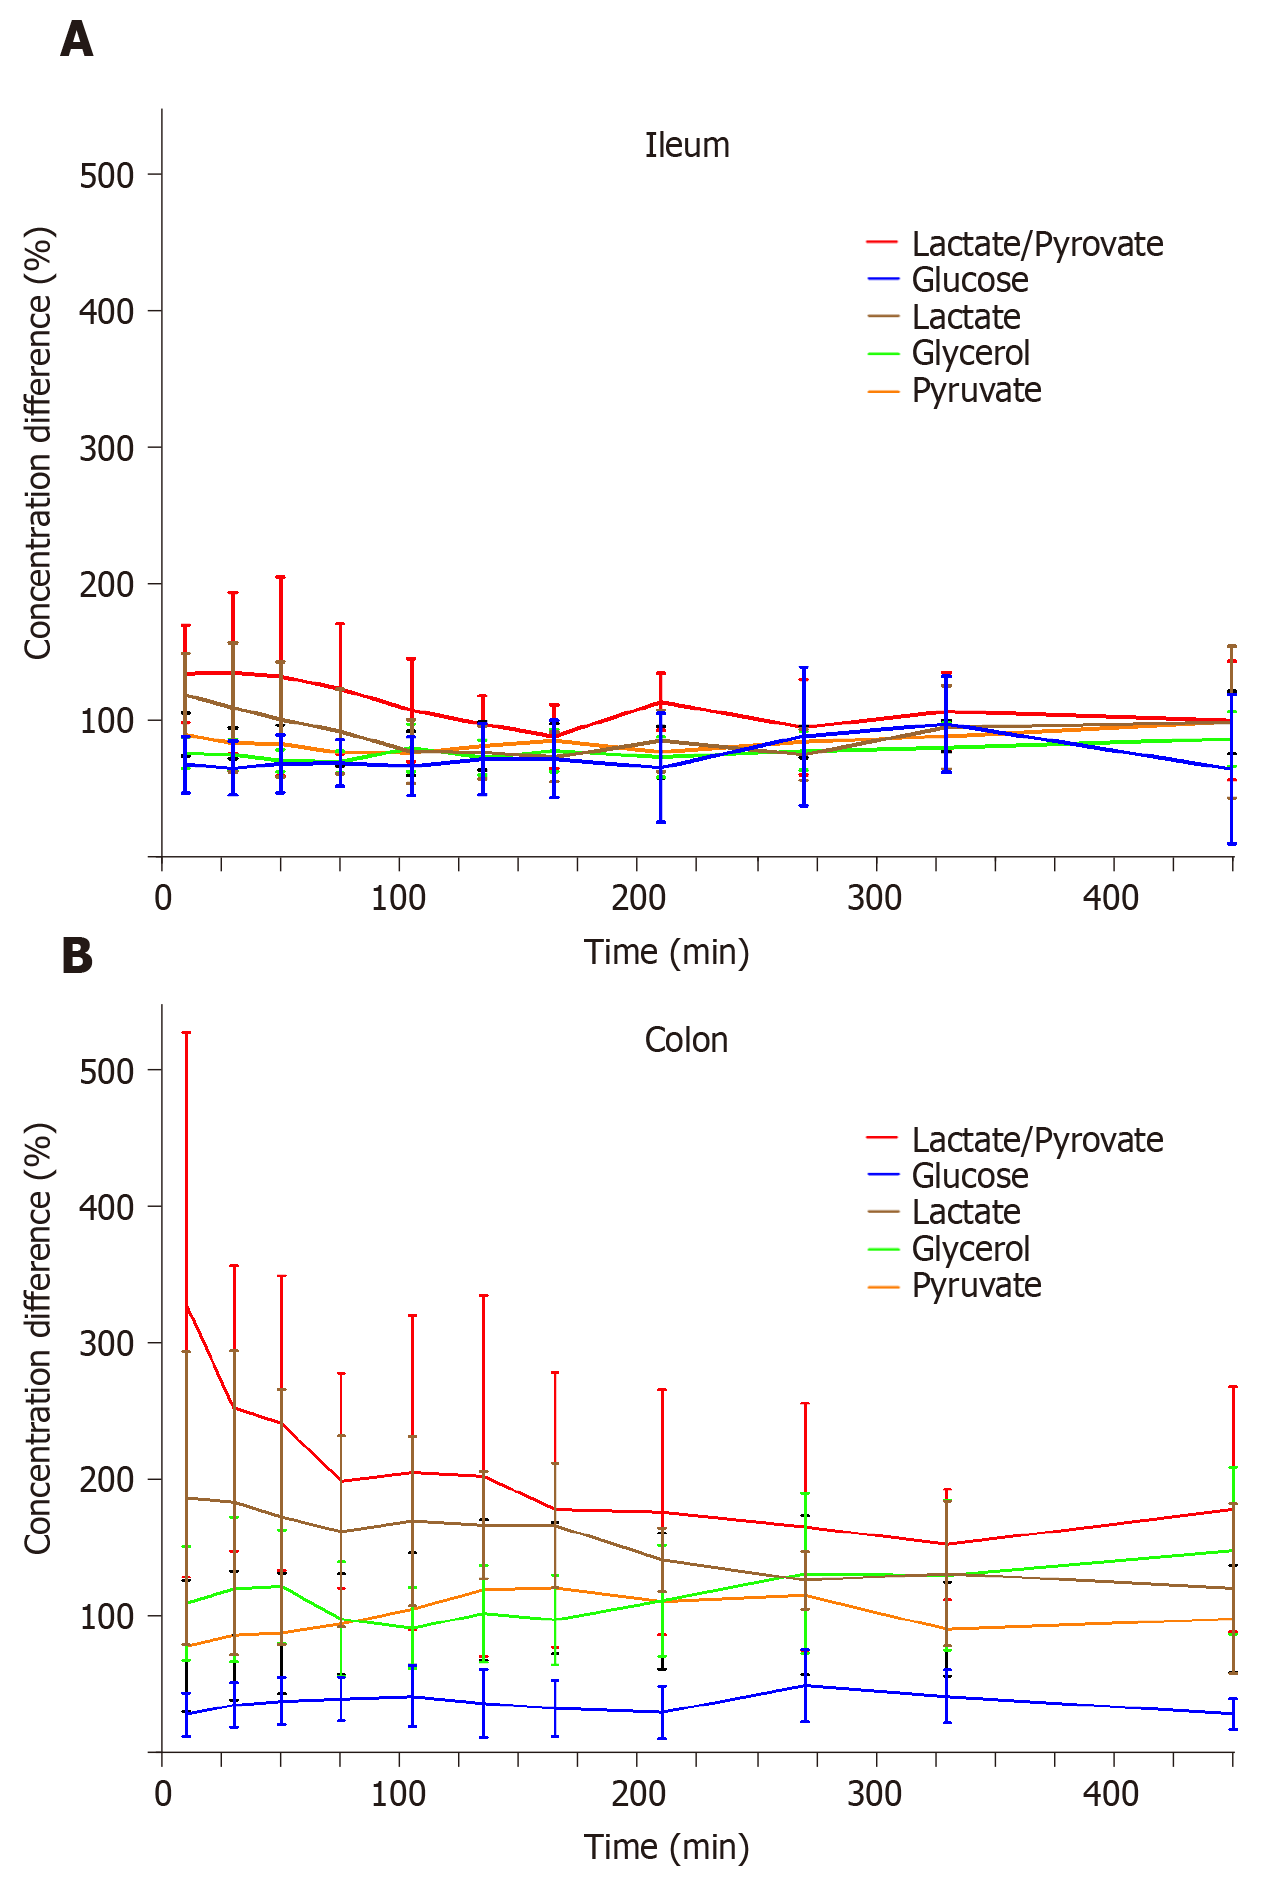
Figure 2 The mean ischemic metabolite concentration differences (%) between anastomosis and non-anastomosis (anastomosis/non-anastomosis) ileum and colon.
Bars represent 95% confidence interval. MIC: Minimal inhibitory concentration.
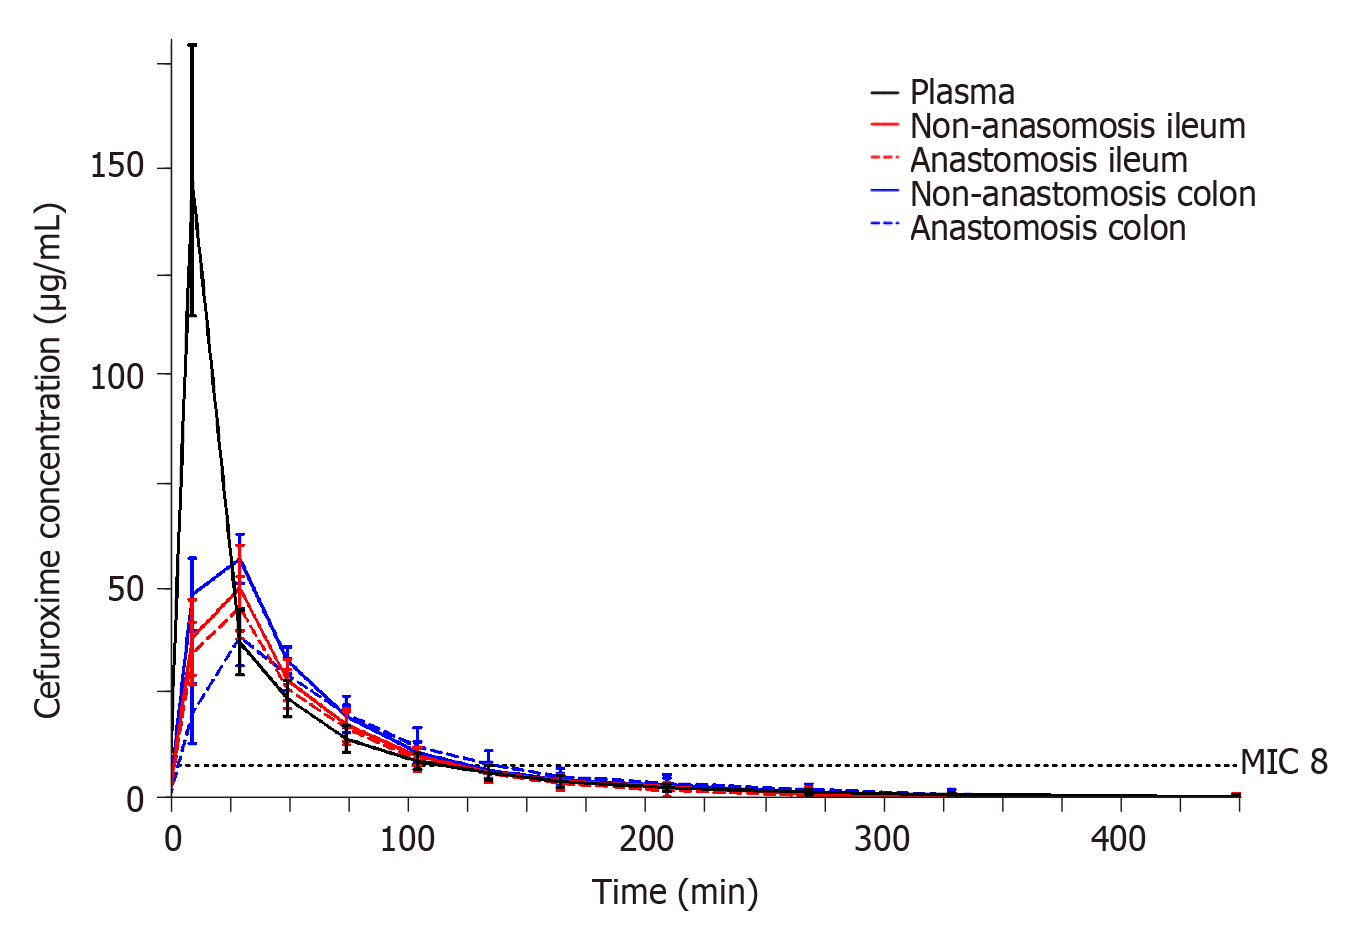
Figure 3 Mean cefuroxime concentration-time profiles for anastomosis and non-anastomosis ileum and colon.
The dotted line represents the cefuroxime clinical breakpoint minimal inhibitory concentration for Escherichia coli (8 µg/mL). Bars represent 95% confidence interval.
- Citation: Hanberg P, Bue M, Thomassen M, Løve US, Kipp JO, Harlev C, Petersen E, Søballe K, Stilling M. Influence of anastomoses on intestine ischemia and cefuroxime concentrations: Evaluated in the ileum and colon in a porcine model. World J Gastrointest Pathophysiol 2021; 12(1): 1-13
- URL: https://www.wjgnet.com/2150-5330/full/v12/i1/1.htm
- DOI: https://dx.doi.org/10.4291/wjgp.v12.i1.1


