INTRODUCTION
Diffusion-weighted magnetic resonance imaging (DWI) is a quantitative magnetic resonance imaging (MRI) technique that uses gradient pulses to detect and measure the diffusion of water molecules in tissues, which is quantified as the apparent diffusion coefficient (ADC). DWI is applicable across various organs, in both tumor and nontumor environments, to qualitatively and quantitatively assess various pathological conditions[1]. Currently, the single-shot echo-planar imaging (SS-EPI) sequence is among the most commonly used DWI acquisition techniques in clinical practice; it offers a rapid acquisition speed, thus reducing motion artefacts and scanning time, but it is prone to magnetic susceptibility artefacts, leading to limited image spatial resolution. Readout-segmented EPI (Rs-EPI) DWI[2] and reduced field-of-view (rFOV) DWI[3,4], have improved spatial resolution in pancreatic DWI.
Initially, owing to the presence of artefacts and pitfalls, DWI was primarily focused on neuroimaging[5]. To date, advancements in hardware and software have enabled the extensive study of DWI in various clinical scenarios throughout the body, including identifying benign and malignant lesions, distinguishing different types of malignant tumors, and evaluating treatment response[6,7]. The Quantitative Imaging Biomarker Alliance (QIBA) has been striving to standardize quantitative imaging biomarkers for both clinical trials and practice[8] and has provided valuable insights into the acceptable levels of variance for the ADC. This knowledge is crucial for fully leveraging the ADC as a quantitative imaging metric for lesions in the head (8%), liver (27%), breast (27%), and prostate (15%)[9]. However, DWI has certain limitations in pancreatic imaging. Challenges in obtaining high-quality DWI arise from factors such as motion artefacts caused by respiration, peristalsis, and blood flow. Therefore, recognizing and addressing these limitations in pancreatic applications is essential to ensure that DWI can play an optimal role in the diagnosis and assessment of pancreatic diseases. Additionally, artificial intelligence plays an important role in DWI data analysis, increasing the accuracy and efficiency of quantitative assessments.
In this study, we review the acquisition technology of DWI and the application of commonly used postprocessing models in the pancreas and introduce some complex models and deep learning in DWI postprocessing to highlight their potential applications in pancreatic diseases. In conducting this review, we primarily adopted a narrative approach, while also incorporating quantitative data from previous studies. This information pertained to the application of DWI in the pancreas, including specific scanning settings and its role in the diagnosis of pancreatic diseases.
BASIC PRINCIPLES OF DWI
DWI sequences
SS-EPI is widely recognized as the preferred method for integrating DWI with fat-suppression techniques[10]. To minimize the influence of motion artefacts, both breath-hold and free-breathing technologies are utilized alongside diverse signal acquisition strategies, which may include respiratory and/or cardiac triggering. Free-breathing sequences, in particular, provide a superior signal-to-noise ratio (SNR) and accommodate a broader range of b values than the breath-hold sequences do.
Rs-EPI, a powerful imaging technique, is a multishot sequence that has been utilized in some anatomical regions, including the brain[11], breasts[12,13], prostate[14], kidneys[15] and joints[16]. Rs-EPI significantly mitigates susceptibility artefacts and T2 decay-induced blurring, thereby enhancing the quality of DWI images and the reliability of quantitative parameters. However, the prolonged acquisition time may limit its clinical utility. Advancements in imaging technology have led to the development of rFOV-DWI as an innovative solution. This technique offers improved image quality, superior tissue resolution, and a substantial reduction in artefacts and distortion[4,17]. Therefore, this method presents a promising solution for addressing the constraints associated with conventional full-FOV DWI. rFOV-DWI leverages 2D RF along with 180° pulse-back technology to minimize the signal loss resulting from the uneven B1 field distribution in the pancreatic region[17]. This approach effectively overcomes resolution challenges while increasing the quality of pancreatic images. In contrast to the multishot techniques aimed at improving DWI clarity and reducing image distortion, rFOV-DWI avoids complex reconstruction processes[18,19]. However, its limitation lies in the small field-of-view (FOV), which may hinder the evaluation of areas beyond the imaging FOV, such as the peripancreatic lymph node status.
Parameters for DWI
In DWI, an important parameter known as the b value, also known as the diffusion factor, represents the sensitivity of the sequence to diffusion motion and serves as an indicator for detecting the ability to capture diffusion motion. The b value is defined as follows: 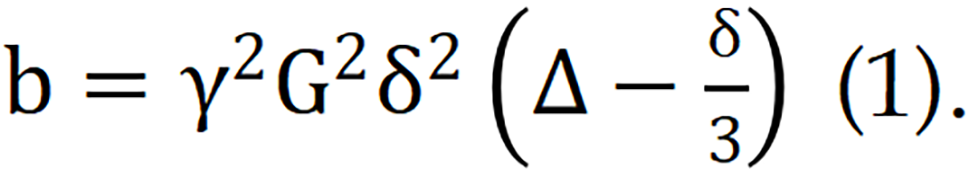 Where G represents the magnitude of the diffusion gradient, δ denotes the duration for which the gradient is applied, and Δ signifies the time interval between two diffusion gradients. Given the physical constraints on the maximum achievable diffusion gradient, the value of G is subject to an upper limit. Consequently, when G reaches its maximum, the b value can be increased only by adjusting either δ or Δ.
The magnitude of the b value of DWI significantly affects image quality and lesion detection. Therefore, the selection of appropriate b values tailored to specific anatomical regions is crucial for accurate lesion evaluation. In abdominal DWI, the commonly utilized ranges for low and high b values are typically between 0 and 100 s/mm² and between 500 and 1500 s/mm², respectively. DWI with high b values tends to reflect restricted diffusion and thus increases the detectability of lesions in images. Koc et al[20] reported that a high b value of 600 s/mm2 on 1.5-T MRI was optimal for distinguishing between benign and malignant lesions in the abdomen. Specifically for the pancreas, Fukukura et al[21] demonstrated that increasing the b value from 500 s/mm2 to 1500 s/mm2 on 3.0-T MRI can improve the visibility of pancreatic adenocarcinoma. This improvement is attributed to the reduction in the signal from the distal pancreas, whereas the signal from pancreatic adenocarcinoma remains significantly elevated. However, increasing the b value beyond 2000 s/mm² can decrease the image quality. This decrease is attributed to the fact that while higher b values can augment contrast, they also reduce the SNR and increase the susceptibility to artefacts.
DWI models
Numerous models are available for the quantitative assessment of the pancreas via DWI, including the monoexponential model, intravoxel incoherent motion (IVIM), stretched exponential model (SEM), diffusion kurtosis imaging (DKI) model, and many others. The most commonly used models for quantitative assessment involve calculating the ADC via a monoexponential model and estimating the derived parameters from the IVIM, which is based on biexponential analyses[22]. The fitting equations for these two models are as follows: Monoexponential model:
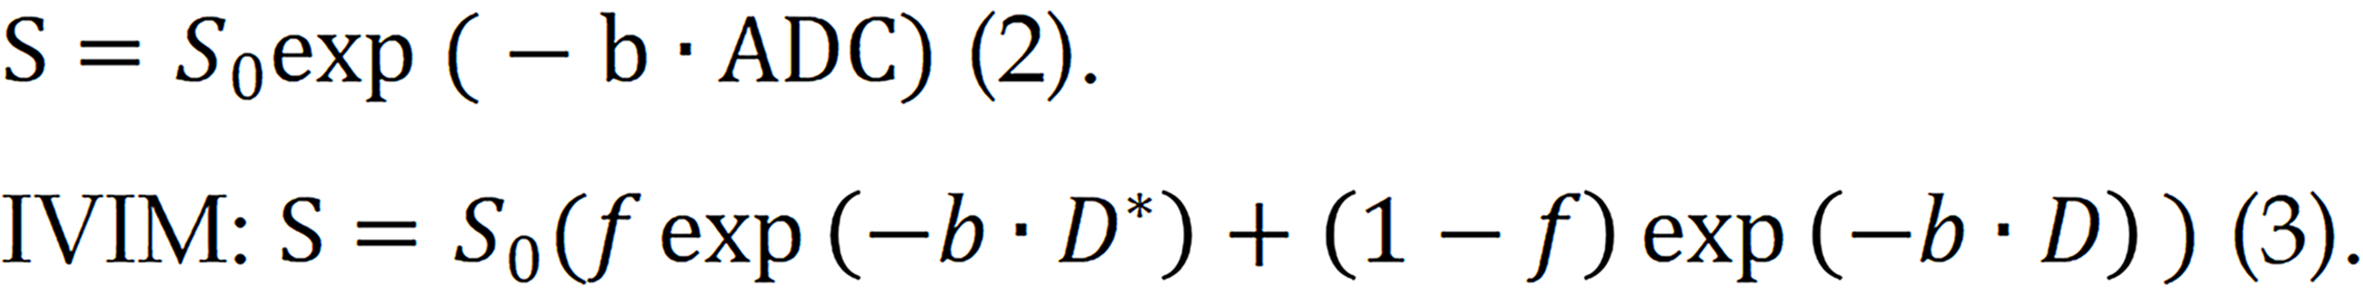
In the IVIM model, three main parameters are quantified. D* represents the perfusion information, also known as the perfusion coefficient, which mainly represents the contribution of perfusion to the attenuation of the diffusion image signal. D reflects the true diffusion information, also known as the actual diffusion coefficient, which mainly represents the contribution of true diffusion to the attenuation of the diffusion image signal, and f is the perfusion fraction, reflecting the proportion of perfusion.
SEM, proposed by Bennett et al[23], is a model that can simultaneously quantify water molecule diffusion capability and voxel heterogeneity[24]. Compared with the traditional exponential decay model, SEM can better describe complex diffusion processes and tissue heterogeneity. The equation for the SEM is shown in formula (4):

The DKI model can be used to quantify the degree of deviation from the Gaussian distribution[25]. Formula (5) can be used to obtain the diffusion kurtosis coefficient (K). K represents the deviation of the diffusion behaviour from the Gaussian model and the degree of tissue structure confinement and heterogeneity in the tissue composition. The diffusion coefficient (D) is used to correct for non-Gaussian bias.
These models have been proposed for exploring the microstructural characteristics of tissues and investigating disease diagnosis and efficacy evaluation. Furthermore, with the rapid progression of deep learning technologies, the incorporation of deep neural networks (DNNs) into these foundational models improves the precision of quantitative parameter estimation. As a result, we can more comprehensively understand the pancreatic microenvironment and design more efficacious strategies for disease diagnosis and treatment by leveraging deep learning techniques to analyze DWI data.
APPLICATION OF DWI IN PANCREATIC DISEASES
DWI contrast is related to tissue cellularity, tissue structure, and cell membrane integrity. The use of the ADC map in differentiating and diagnosing various pancreatic diseases has been reported. Abuzeid et al[26] measured the average pancreatic ADC values in a small sample of acute pancreatitis patients and healthy controls. They reported that the optimal ADC threshold for distinguishing between the two groups was 1.32 × 10⁻³ mm2/s, with a sensitivity of 81.25%, a specificity of 93.75%, and an accuracy of 91.8%. Several studies evaluating chronic pancreatitis (CP) have reported that the ADC values in patients with CP are lower than those in healthy controls[27,28]. Therefore, DWI can serve as an adjunctive tool for diagnosing pancreatitis. Zhu et al[29] reported an ADC sensitivity of 83% in differentiating benign and malignant lesions, with a specificity of 87% and an area under the curve (AUC) of 0.92. Several studies have focused on the use of DWI to discriminate between autoimmune pancreatitis (AIP) and pancreatic ductal adenocarcinoma (PDAC). Given the overlapping clinical and radiological characteristics of mass-forming pancreatitis and PDAC, differentiating them is difficult. Nevertheless, a correct diagnosis is important because the treatment and prognosis of these two diseases significantly differ[30]. Several studies[31-35] have reported ADC cut-off values ranging from 0.88 to 1.26 × 10⁻³ mm2/s for differentiating between mass-forming pancreatitis and PDAC. However, Ha et al[36] reported that the ADC was ineffective in differentiating PDAC from mass-forming pancreatitis, and a comparison of ADCs for mass-forming pancreatitis and PDAC in different studies led to conflicting conclusions. Therefore, more advanced models may be needed to further investigate. In a study by De Robertis et al[37], the perfusion fraction (f) led to 100% sensitivity in distinguishing PDAC tissue from normal pancreas tissue and AIP tissue from normal pancreatic tissue. Zeng et al[38] measured IVIM parameters, correlated them with histopathological data, and achieved superior performance in differentiating nonhypervascular pancreatic neuroendocrine tumors (PNETs) and PDAC. Notably, D was found to be more effective than both the ADC and the perfusion fraction f. Additionally, the ADC has been consistently shown to be significantly correlated with tissue-determined pancreatic fibrosis[39-41]. DWI and corresponding ADC maps of the normal pancreas and nine representative pancreatic pathologies are shown in Figure 1.
Figure 1 Diffusion-weighted imaging and corresponding apparent diffusion coefficient maps of the normal pancreas and nine representative pancreatic pathologies, acquired on a 3.0-T system with b-values of 50 and 800 s/mm2.
AP: Acute pancreatitis; CP: Chronic pancreatitis; AIP: Autoimmune pancreatitis; NET: Neuroendocrine tumor; PDAC: Pancreatic ductal adenocarcinoma; SPN: Solid-pseudopapillary neoplasm; SCN: Serous cystic neoplasm; MCN: Mucinous cystic neoplasms; IPMN: Intraductal papillary mucinous neoplasm; DWI: Diffusion-weighted magnetic resonance imaging; ADC: Apparent diffusion coefficient.
DWI can be used to differentiate between benign and malignant tissues, and numerous studies have demonstrated that the ADC and f measurements are the most precise parameters. IVIM employs a biexponential model to quantify the macroscopic diffusion of water and the microscopic perfusion of blood in capillaries. IVIM-DWI can provide more refined tissue characterization and improve the discrimination between benign and malignant tissues[42]. Significant progress has been made in the use of IVIM parameters in the early detection of CP[43], the prediction of the pathological grade of pancreatic cancer, the determination of lymph node metastasis, and the differentiation of various pancreatic diseases. Liu et al[44] explored the correlation between IVIM parameters and pancreatic fibrosis. Their findings indicated that the D and f values increased the sensitivity and diagnostic performance for grading PDAC. McCullum et al[45] employed histogram analysis of the median, standard deviation, skewness, kurtosis, and percentile to compare the parameter distributions of patients with pancreatic cancer before and after treatment response by using IVIM-WI. They reported that f and D changed substantially, whereas D* showed no significant correlation in any test. These results imply that the f and D parameters may be potential indicators for evaluating the treatment response of patients with pancreatic cancer. However, Zhu et al[29] systematically evaluated the ability of IVIM to distinguish between benign and malignant pancreatic lesions. They reported that IVIM exhibited high sensitivity and specificity (84% and 83%, respectively). The performance in terms of these values was comparable to the performance of the ADC values (83% and 87%, respectively). Multi-b-value IVIM also has challenges because of its high parameter variability and reproducibility, as well as its complexity and long acquisition times. Consequently, although the biexponential IVIM model has been extensively investigated, its routine application in diagnosing pancreatic diseases has not yet been established, and consensus on the selection of appropriate b values is lacking.
Research on the application of SEM in pancreatic DWI is limited. Currently, SEM is primarily used to differentiate between different types of pancreatic tumors. Shi et al[46] compared the correlations between different parameters via various methods and reported that α has significant potential in distinguishing PDAC from PNET, thus improving the diagnostic accuracy. Li et al[47] conducted a volume histogram analysis for each DWI parameter and compared the histogram indices obtained from different tumor parameters. They reported that volume histogram analysis of the SEM could be used to differentiate PDAC from PNET. However, the median f value obtained from IVIM DWI was more valuable than the ADC, Dp, DDC, and α values were. Therefore, SEM, with its ability to elucidate the intricate tissue characteristics and biological behaviour of pancreatic tumors, holds promise for refining early diagnostic procedures and optimizing therapeutic outcomes.
DKI was initially developed for neuroimaging research, which focused primarily on capturing microstructural information related to diffusion in the grey and white matter of the brain[48]. This technique examines the degree of diffusion restriction in tissue structures and the components of intra- and extracellular diffusion[49]. The typical b-value range for DKI is between 0 and 3000 mm2/s, with high b-values often falling within the range of 2000-3000 mm2/s[50]. As the application of DKI models continues to expand, their use for tumor characterization and grading has garnered significant interest. Tumor tissue is distinct from normal neural tissue, leading to variations in scanning protocols and significantly reduced acquisition times. Unlike neural tissues, which exhibit strong anisotropy and require multiple scanning directions or diffusion kurtosis tensor calculations, tumor tissues generally do not require such approaches. In many cases, the mean diffusion (MD) and mean kurtosis (MK) of tissues can be obtained in much shorter scanning times. DKI has been widely applied to various abdominal organs, including the prostate[51], kidney[52], and cervix[53], demonstrating greater clinical value than traditional DWI techniques do. In the field of pancreatic imaging, a study conducted by Granata et al[54] revealed that the MD can be used to effectively differentiate between pancreatic parenchyma, peritumoral inflammation, and pancreatic tumors. Furthermore, Mayer et al[55] suggested that the DKI-derived parameter D can serve as a noninvasive biomarker for evaluating the composition of stromal tissue in PDAC. In terms of treatment response evaluation, Granata et al[56] reported significant changes in the MD parameter obtained from DKI before and after electrochemotherapy in pancreatic cancer patients, and excellent diagnostic performance was achieved (sensitivity = 0.8, specificity = 1.0, AUC = 0.933). Zhang et al[57] assessed the efficacy of first-line chemotherapy in unresectable pancreatic cancer patients via DKI and reported that the MD (sensitivity = 85.7%, specificity = 85.7%, AUC = 0.898) outperformed the ADC in terms of diagnostic performance. These findings highlight the potential of DKI in characterizing pancreatic lesions, assessing treatment response, and improving diagnostic accuracy.
The variability of quantitative parameters is important when considering the application of DWI quantitative parameters. In accordance with the recommendations of the QIBA, the ADC variation threshold can be calculated using the following formula[8,9]: Scaled percent repeatability coefficient = 2.77 × weighted coefficient of variation (wCV) × 100%.
The wCV can be derived from previous studies, and computed using the reported sample size for each study as a weighted factor.
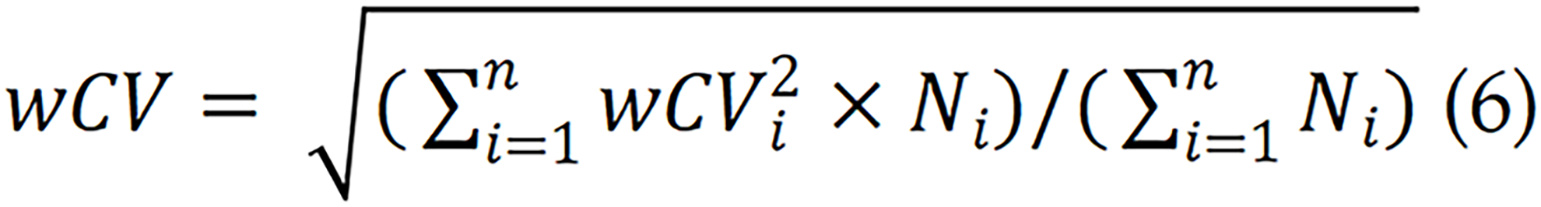
Here, wCVi represents the wCV from the ith article out of a total of n articles, and Ni denotes the sample size from the ith study. According to previous findings[58-60], the repeatability threshold for the ADC of the normal pancreas is 37% (38%, 35% and 37% for the head, neck and tail of the pancreas, respectively) for test-retest scans. However, relevant research data for pancreatic tumors are scarce. Therefore, determining the repeatability threshold for the ADC of pancreatic tumors and other quantitative parameters requires further investigation.
DEEP LEARNING IN DWI DATA ANALYSES
The emergence of deep learning has led to significant advancements in the field of medical imaging. Researchers have successfully applied DNNs to fit IVIM, as exemplified by the work of Barbieri et al[61]. By employing unsupervised learning training with DNNs, they generated more detailed parameter maps, reduced noise levels, and accelerated generation speeds compared with conventional methods, such as the least squares trust region algorithm and Bayesian probability-based IVIM fitting. Another noteworthy development by Kaandorp et al[62] involved the utilization of unsupervised physics-informed DNNs (PI-DNNs) for IVIM modelling. By incorporating the consistency between IVIM predictions and measured signals as a loss term in DNNs, they were able to train the unsupervised PI-DNN directly on patient data without the need for ground truth. This approach resulted in the successful development and training of IVIM-NET, a method that can accurately and independently predict IVIM parameters in patients with PDAC[63,64]. Building upon this groundwork, Troelstra et al[65] developed an unsupervised PI-DNN known as IVIM-NET, which is based on a triple-exponential IVIM. They evaluated the performance of this model in the context of nonalcoholic fatty liver disease and revealed a strong correlation with histopathology. The performance of this model surpassed that of traditional least-squares methods. Shi et al[66] combined diffusion-weighted (DW) images with convolutional neural networks (CNNs) to transform multi-b-value DW images into histogram arrays, which were subsequently employed as inputs for a 2D CNN model. This approach enables the differentiation of various pancreatic tumor types, including PDAC, PNET, and solid pseudopapillary neoplasm. These studies collectively highlight the profound benefits of integrating deep learning networks into DWI modelling, facilitating more precise and efficient analysis of medical images while improving our understanding and diagnostic capabilities across a range of diseases.
DIFFUSION-RELAXATION DWI
Although basic DWI models have been widely used in the clinical monitoring of diseases, they provide limited microstructural information[67,68]. To improve disease diagnosis, researchers have employed hybrid multidimensional MRI techniques to acquire specific parameter maps, which are feasible in terms of imaging time and image quality for the clinical application of abdominal organs. Furthermore, the maps derived from hybrid multidimensional MRI could be used to quantify the histological compartments of tumors. In several studies on prostate and other abdominal organ cancers[69-73], the combination of T2-weighted imaging with DWI data has been shown to increase diagnostic accuracy[74,75]. This method has demonstrated an overall sensitivity of 76% and a specificity of 82% in prostate cancer detection[76]. Zhang et al[72] utilized ex vivo diffusion relaxation correlation spectroscopic imaging (DR-CSI)[77] to quantify T2 relaxation and diffusion (T2-D) component spectra, which constitute the entire MRI signal in each voxel. By integrating the T2-D spectral peaks on a voxel basis, they generated signalling component fraction maps, characterizing the application value of DR-CSI in the compartmental quantification of ex vivo prostate specimens from prostate cancer patients. DR-CSI employs an improved two-dimensional ss-EPI sequence, simulating the sum of continuous exponential decay functions for each MRI signal voxel by acquiring multiple echo times and corresponding b values. This process enables the characterization of T2 and D as follows:

Where S (x, y, TE, b) represents the measured signal in the voxel for each TE-b data point, while ω (x, y, T2, D) represents the T2-D spectrum to be reconstructed for the voxel. The Laplace transform is denoted by L. To solve for ω (x, y, T2, D), a nonnegativity constraint and a regularization term are applied.

Each peak in the T2-D spectrum represents a separate signalling component, allowing for the calculation of signalling component fractions in voxels or spatial regions.
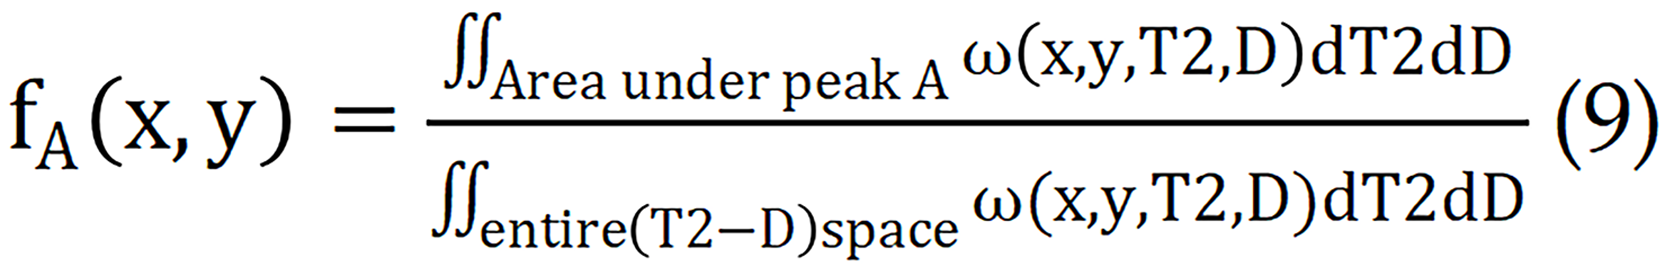
Currently, this technique has been extensively studied for organs such as the kidney[78], liver[79], and cervix[80]. In clinic, multi-TE and multi-b value data associated with each voxel can be obtained. The following equation is subsequently used to calculate the tissue composition volumes in each voxel.

Where i = 1, ..., N and represents the position of the ith voxel. P indicates the number of combinations of b, and TE ωq denotes the density normalization factor associated with the Riemann sum. S represents the signal intensity corresponding to different combinations of TEs and b values, whereas S0 represents the signal intensity at the lowest echo time and b value. The quantitative T2 and ADC values are obtained by fitting a single exponential decay model. The function represents the two-dimensional diffusion-relaxation correlation spectrum, which provides the volume fraction of different tissue components in each voxel. Chatterjee et al[73] reported a strong correlation between tissue composition measured via hybrid multidimensional MRI and quantitative histological evaluations. The results for prostate tissue components (stroma, epithelium, and lumen) obtained via these methods are highly consistent with the pathological results. To date, the application of these complex models to calculate tissue quantification maps and analyze tumor tissue characteristics has been preliminarily explored under conditions such as pituitary adenomas[81] and parotid gland tumors[82]. Nevertheless, research in a specific domain of pancreatic tumors has not yet been conducted. Consequently, considering the pronounced lumen structure of pancreatic tissue, this advanced imaging technique can be applied to pancreatic tumors in a murine model. This application warrants a thorough feasibility analysis and could provide novel insights into the intricate microarchitecture and pathological profiles of the abovementioned tumors.
Optimizing post-processing parameters for tumor DWI remains a challenging task, and rigorous validation against histopathology is indispensable for clinical translation. To accelerate the clinical application of diffusion techniques, the development of an open-source tool, community-driven platform is imperative. Such a shared resource would offer researchers and clinicians a standardized framework to implement and optimize DWI postprocessing models, thereby increasing the accuracy of tumor characterization and guiding personalized therapy.
DISCUSSION
Currently, 1.5 Tesla (1.5-T) and 3 Tesla (3.0-T) MRI systems are commonly used in the clinic for examinations across various anatomical regions of patients. A systematic review revealed that the superiority of 3.0-T over 1.5-T for pancreatic DWI has not been proven, because of a lack of published studies[83]. However, in recent years, the clinical application of 3.0-T MRI for pancreatic detection has significantly increased, with the number of studies conducted at 3.0-T being comparable to those at 1.5-T. Therefore, DWI using 3.0-T units clearly enhances the diagnostic performance for pancreatic lesions[29] because of the advantages offered by the 3.0-T system, such as improved SNR[82,84,85]. Previous studies have already advocated the use of DWI for both the detection and characterization of pancreatic disorders[86-88]. With the maturation of ultrahigh-field technology, feasibility has been established for 5.0-T, 7.0-T, and even 11.7-T MRI. Rosenkrantz et al[89] reported that the subjective image quality of abdominal DWI at 3.0-T is significantly inferior to that at 1.5-T. However, several studies have demonstrated that when combined with the rFOV-DWI technique, 5.0-T MRI can improve the quality of pancreatic images[82-84]. Zheng et al[90] and Zhang et al[91] compared the subjective image quality ratings of DW images acquired via the rFOV-DWI technique with those of 3.0-T MRI and 5.0-T MRI, and confirmed that the subjective image quality at 5.0-T was significantly greater than that at 3.0-T. Jiang et al[92] measured ADC values in normal pancreatic tissue and reported high stability, repeatability, and consistency, indicating that 5.0-T DWI can be a reliable tool for clinical pancreatic diagnosis and that rFOV-DWI is a feasible quantitative imaging tool for studying pancreatic lesions. Moreover, 7.0-T MRI is currently a limited choice for high-field MRI in human imaging and is applicable only to the head[93-95] and limbs[96]. The use of ultrahigh-field MRI is limited to preclinical animal experiments. Fujiwara et al[97] evaluated the correlation between IVIM parameters and ischaemic changes in the rat cerebral cortex via a preclinical ultrahigh-field 11.7-T MRI scanner. In a study by Zhang et al[98], conventional DWI, IVIM, and DKI were performed to assess pancreatic fibrosis in a rat model of CP. They validated the effectiveness of diffusion parameters such as the ADC, D, MD, and MK in evaluating the staging of pancreatic fibrosis. In summary, 1.5-T and 3.0-T imaging remain the mainstream choices. In this context, the stability of parameter measurements and the impact of postprocessing algorithms on the results are crucial factors that different research teams are continuously striving to address. Therefore, we recommend the development of an open-source mathematical framework and the open exchange of domain expertise. Such collaborative initiatives will increase the accuracy and reliability of DWI, ultimately accelerating progress in the diagnosis and treatment of pancreatic disease.
The postprocessing of DWI data must be considered to translate research findings into clinical practice. However, the feasibility of applying complex models from the brain to the abdomen remains uncertain. Consequently, obtaining high-quality images, which should not only have high resolution but also minimize negative factors that affect image quality, such as motion artefacts, cardiac pulsation, and gastrointestinal peristalsis, are valuable for conducting clinical validation experiments, designing suitable animal models, and utilizing dedicated imaging instruments. Additionally, animal models can provide detailed pathological information, which is valuable for revealing the potential characteristics of tumors and changes after treatment. Furthermore, certain research groups in the field of prostate studies have provided superior samples, which can serve as valuable references[63-65].
THE CURRENT CHALLENGES AND FUTURE DEVELOPMENT TRENDS
The current challenges in using DWI to diagnose pancreatic disease are twofold: Image quality and imaging time. The pancreas is particularly prone to artefacts because of its small size and proximity to the gas- and air-filled structures of the upper gastrointestinal tract. These structures cause motion and susceptibility artefacts, which can degrade image quality and complicate the radiological decision-making process, especially in exams with a high artefact burden. The high susceptibility to artefacts in abdominal DWI may stem from motion caused by gastric and bowel movement, as well as respiratory motion. This motion can hinder the discernment of small lesions, which are potentially highly relevant for diagnosis. Increasing spatial resolution to balance imaging time and image quality, including SNR and spatial resolution, can lead to a rapid decrease in the SNR of DWI. This decrease may result in a noise floor bias in the measurements of quantitative parameters, which in turn limits the application of DWI in pancreatic imaging. Therefore, MRI equipment manufacturers, research teams, and clinicians are continuously better MRI hardware facilities, such as more powerful gradients, and advanced imaging methods, including the use of artificial intelligence, to achieve rapid and high-quality pancreatic DWI.
Quantitative DWI parameters, including ADC values, may be subject to variations due to biological factors, technical factors, and measurement errors. Establishing reference standards for DWI and quantitative analysis, and promoting them on a global scale, as suggested by organizations such as the QIBA, is of paramount importance. Additionally, multicentre trials are urgently needed to enhance the applications of DWI in pancreatic diseases is one of the urgently needed tasks.
The clinical application of newly developed high-field MRI systems, such as 5.0-T, has yet to be fully evaluated in pancreas diagnostics, particularly regarding the quality, stability, and repeatability of DWI. Current reports are limited by small cohorts and an almost exclusive focus on healthy volunteers, leaving the generalizability to pancreatic pathology unknown. These challenges underscore the need for further advancements in DWI and techniques to improve image quality, reduce artefacts, and enhance the diagnostic accuracy of pancreatic disease diagnosis.
CONCLUSION
DWI is currently the most widely utilized quantitative sequence in pancreatic imaging and has good contrast for visualizing tumors, as it easily captures abnormal tumor regions. However, despite its extensive application in pancreatic imaging, the potential of various quantitative parameters of various DWI models in the pancreas remains largely unexplored. This presents an opportunity for further research and exploration to reveal the potential value of these quantitative parameters in the diagnosis and treatment of pancreatic diseases. Through continued investigation and innovation in image data acquisition, reconstruction, quantitative parameter map generation, quality assurance and interpretation, we anticipate more breakthroughs in pancreatic imaging that will offer increased diagnostic accuracy and reliable treatment strategies for clinical practice.
Provenance and peer review: Unsolicited article; Externally peer reviewed.
Peer-review model: Single blind
Specialty type: Radiology, nuclear medicine and medical imaging
Country of origin: China
Peer-review report’s classification
Scientific Quality: Grade A, Grade B, Grade B, Grade C
Novelty: Grade A, Grade A, Grade B, Grade C
Creativity or Innovation: Grade A, Grade B, Grade B, Grade C
Scientific Significance: Grade A, Grade B, Grade B, Grade C
Open Access: This article is an open-access article that was selected by an in-house editor and fully peer-reviewed by external reviewers. It is distributed in accordance with the Creative Commons Attribution NonCommercial (CC BY-NC 4.0) license, which permits others to distribute, remix, adapt, build upon this work non-commercially, and license their derivative works on different terms, provided the original work is properly cited and the use is non-commercial. See: https://creativecommons.org/Licenses/by-nc/4.0/
P-Reviewer: Niu L, Additional Professor, China; Pappachan JM, MD, FRCP, MRCP, Professor, Senior Researcher, United Kingdom; Ravi PK, MD, Assistant Professor, India S-Editor: Qu XL L-Editor: A P-Editor: Lei YY


