Copyright
©2010 Baishideng Publishing Group Co.
World J Radiol. Oct 28, 2010; 2(10): 384-398
Published online Oct 28, 2010. doi: 10.4329/wjr.v2.i10.384
Published online Oct 28, 2010. doi: 10.4329/wjr.v2.i10.384
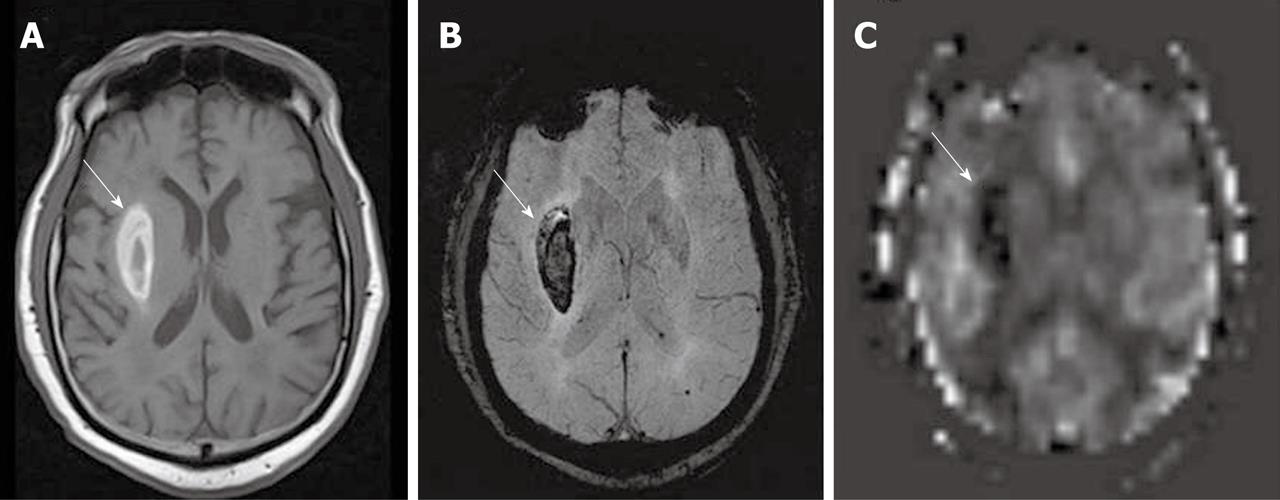
Figure 1 Right putaminal hemorrhage, seen as a bright signal intensity lesion on T1W (A), dark signal intensity on SWI (B), and dark signal on an arterial spin labeling cerebral blood flow map (C) (white arrows).
High signal intensity in an adjacent right sylvian fissure in the arterial spin labeling cerebral blood flow map may represent stagnant arterial flow due to a pressure effect from the hematoma.
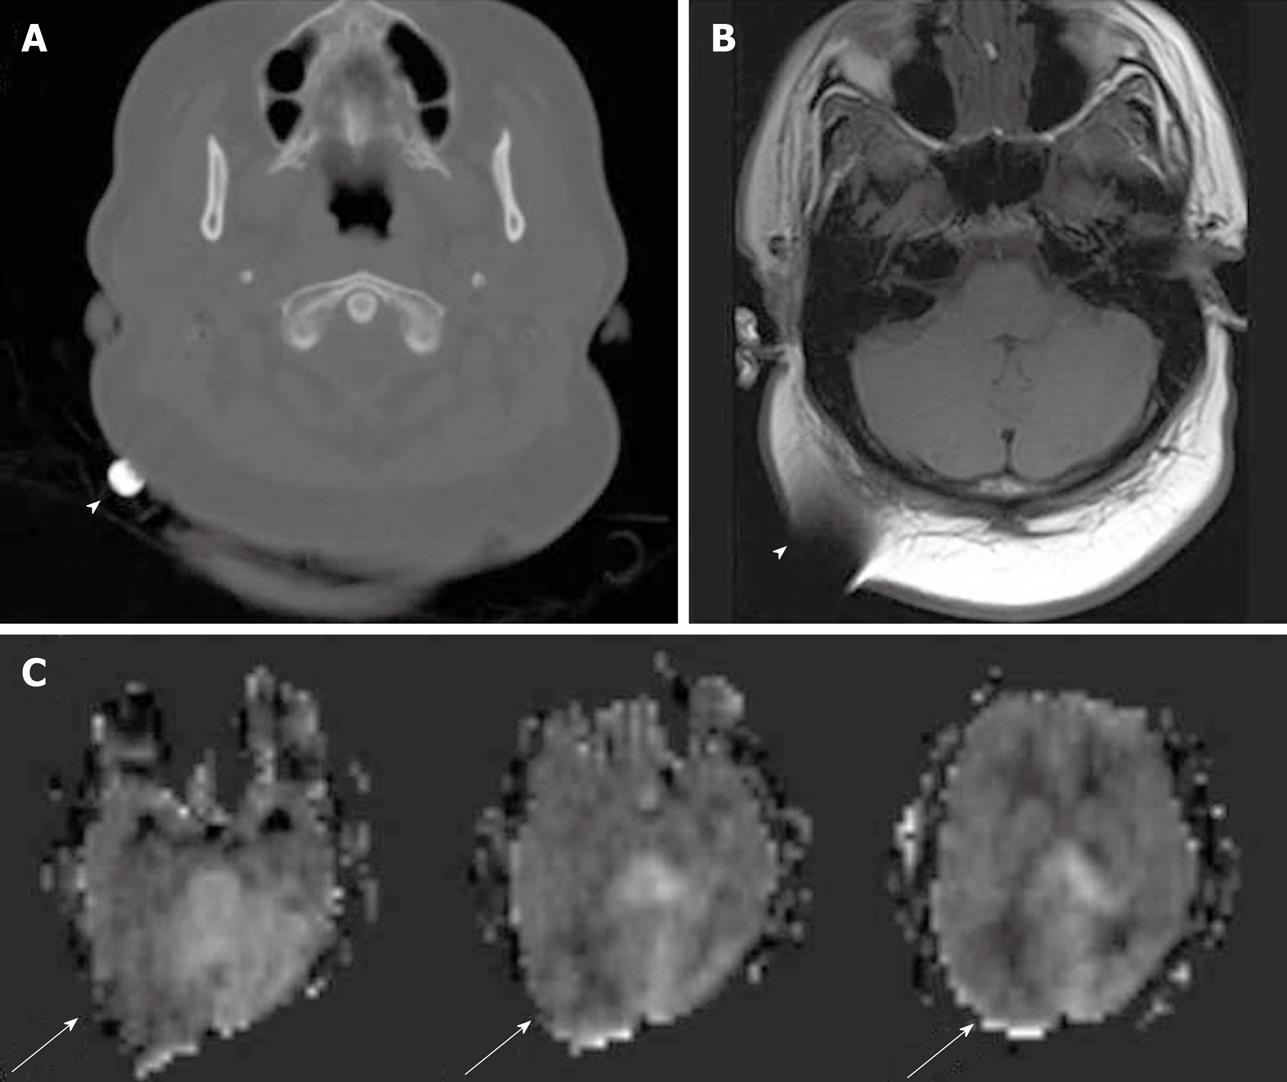
Figure 2 Metallic object at right occipital region, seen as high density focus on computed tomography (A), dark signal with susceptibility artifact on T1W magnetic resonance imaging (B) (white arrowheads), and image distortion on arterial spin labeling cerebral blood flow maps (C) (white arrows).
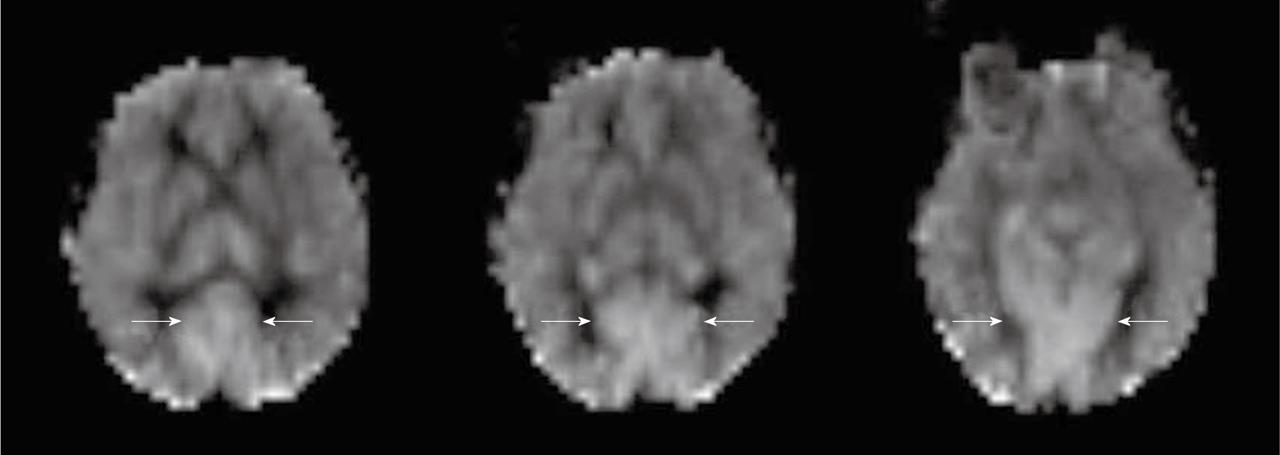
Figure 3 Physiologic hyperperfusion in bilateral occipital cortex (white arrows).
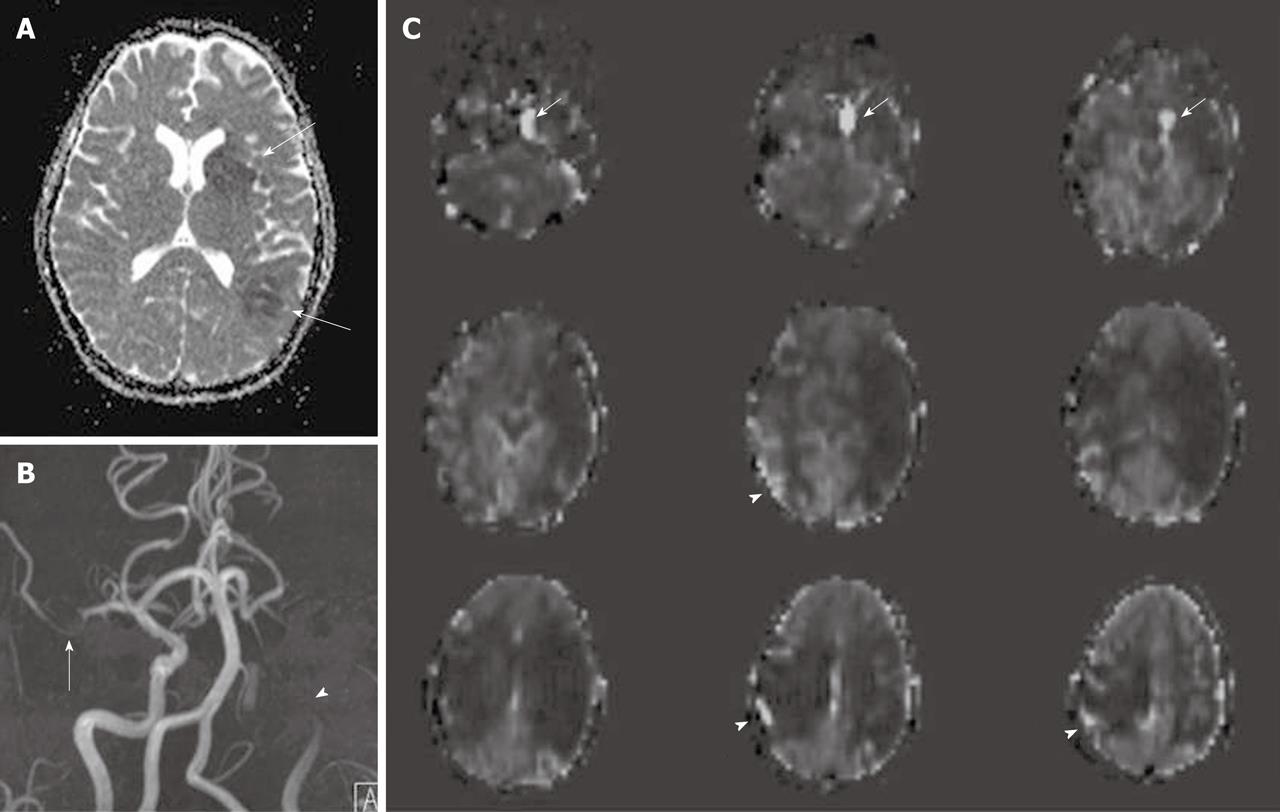
Figure 4 Acute cerebral infarction of left middle cerebral artery territory seen as two foci of low signal intensity on ADC map (A) (white arrows).
Magnetic resonance angiography (B) demonstrates left internal carotid artery (ICA) occlusion (white arrowhead) and right middle cerebral artery (MCA) stenosis (white arrow). Arterial spin labeling cerebral blood flow maps (C) reveal a large area of perfusion diffusion mismatch in the left cerebral hemisphere and also hypoperfusion in the right MCA territory. Delayed arterial transit effects are also seen over the hypoperfusion area in the right cerebral hemisphere (white arrowheads) as well as intravascular signal in the left ICA proximal to the occluded site (white arrows).
Figure 5 Post gadolinium T1WI with fat suppression (A) demonstrates left cavernous sinus meningioma encasing left internal carotid artery (black arrow).
Magnetic resonance angiography (B) shows marked narrowing of the cavernous portion of the left internal carotid artery (white arrow). An arterial spin labeling cerebral blood flow map (C) shows delayed arterial transit effects over the left middle cerebral artery territory at the level of the centrum semiovale (white arrowhead).
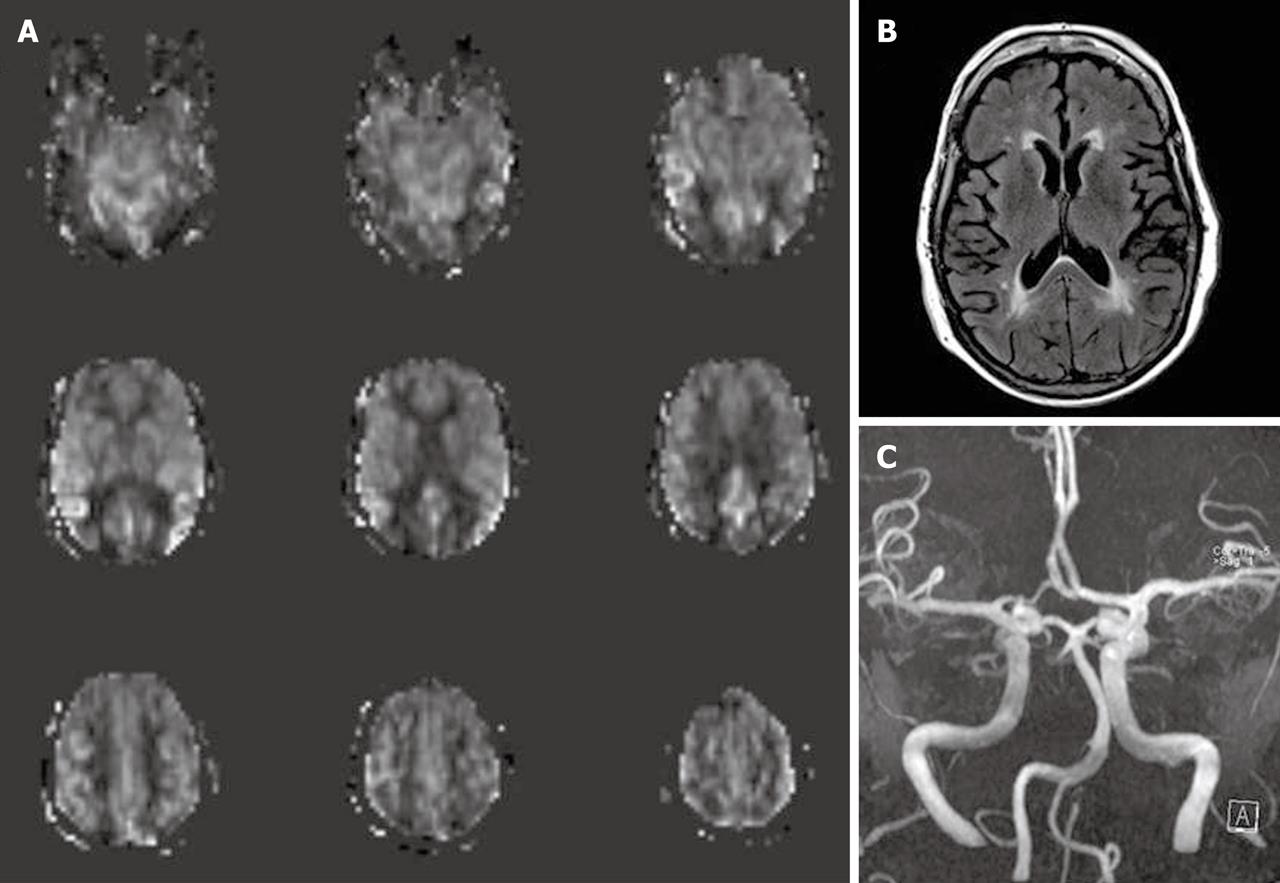
Figure 6 A 77-year-old female underwent magnetic resonance imaging of the brain due to cognitive impairment.
Arterial spin labeling cerebral blood flow maps (A) show a borderzone sign, seen as low signal intensity in arterial watershed regions with serpiginous high signal intensity in the surrounding cortex. FLAIR images (B) reveal nonspecific high signal intensity in periventricular deep white matter without other abnormality. Magnetic resonance angiography (MRA) of the brain (C), MRA of the neck and dynamic susceptibility contrast magnetic resonance perfusion (not shown) were unremarkable.
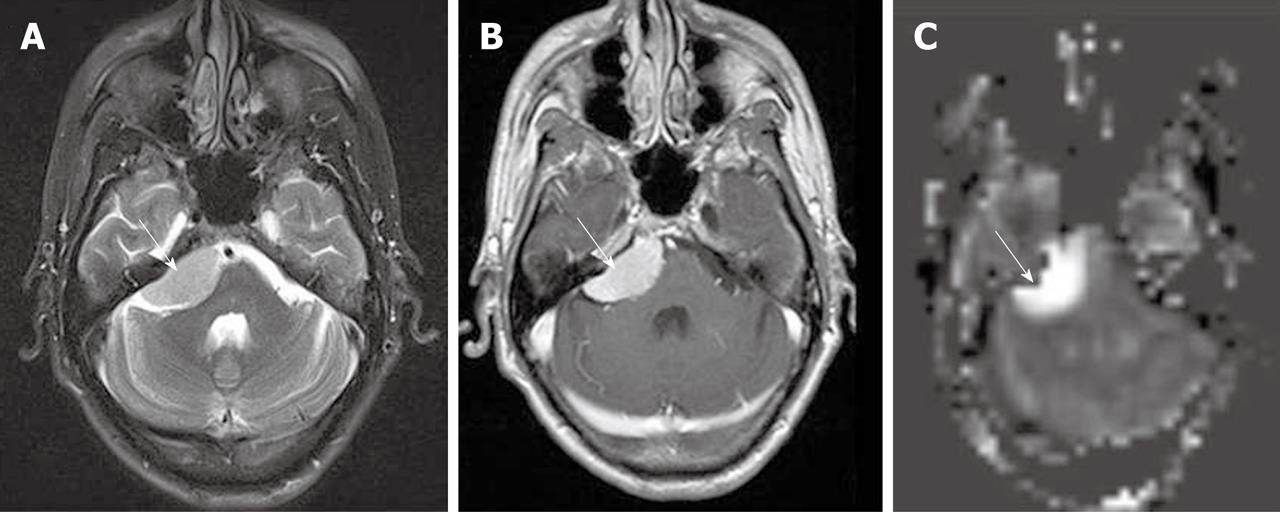
Figure 7 Right cerebellopontine angle meningioma, seen as well circumscribed extra-axial slightly high signal intensity mass on T2WI (A), intense homogeneous enhancement on post gadolinium T1WI (B), and markedly increased perfusion on arterial spin labeling cerebral blood flow map (C) (white arrows).
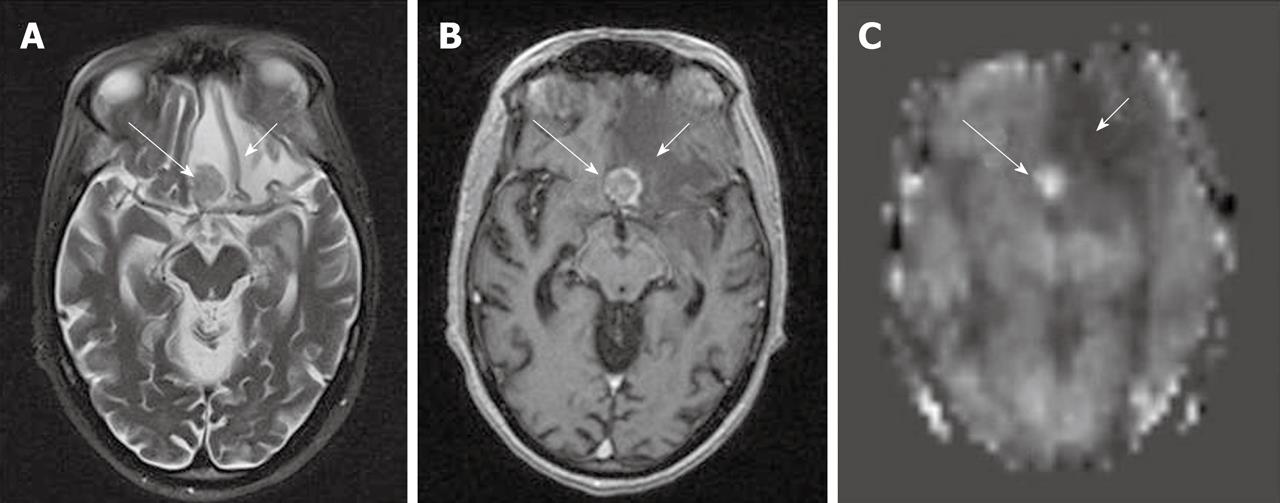
Figure 8 A case of non-small cell lung cancer with left frontal metastases.
The lesion shows low to isosignal intensity on T2WI (A), peripheral and central enhancement on post gadolinium T1WI (B) and hyperperfusion on arterial spin labeling (ASL) cerebral blood flow (CBF) map (C) (long white arrows). The area of perilesional edema (short white arrows) also shows hypoperfusion on ASL CBF map.
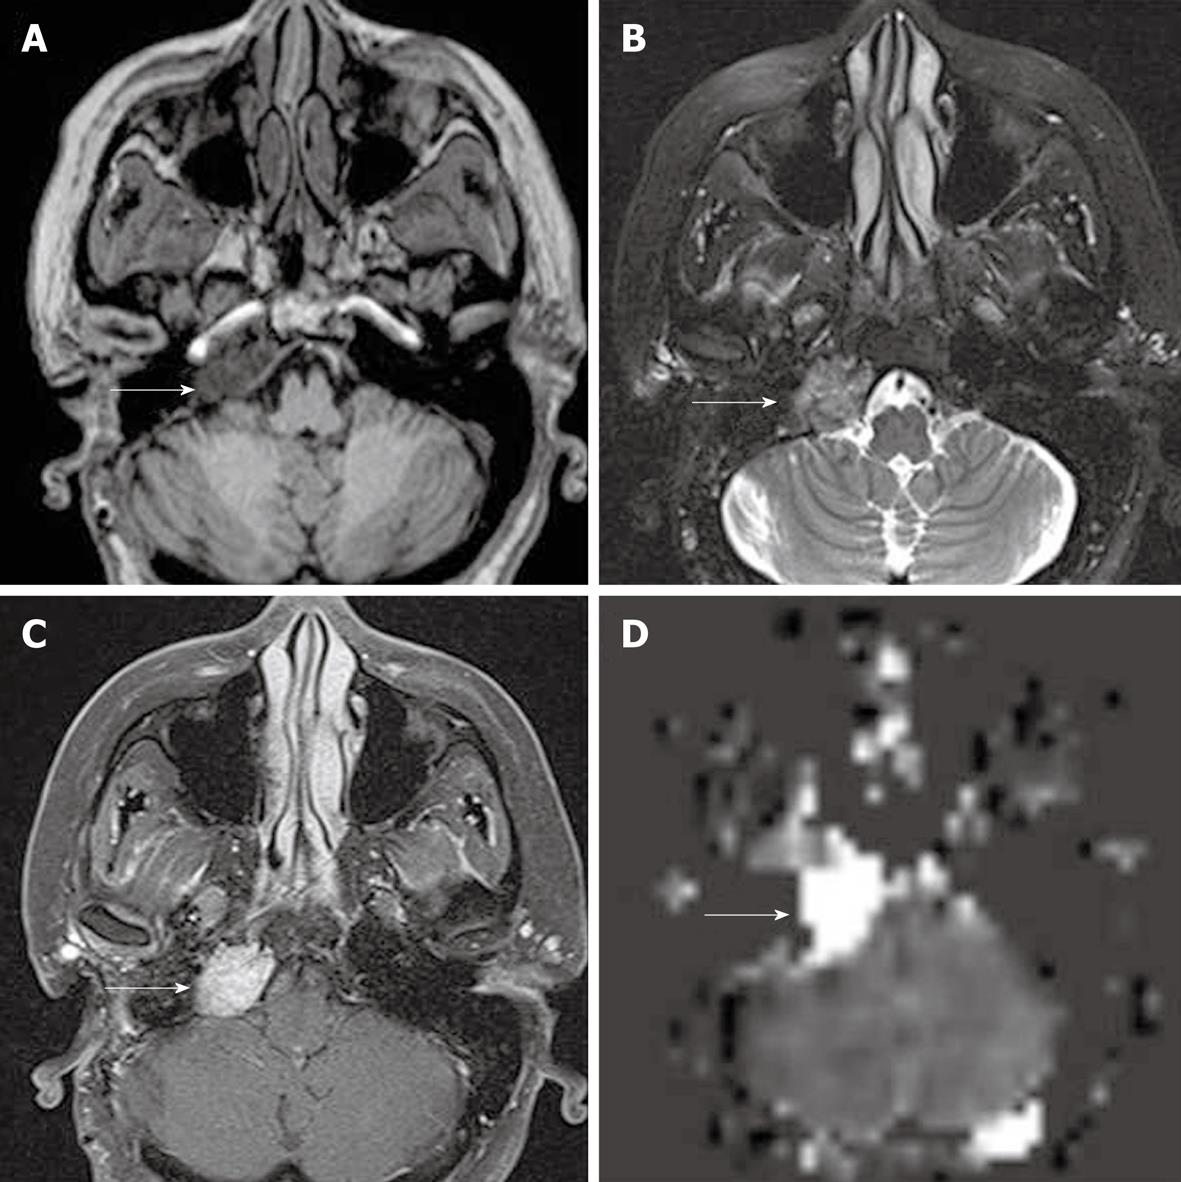
Figure 9 Residual glomus tumor in right jugular foramen, seen as low signal intensity on T1W (A), heterogeneous iso- to high signal intensity on T2WI (B), homogeneously enhancement on post gadolinium T1WI with fat suppression (C) and markedly increased perfusion on arterial spin labeling cerebral blood flow map (D) (white arrows).
Figure 10 Right temporal arteriovenous malformation.
Arterial spin labeling cerebral blood flow maps (A) demonstrate oval-shaped bright signal intensity lesion in right temporal lobe (long white arrows) with linear bright signal intensity adjacent to the right sphenoid ridge and superficial to the right frontal lobe (short white arrows), representing AV shunting in the AVM with venous drainage in to the cortical veins. The findings correspond with right internal carotid artery angiography (B and C) showing rapid filling of the AVM nidus (arrowheads) and venous drainage into the cortical vein over the right frontal and temporal lobes (black arrows). Slightly decreased perfusion in the right middle cerebral artery territory is noted, probably reflecting a steal phenomenon.
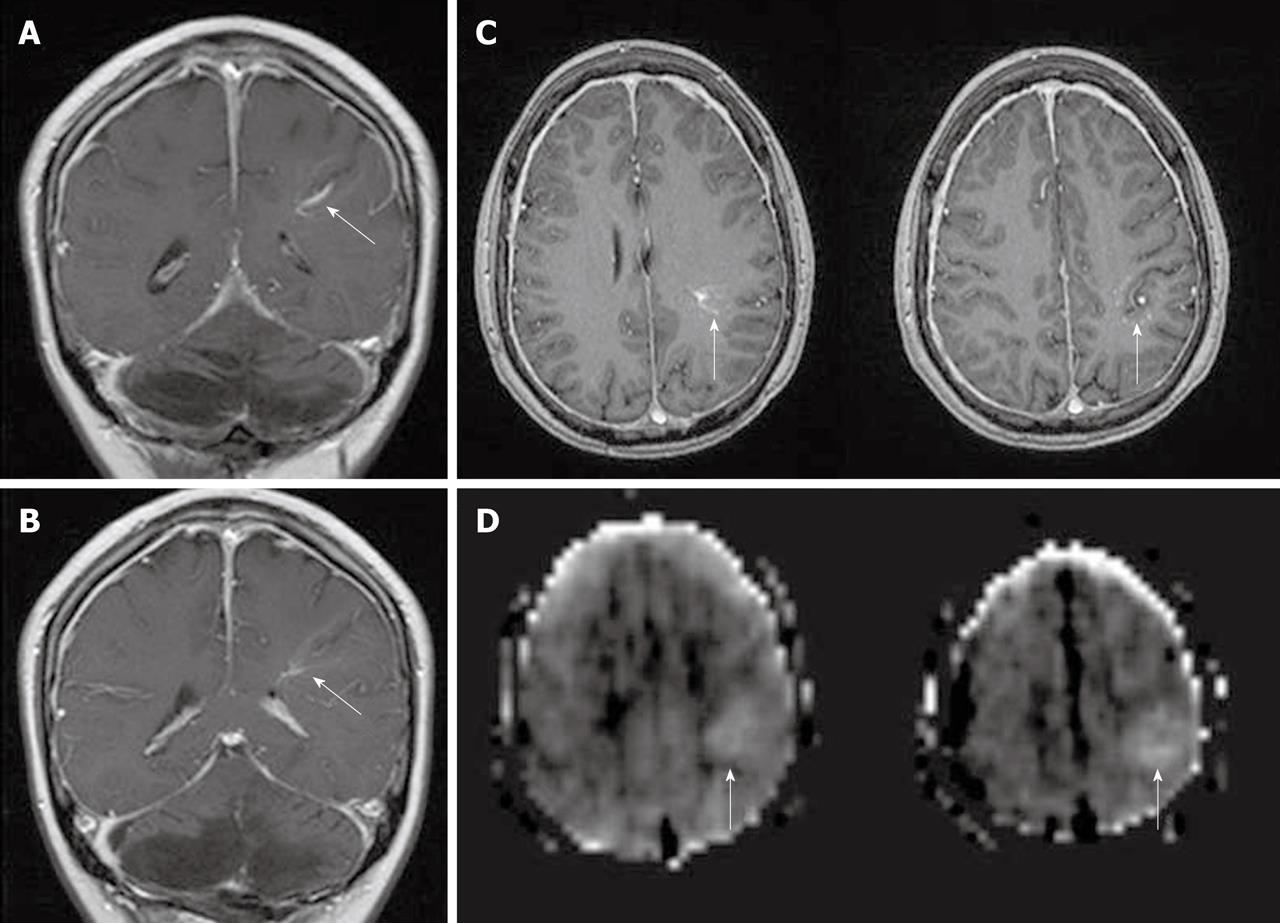
Figure 11 Developmental venous anomaly in the left frontoparietal lobe, seen as enhancing dilated medullary veins draining into the transcortical collector vein on coronal (A and B) and axial (C) post gadolinium T1WI (white arrows).
Arterial spin labeling cerebral blood flow maps (D) demonstrate hyperperfusion in the developmental venous anomaly and surrounding brain parenchyma (white arrows).
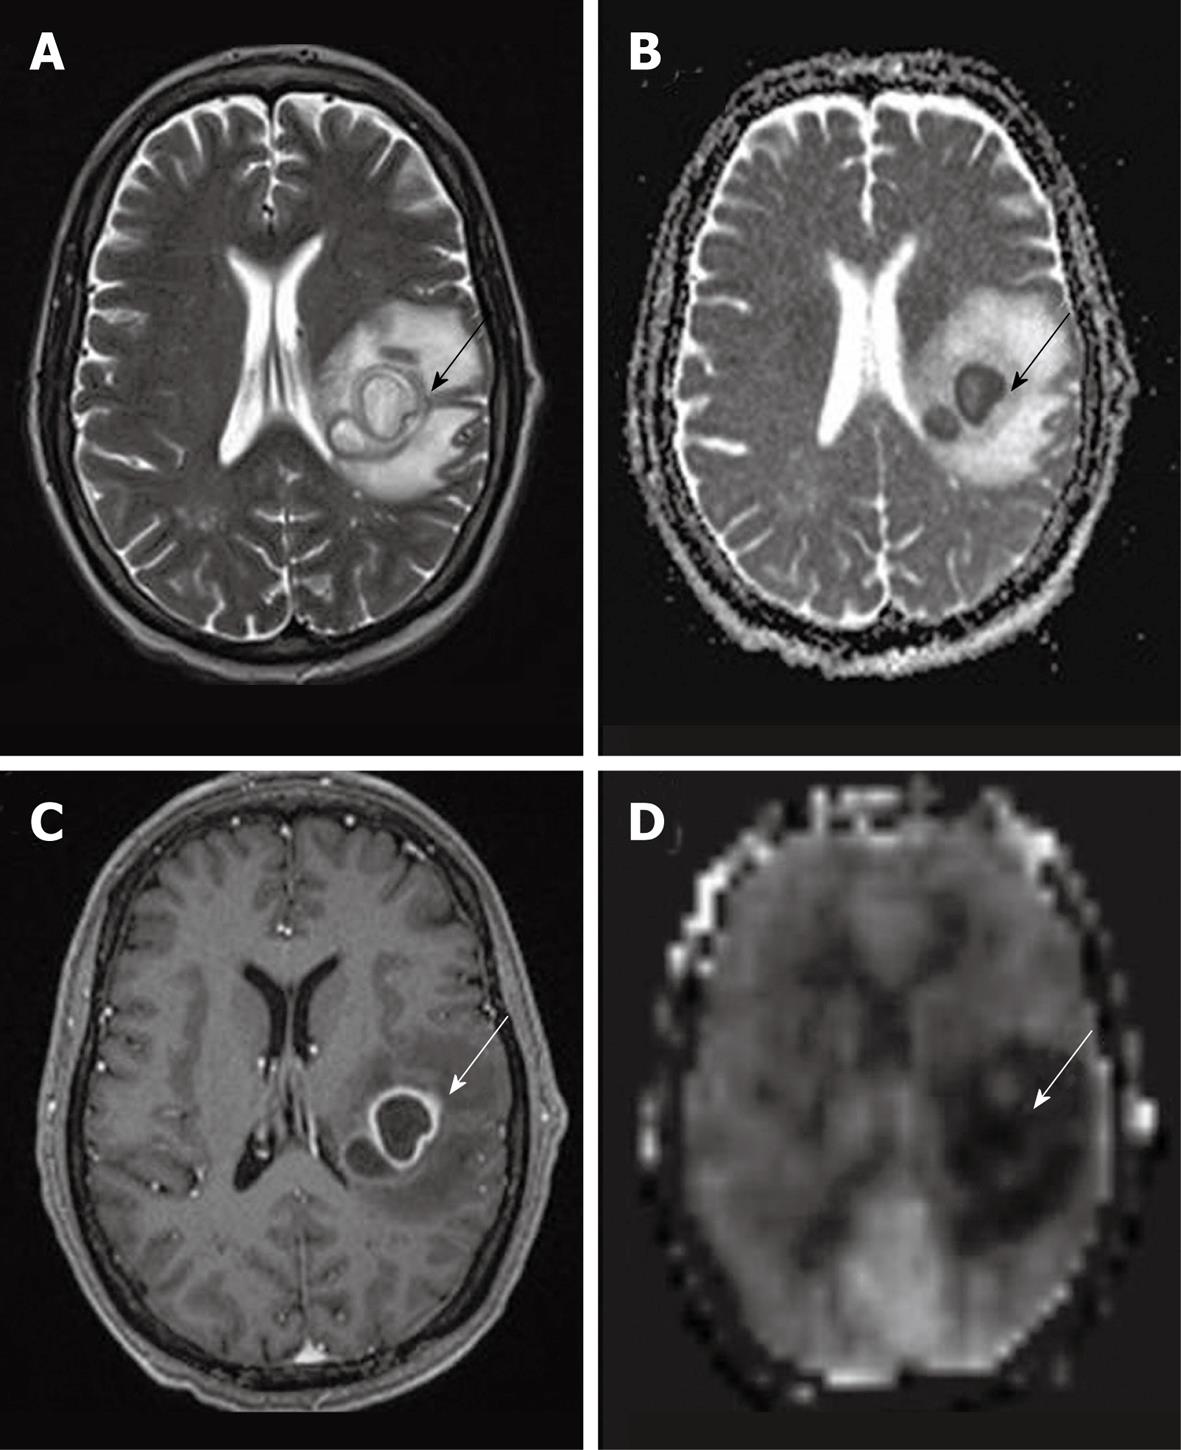
Figure 12 A case of abscess in the left frontoparietal lobe.
T2WI (A) shows internal high signal intensity with peripheral dark signal intensity (black arrow). ADC map (B) shows low signal intensity of the abscess content, representing restricted fluid diffusion (black arrow). Smooth rim enhancement is noted on post gadolinium T1WI (C) (white arrow). An arterial spin labeling cerebral blood flow map (D) shows hypoperfusion with minimal hyperperfused rim (white arrow).
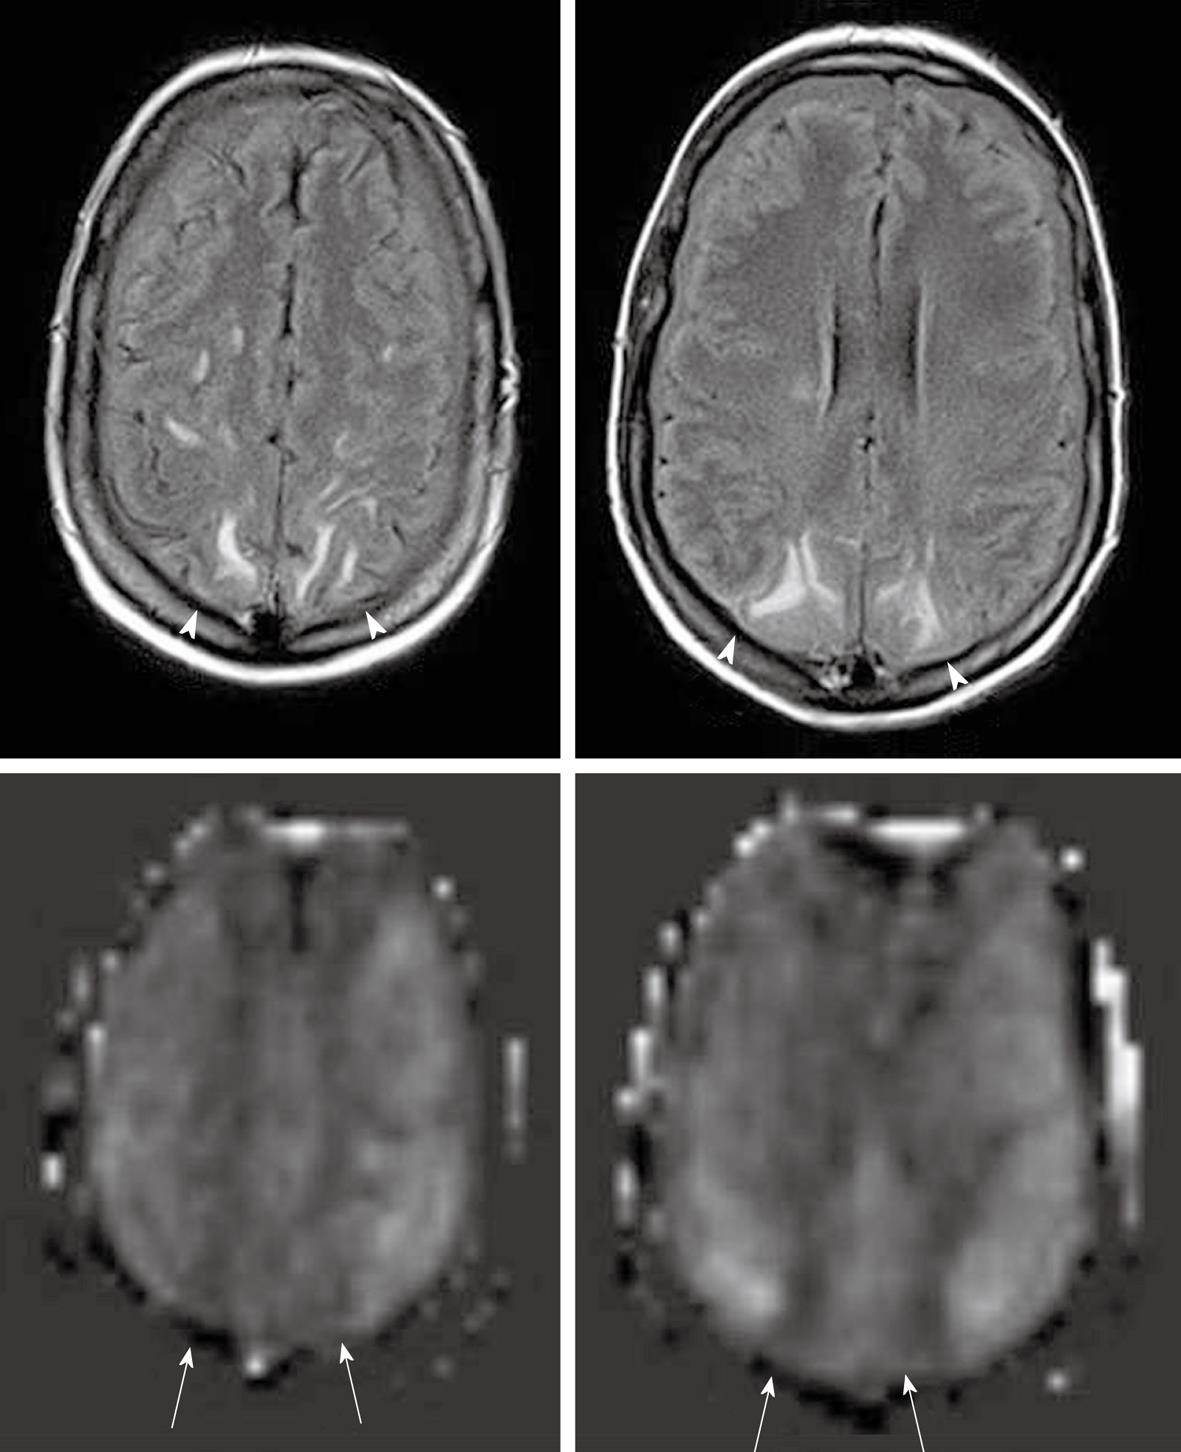
Figure 13 Posterior reversible encephalopathy syndrome seen as high signal intensity in parasagittal subcortical white matter in bilateral parietal lobes on FLAIR images (top row) (white arrowheads).
Arterial spin labeling cerebral blood flow maps (bottom row) demonstrate decreased perfusion in the affected area (white arrows). Minimal bilateral subdural fluid is also noted.
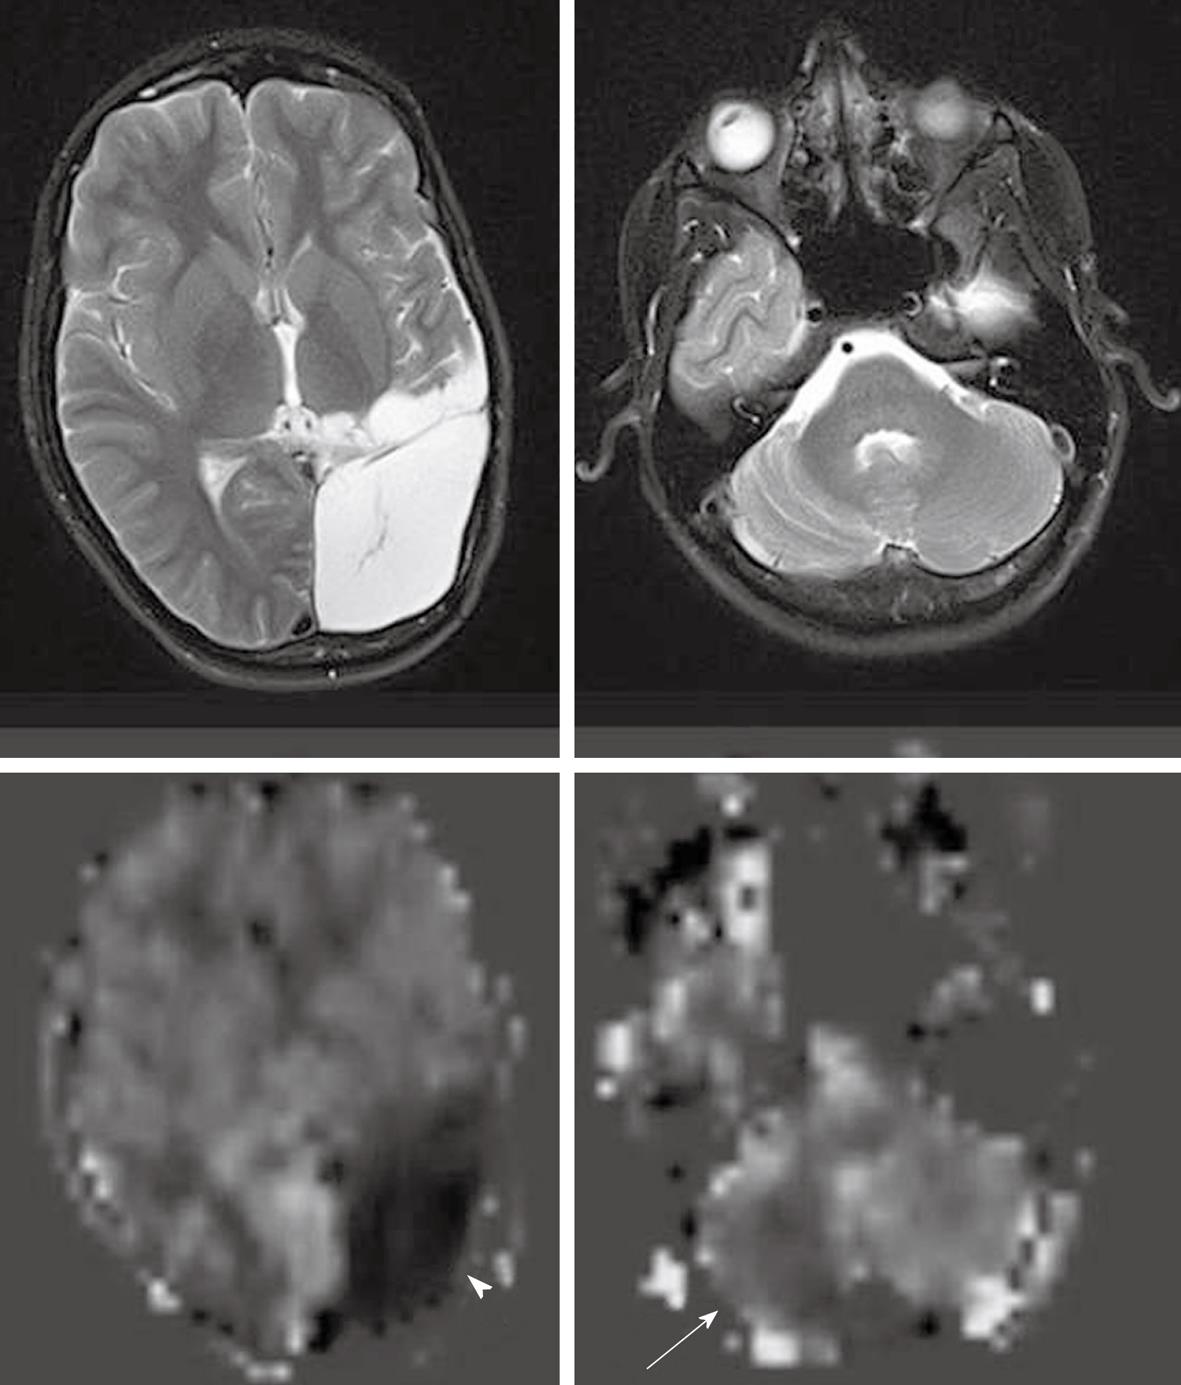
Figure 14 A case of old infarction with encephalomalacic change in left cerebral hemisphere.
Arterial spin labeling cerebral blood flow maps (bottom row) demonstrate no perfusion to the encephalomalacic brain (white arrowhead) and decreased perfusion in the mildly atrophic right cerebellar hemisphere (white arrow), consistent with cross cerebellar diaschisis.
- Citation: Petcharunpaisan S, Ramalho J, Castillo M. Arterial spin labeling in neuroimaging. World J Radiol 2010; 2(10): 384-398
- URL: https://www.wjgnet.com/1949-8470/full/v2/i10/384.htm
- DOI: https://dx.doi.org/10.4329/wjr.v2.i10.384


