
















Copyright: ©Author(s) 2026.
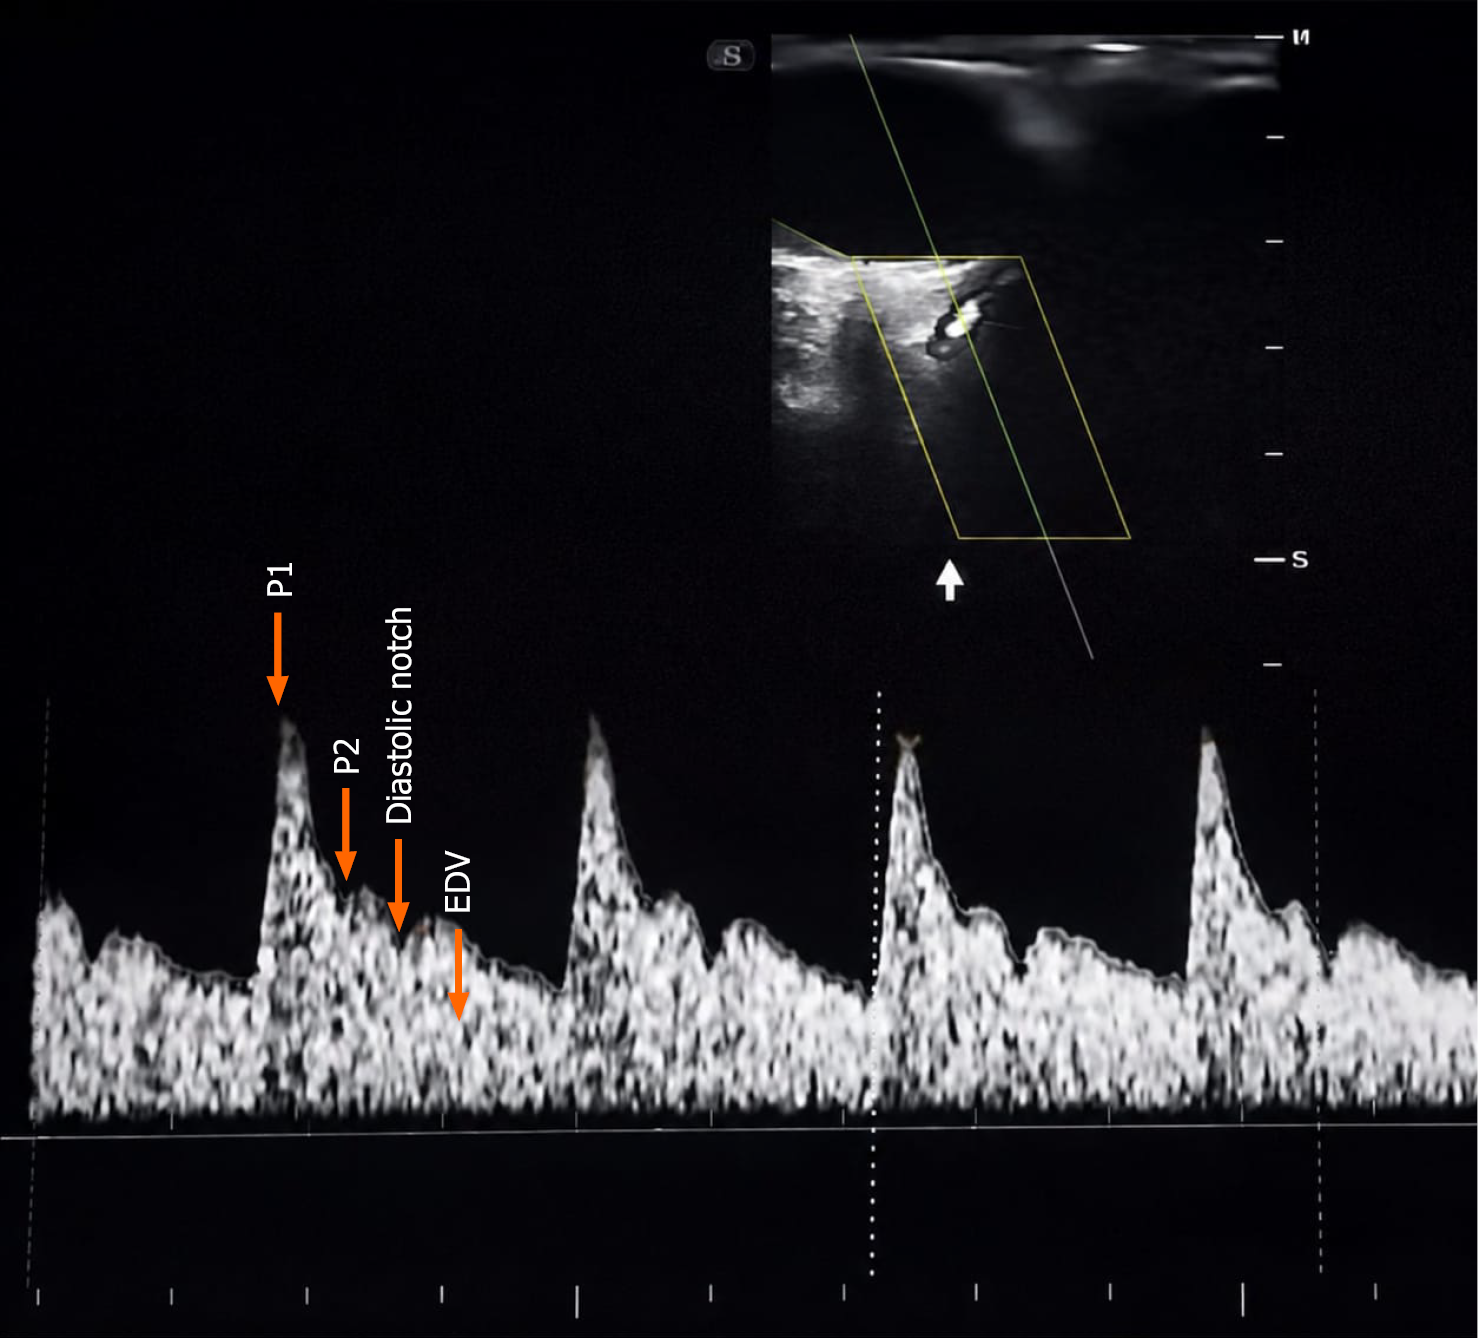
Figure 1
Ophthalmic artery Doppler image demonstrating the first systolic peak velocity (P1), second systolic peak velocity (P2), diastolic notch, and end-diastolic velocity (EDV).
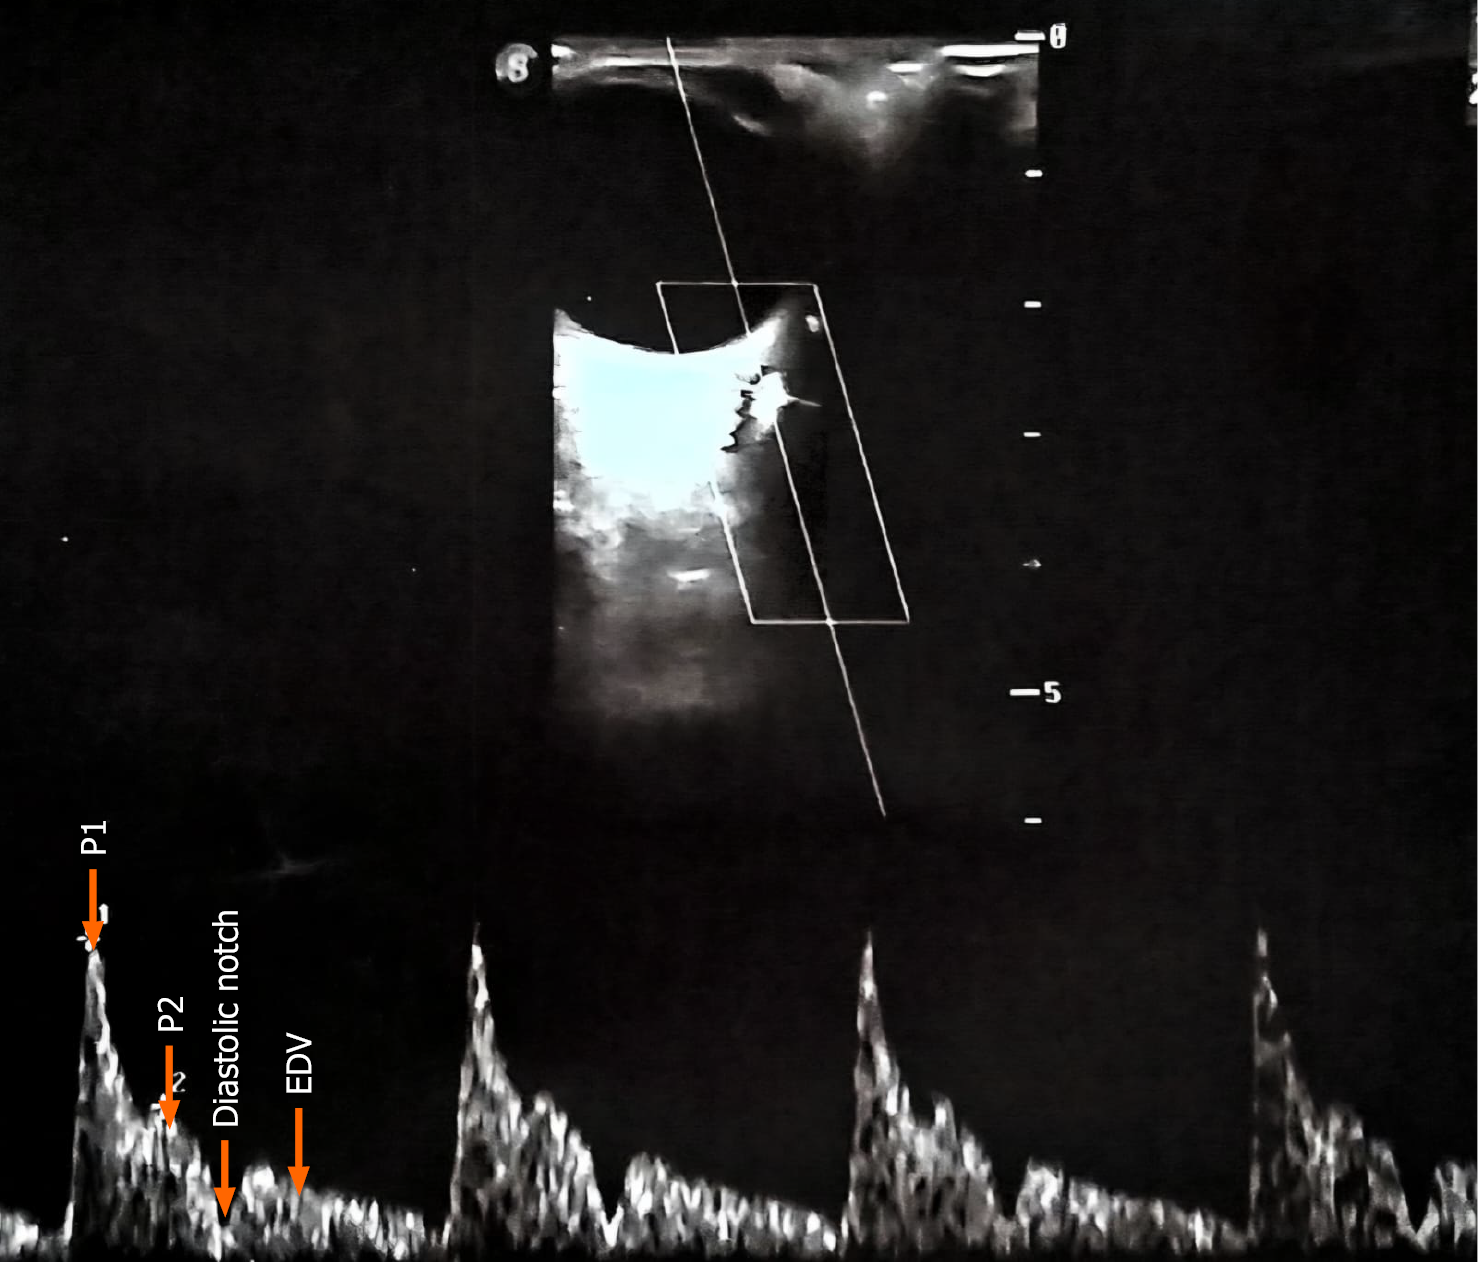
Figure 2 Doppler imaging of the ophthalmic artery obtained from a patient who subsequently developed preeclampsia demonstrates an elevated second systolic peak velocity of 32 cm/second and a first systolic peak velocity of 52 cm/second, resulting in an increased peak ratio.
EDV: End-diastolic velocity; P1: First systolic peak velocity; P2: Second systolic peak velocity.
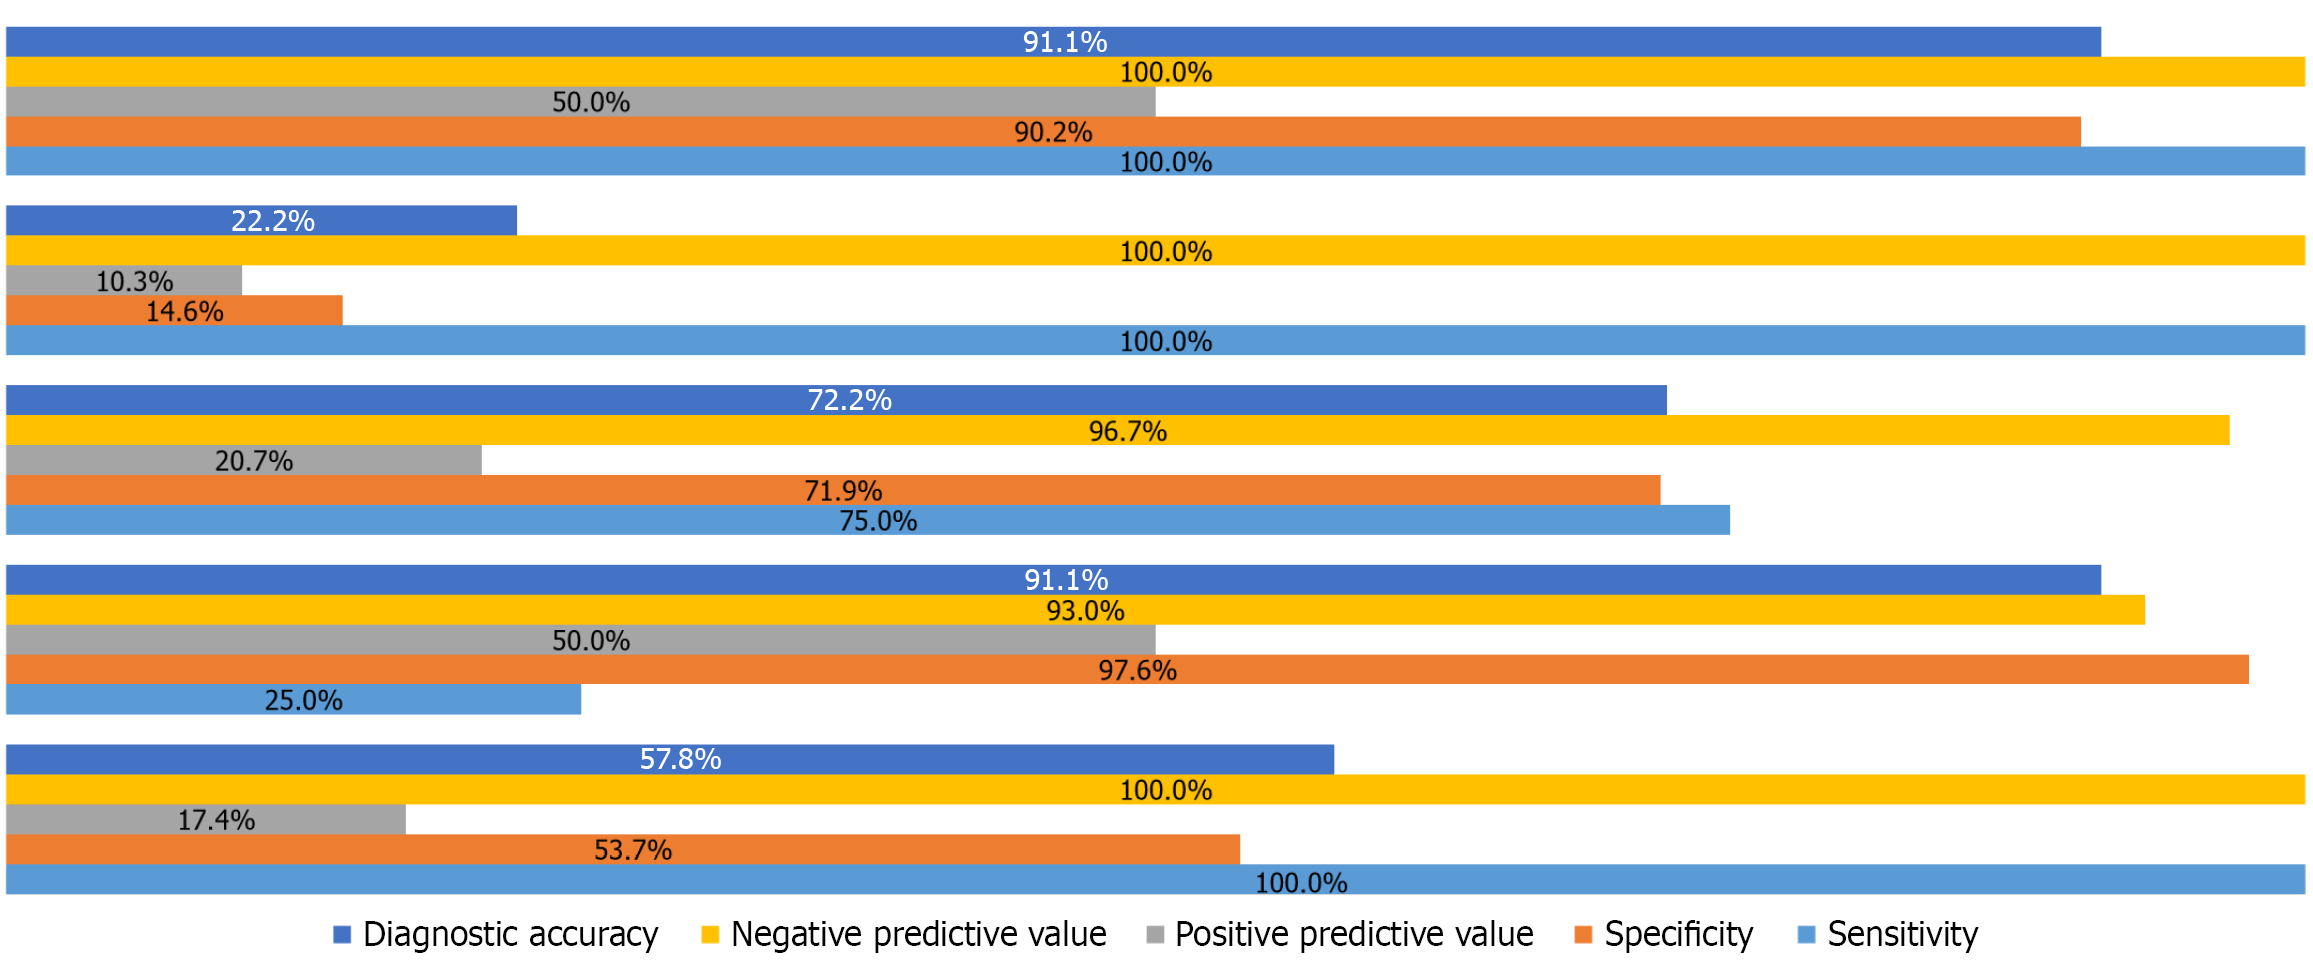
Figure 3
Diagnostic performance of ophthalmic artery Doppler parameters for predicting preeclampsia.
The figure compares the sensitivity, specificity, positive predictive value, negative predictive value, and overall diagnostic accuracy of low resistive index, low first systolic peak velocity, low pulsatility index, high second systolic peak velocity, and elevated peak ratio.
- Citation: Dhiman R, Nayyar N, Takkar P, Sood D, Shukla A. Predictive value of second-trimester ophthalmic artery Doppler for identifying women at risk for preeclampsia. World J Radiol 2026; 18(7): 120995
- URL: https://www.wjgnet.com/1949-8470/full/v18/i7/120995.htm
- DOI: https://dx.doi.org/10.4329/wjr.120995