
















Copyright: ©Author(s) 2026.
World J Radiol. May 28, 2026; 18(5): 119213
Published online May 28, 2026. doi: 10.4329/wjr.v18.i5.119213
Published online May 28, 2026. doi: 10.4329/wjr.v18.i5.119213
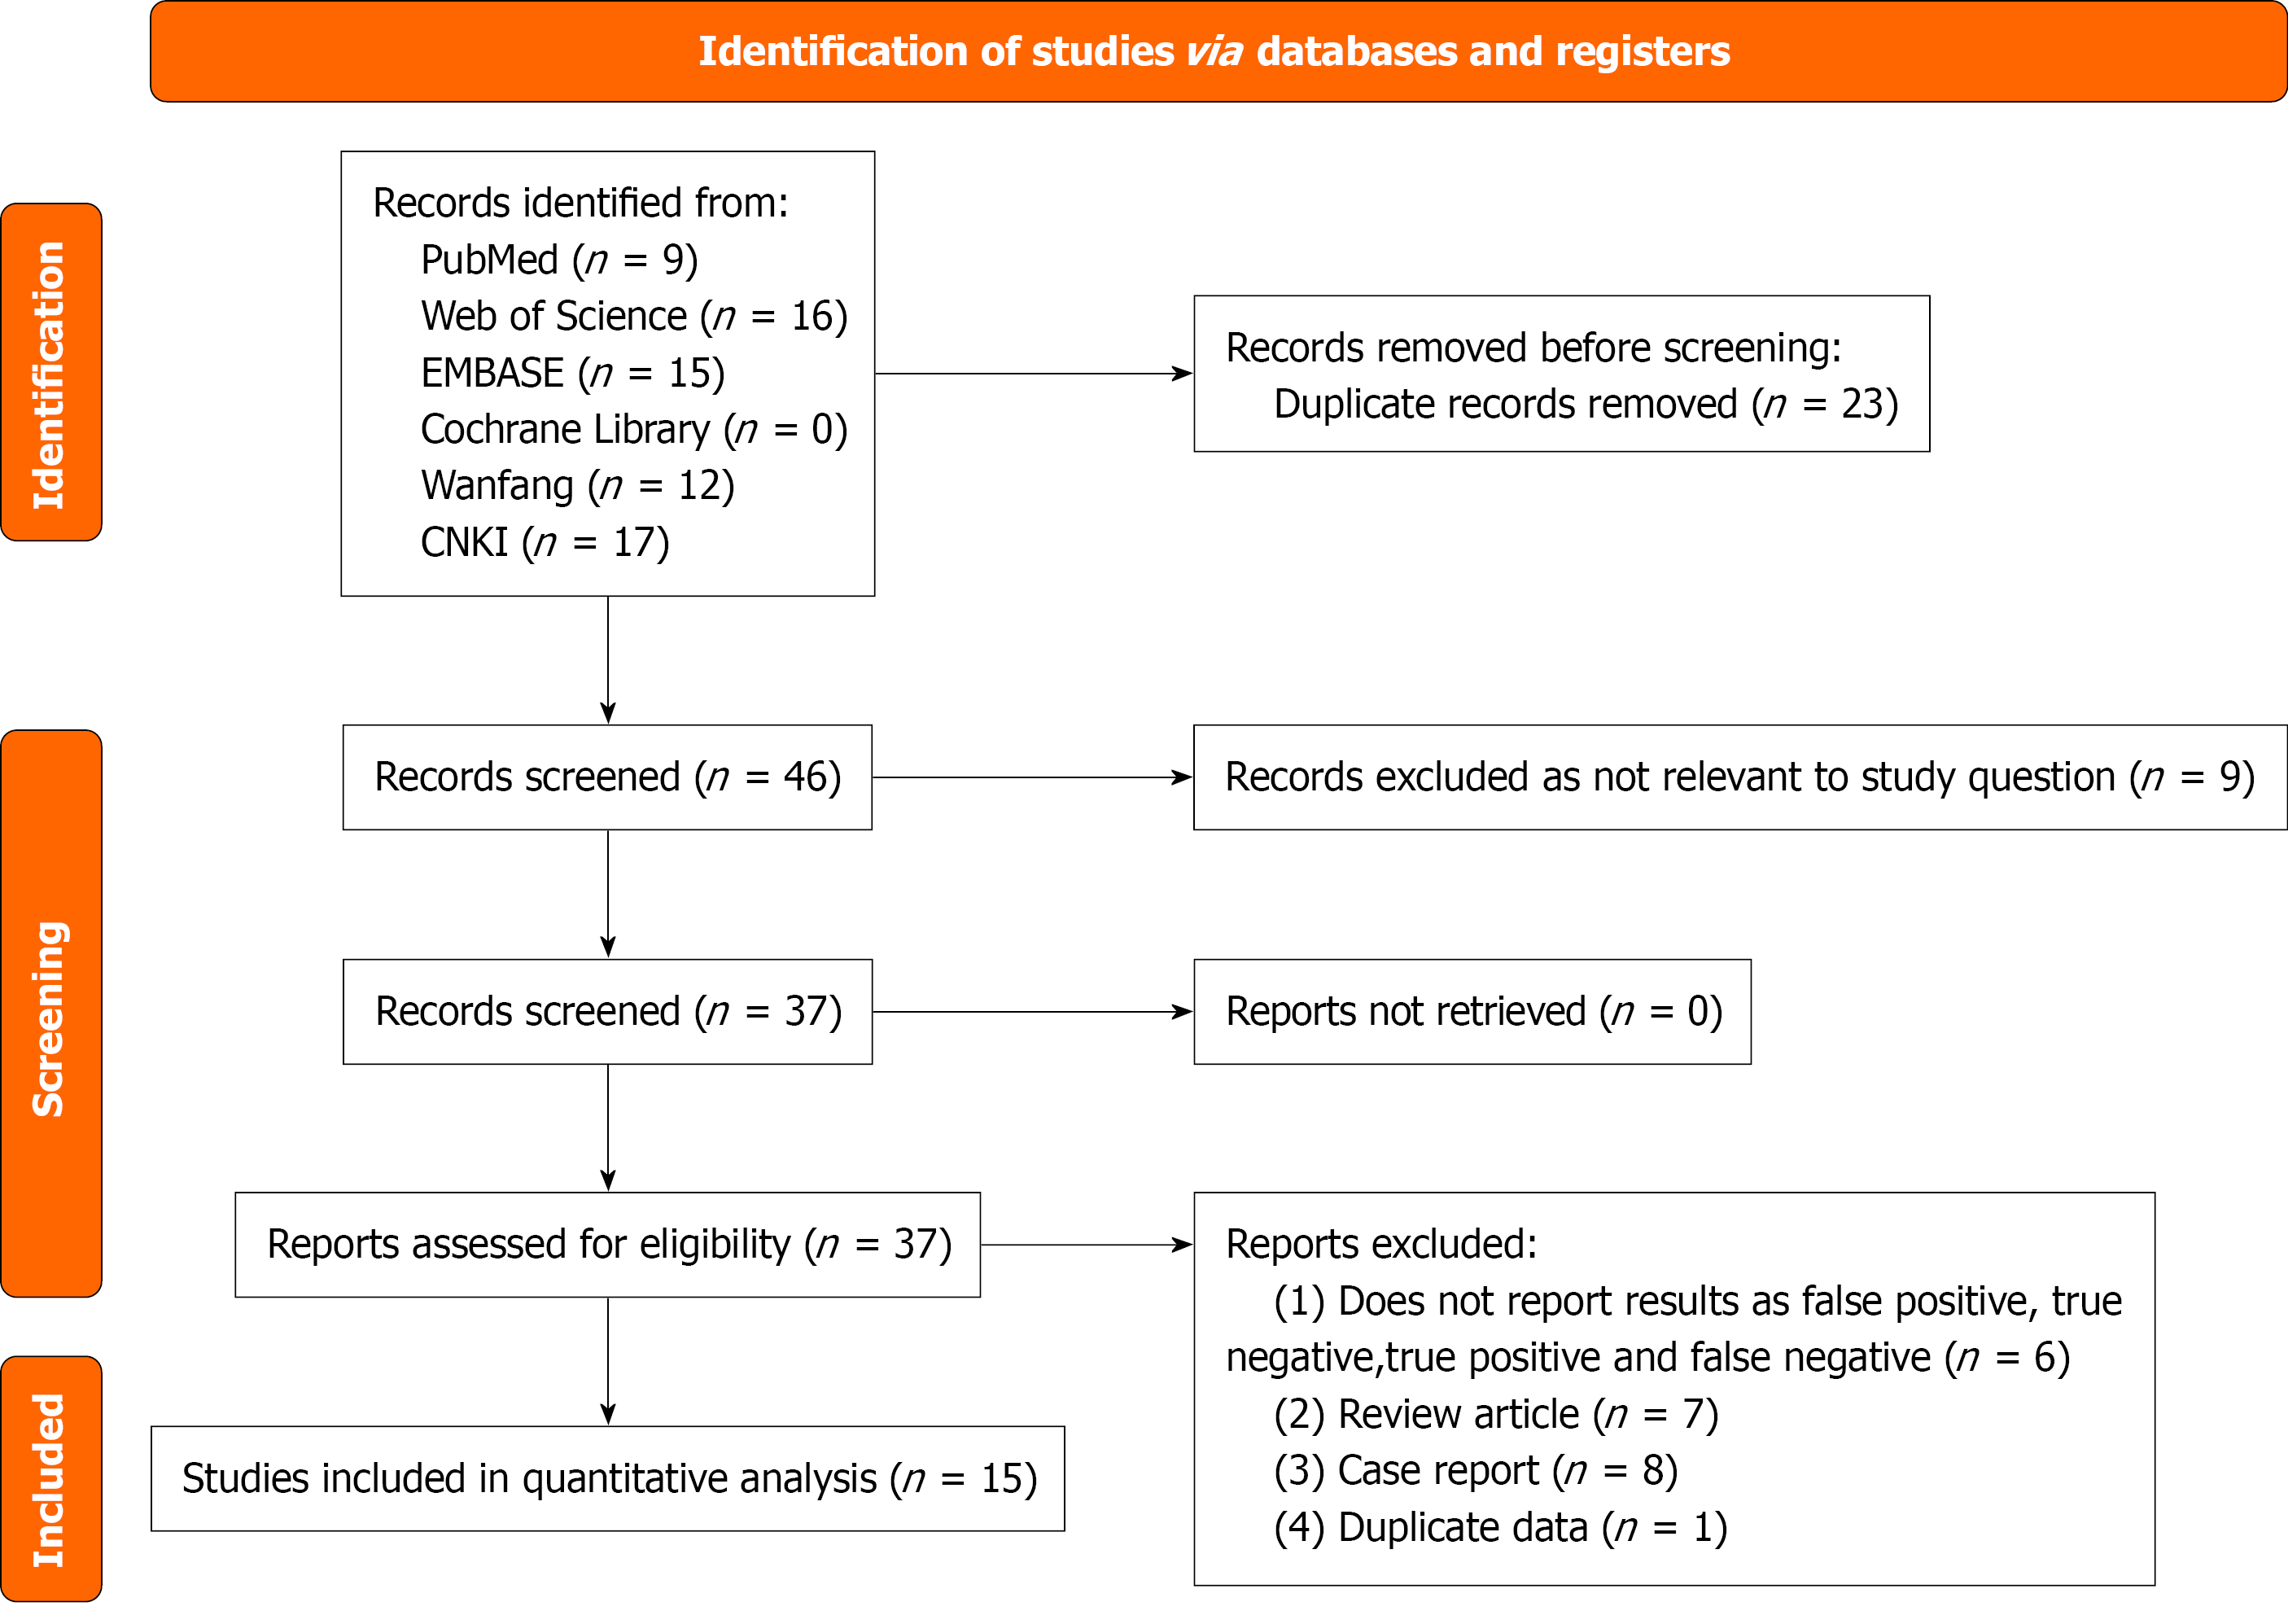
Figure 1 PRISMA flowchart outlining the literature screening process, study selection, and exclusion criteria.
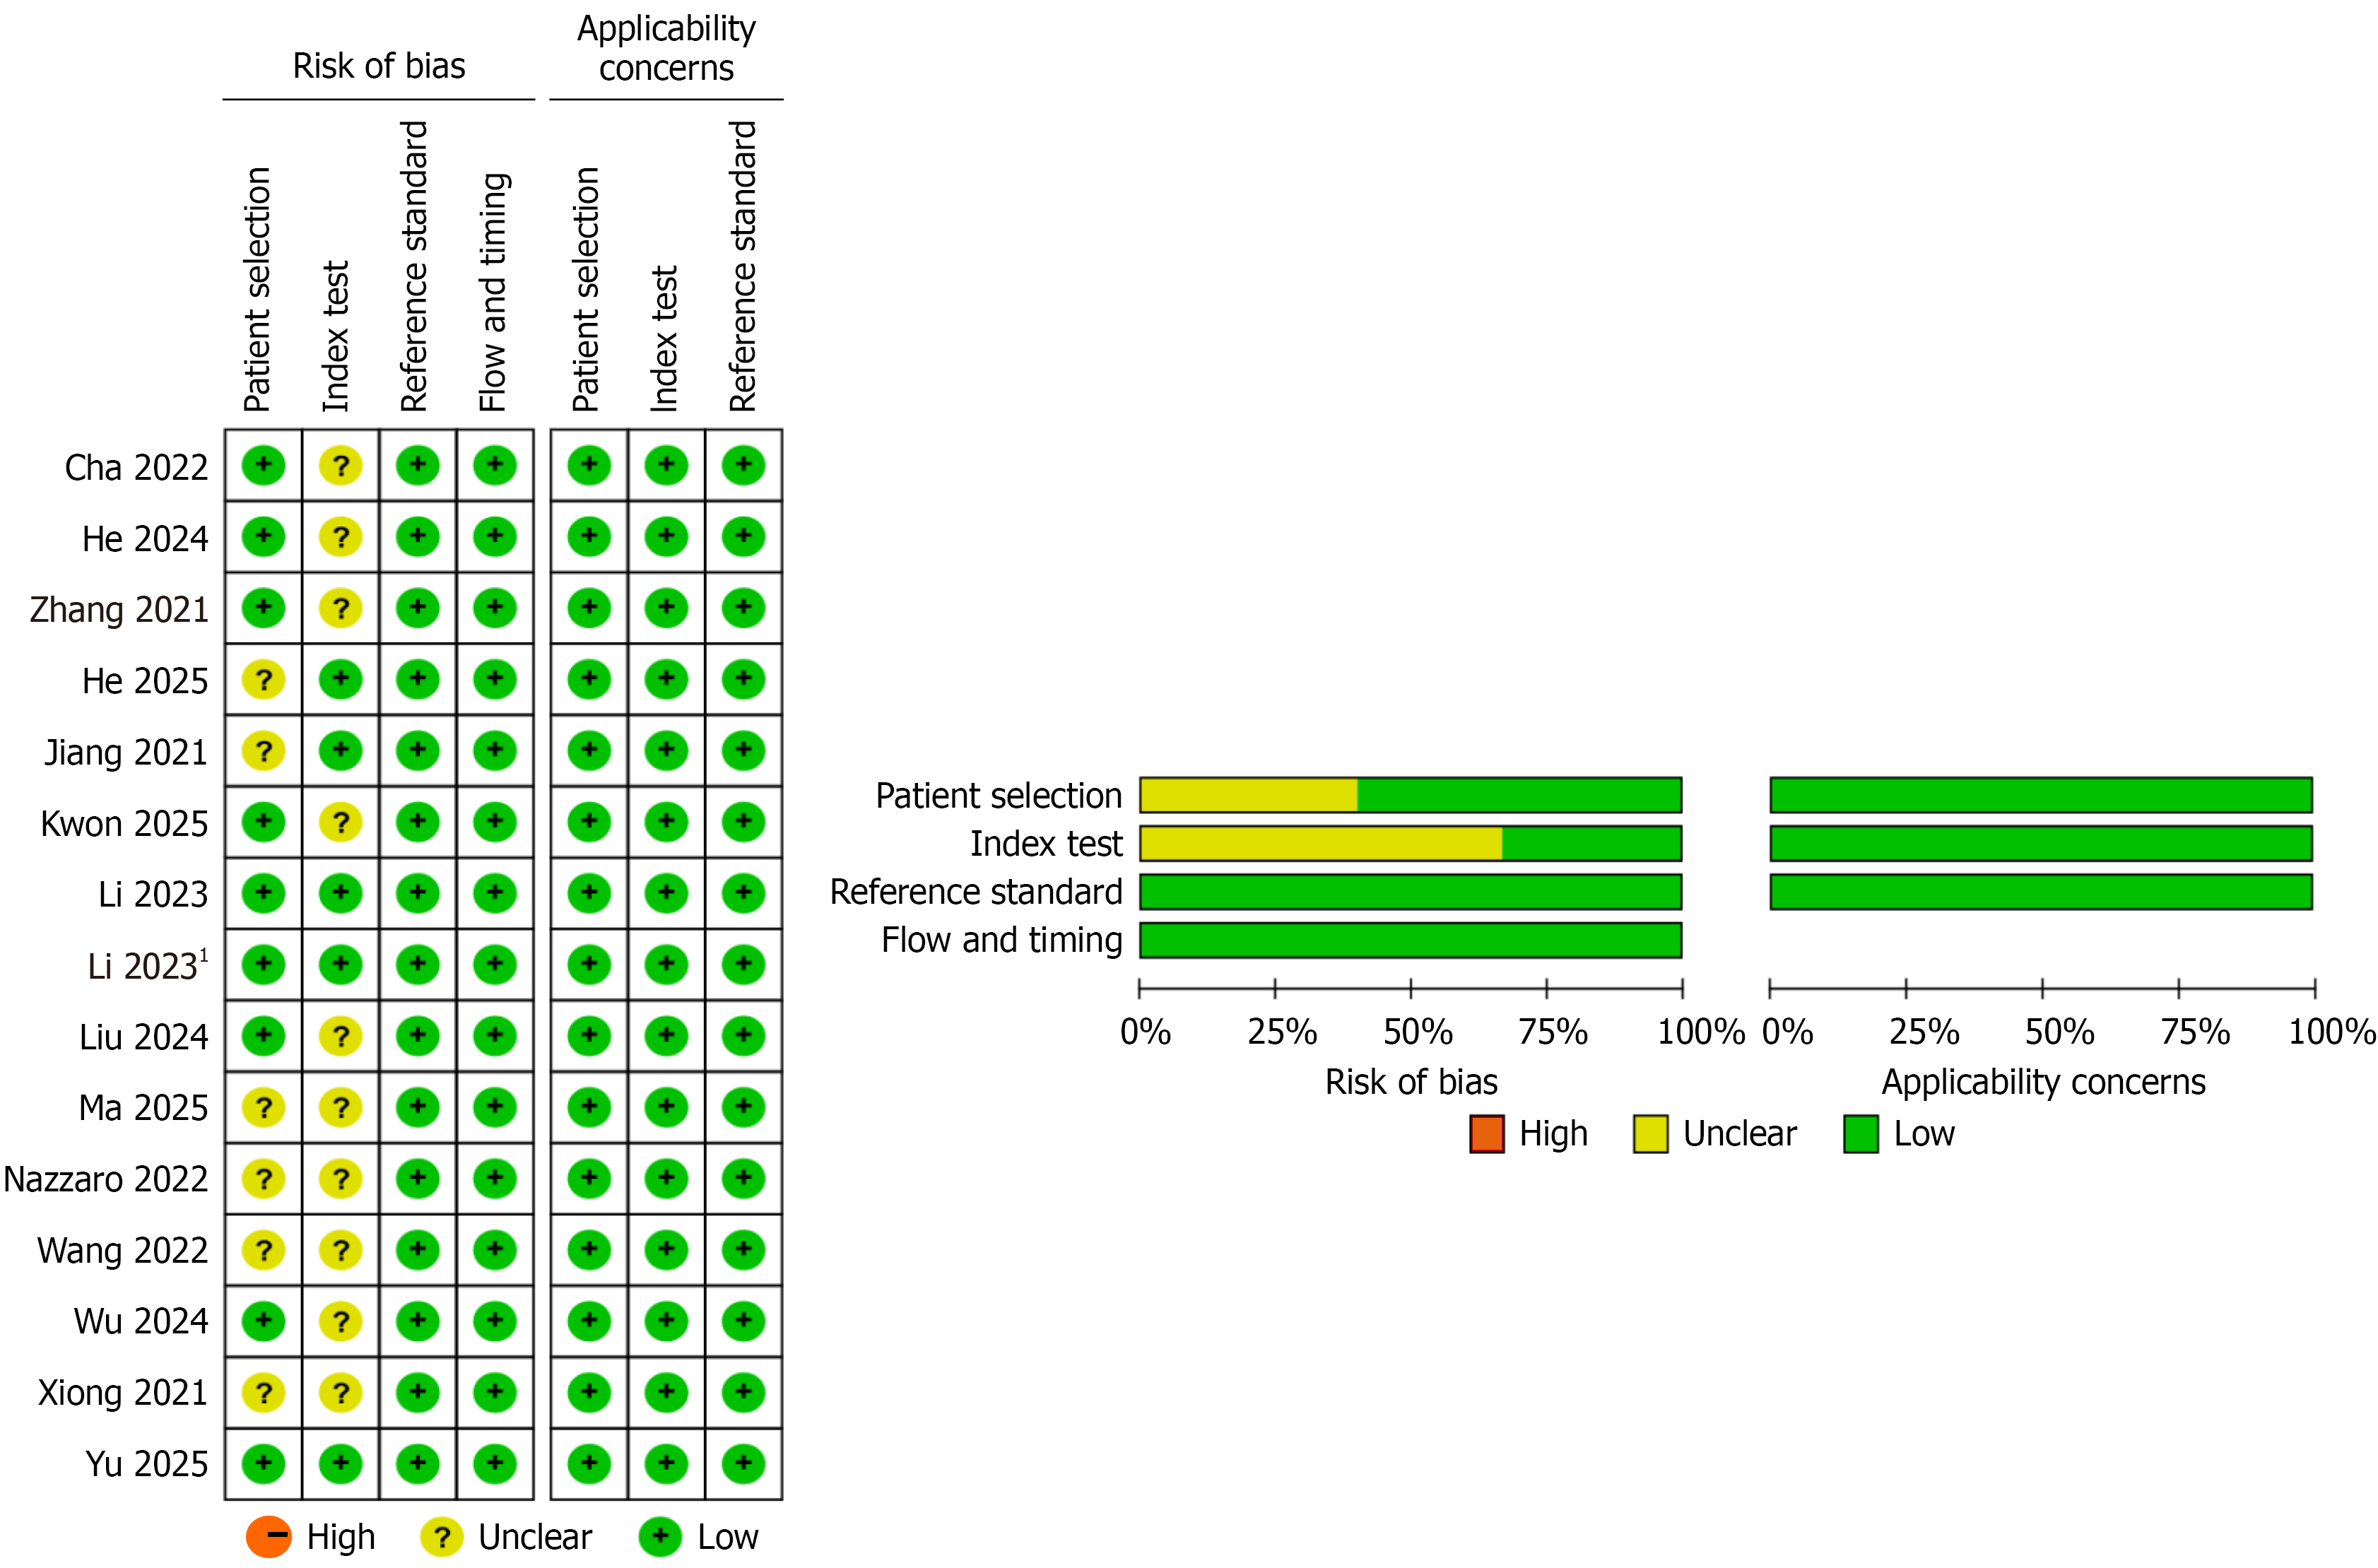
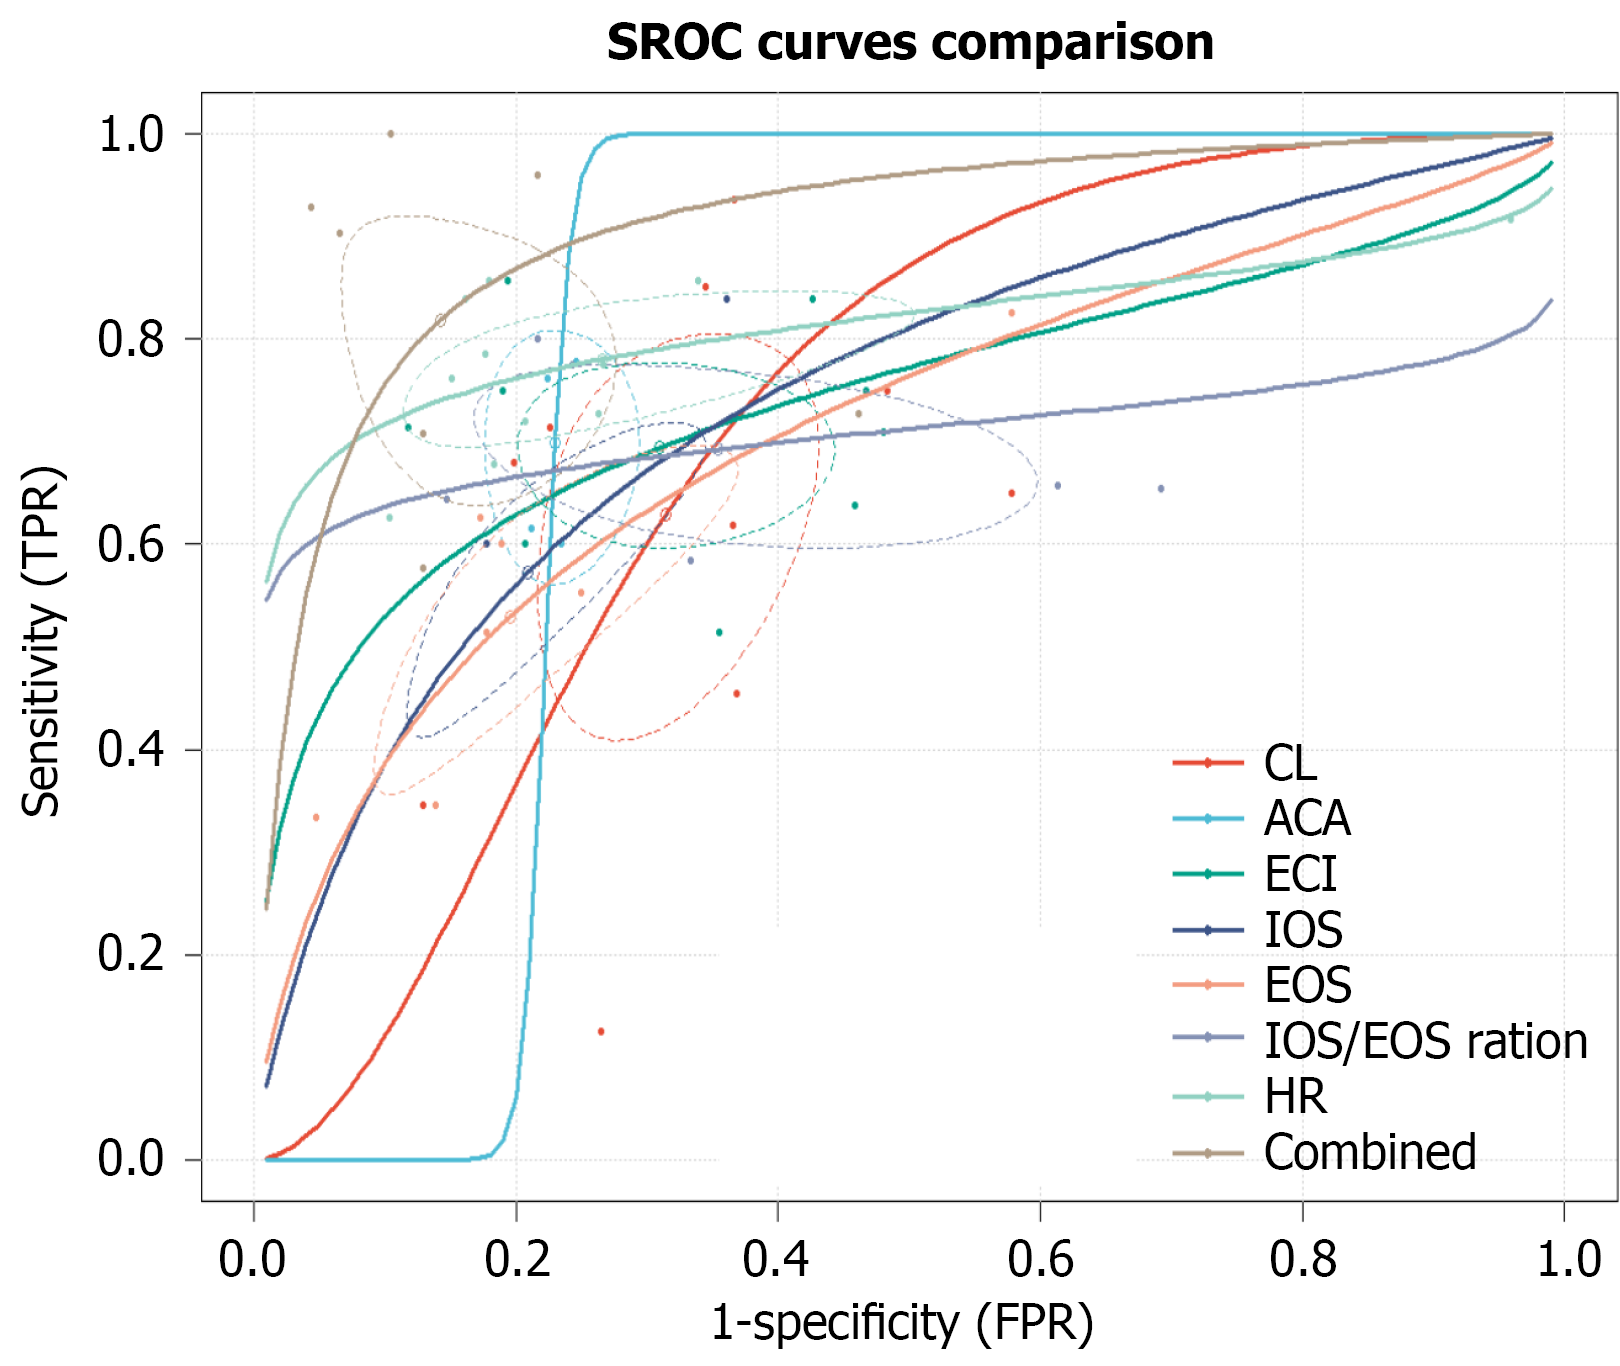
Figure 3 Summary receiver operating characteristic curves for preterm birth prediction.
Combined model (brown) shows the highest diagnostic accuracy; cervical length (red) is the lowest. Axes represent sensitivity and 1-specificity. SROC: Summary receiver operating characteristic; TPR: True positive rate; FPR: False positive rate; CL: Cervical length; ACA: Anterior cervical angle; ECI: Elasticity contrast index; IOS: Internal os strain; EOS: External os strain; HR: Hardness ratio.
- Citation: Zhang HP, Li N, Li F, Zhou YQ. Predictive performance of cervical elastography for preterm birth: A head-to-head network meta-analysis. World J Radiol 2026; 18(5): 119213
- URL: https://www.wjgnet.com/1949-8470/full/v18/i5/119213.htm
- DOI: https://dx.doi.org/10.4329/wjr.v18.i5.119213