©The Author(s) 2025.
World J Radiol. May 28, 2025; 17(5): 106084
Published online May 28, 2025. doi: 10.4329/wjr.v17.i5.106084
Published online May 28, 2025. doi: 10.4329/wjr.v17.i5.106084
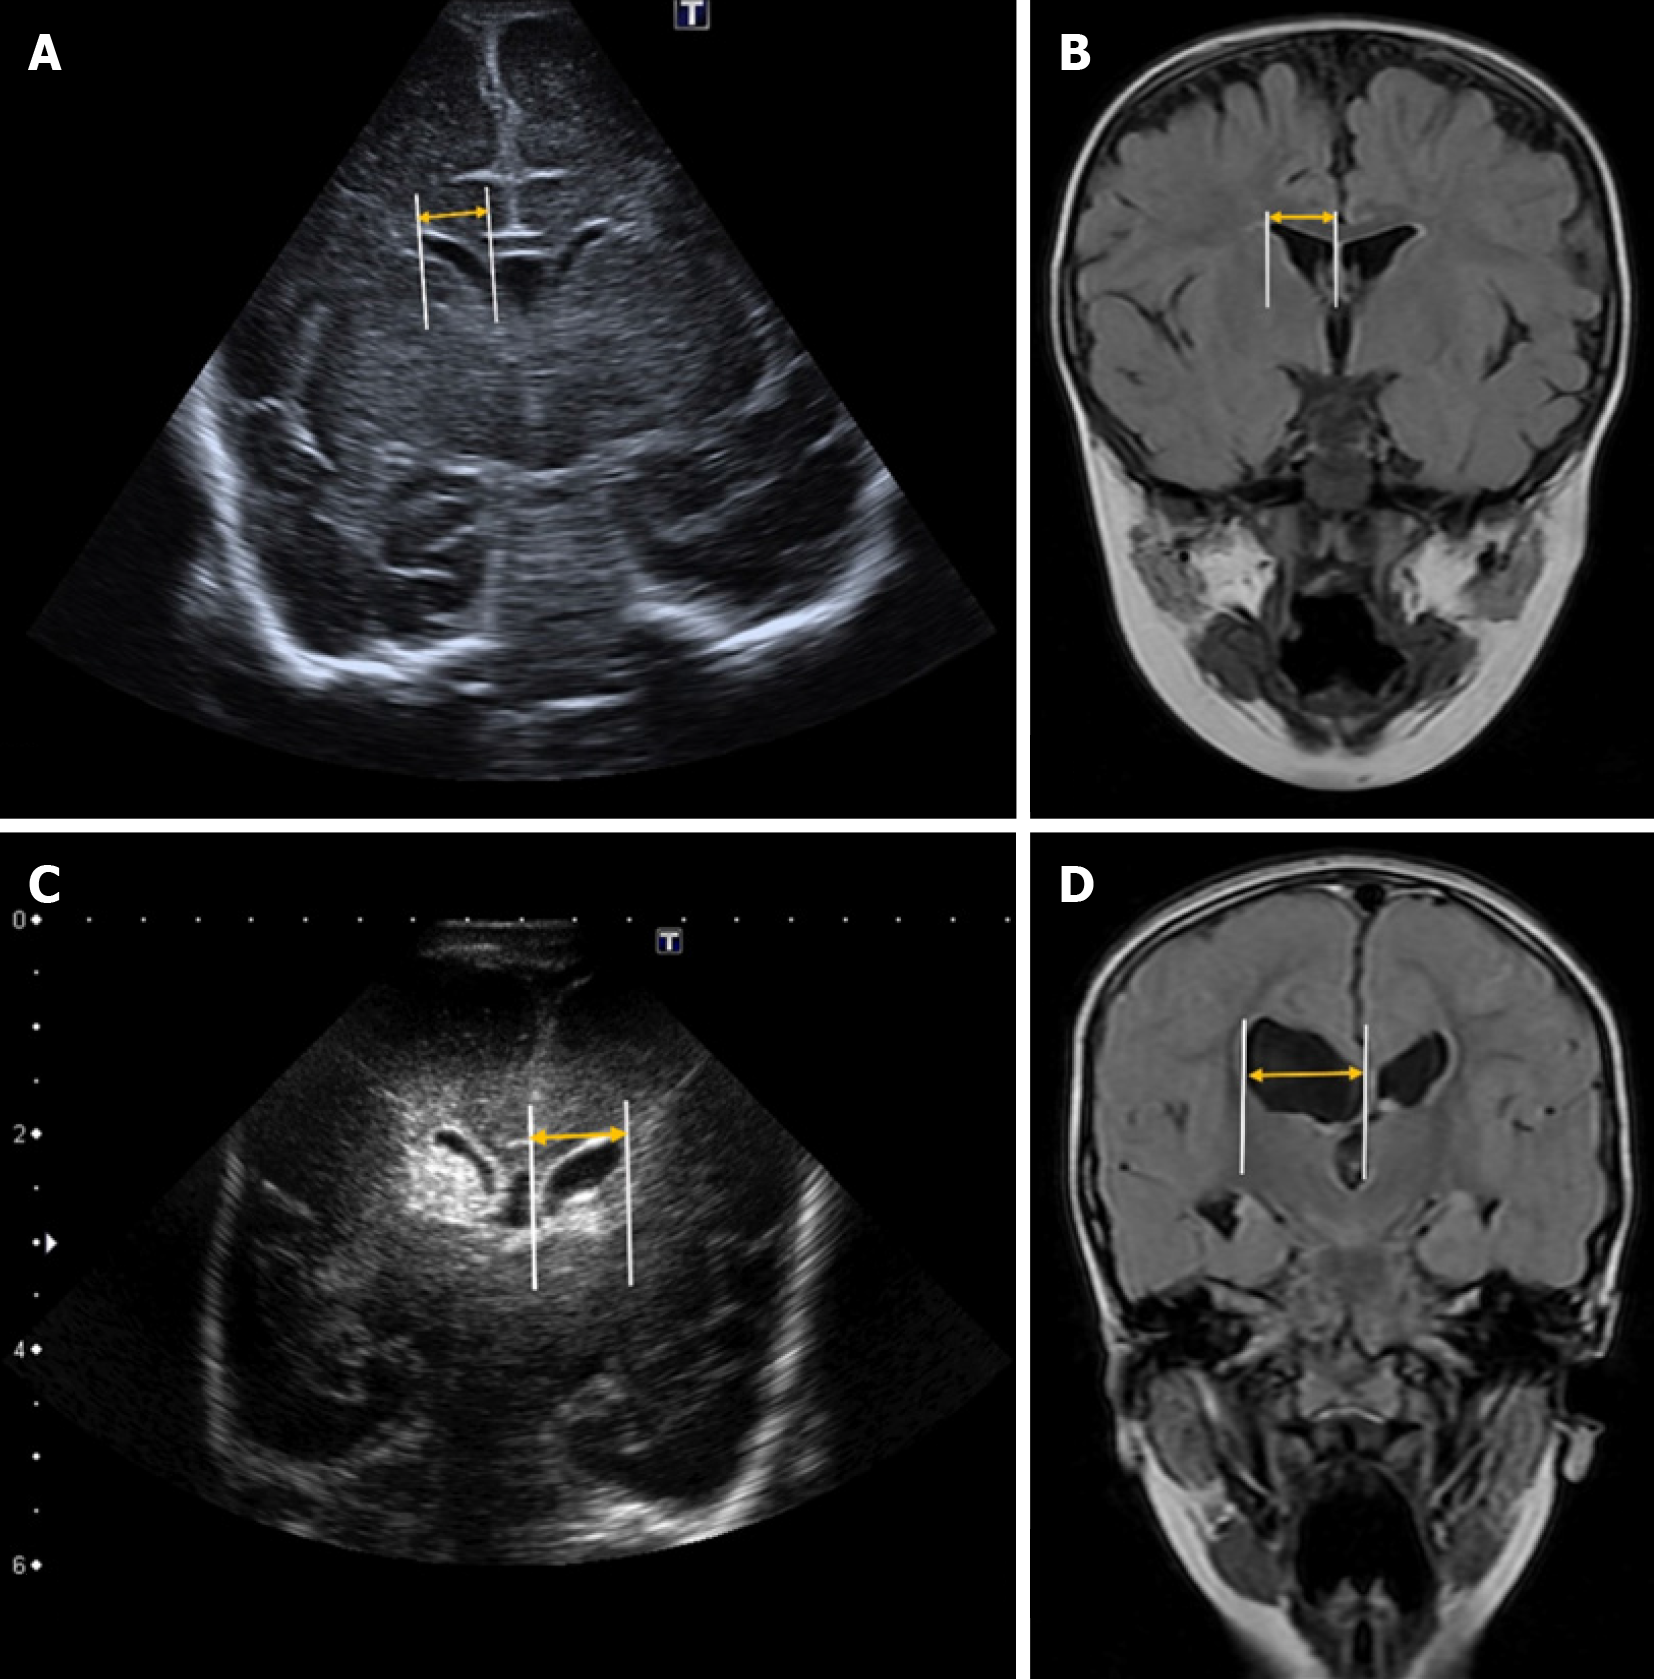
Figure 1 Levene’s index.
Coronal ultrasound and coronal magnetic resonance imaging (MRI) images at the level of the foramen of Monro illustrating Levene’s index. The measurement corresponds to the distance from the midline to the lateral wall of the anterior horn of the lateral ventricle (yellow arrow). A: Normal Levene’s index in a preterm infant (33 + 4 weeks) on coronal ultrasound; B: Normal Levene’s index in a 3-year-old child on coronal fluid-attenuated inversion recovery (FLAIR) MRI; C: Increased Levene’s index in a preterm infant (26 + 1 weeks) with hydrocephalus secondary to germinal matrix hemorrhage on coronal ultrasound; D: Increased Levene’s index in a 3-year-old child with asymmetric biventricular hydrocephalus due to perinatal ischemia on coronal FLAIR MRI.
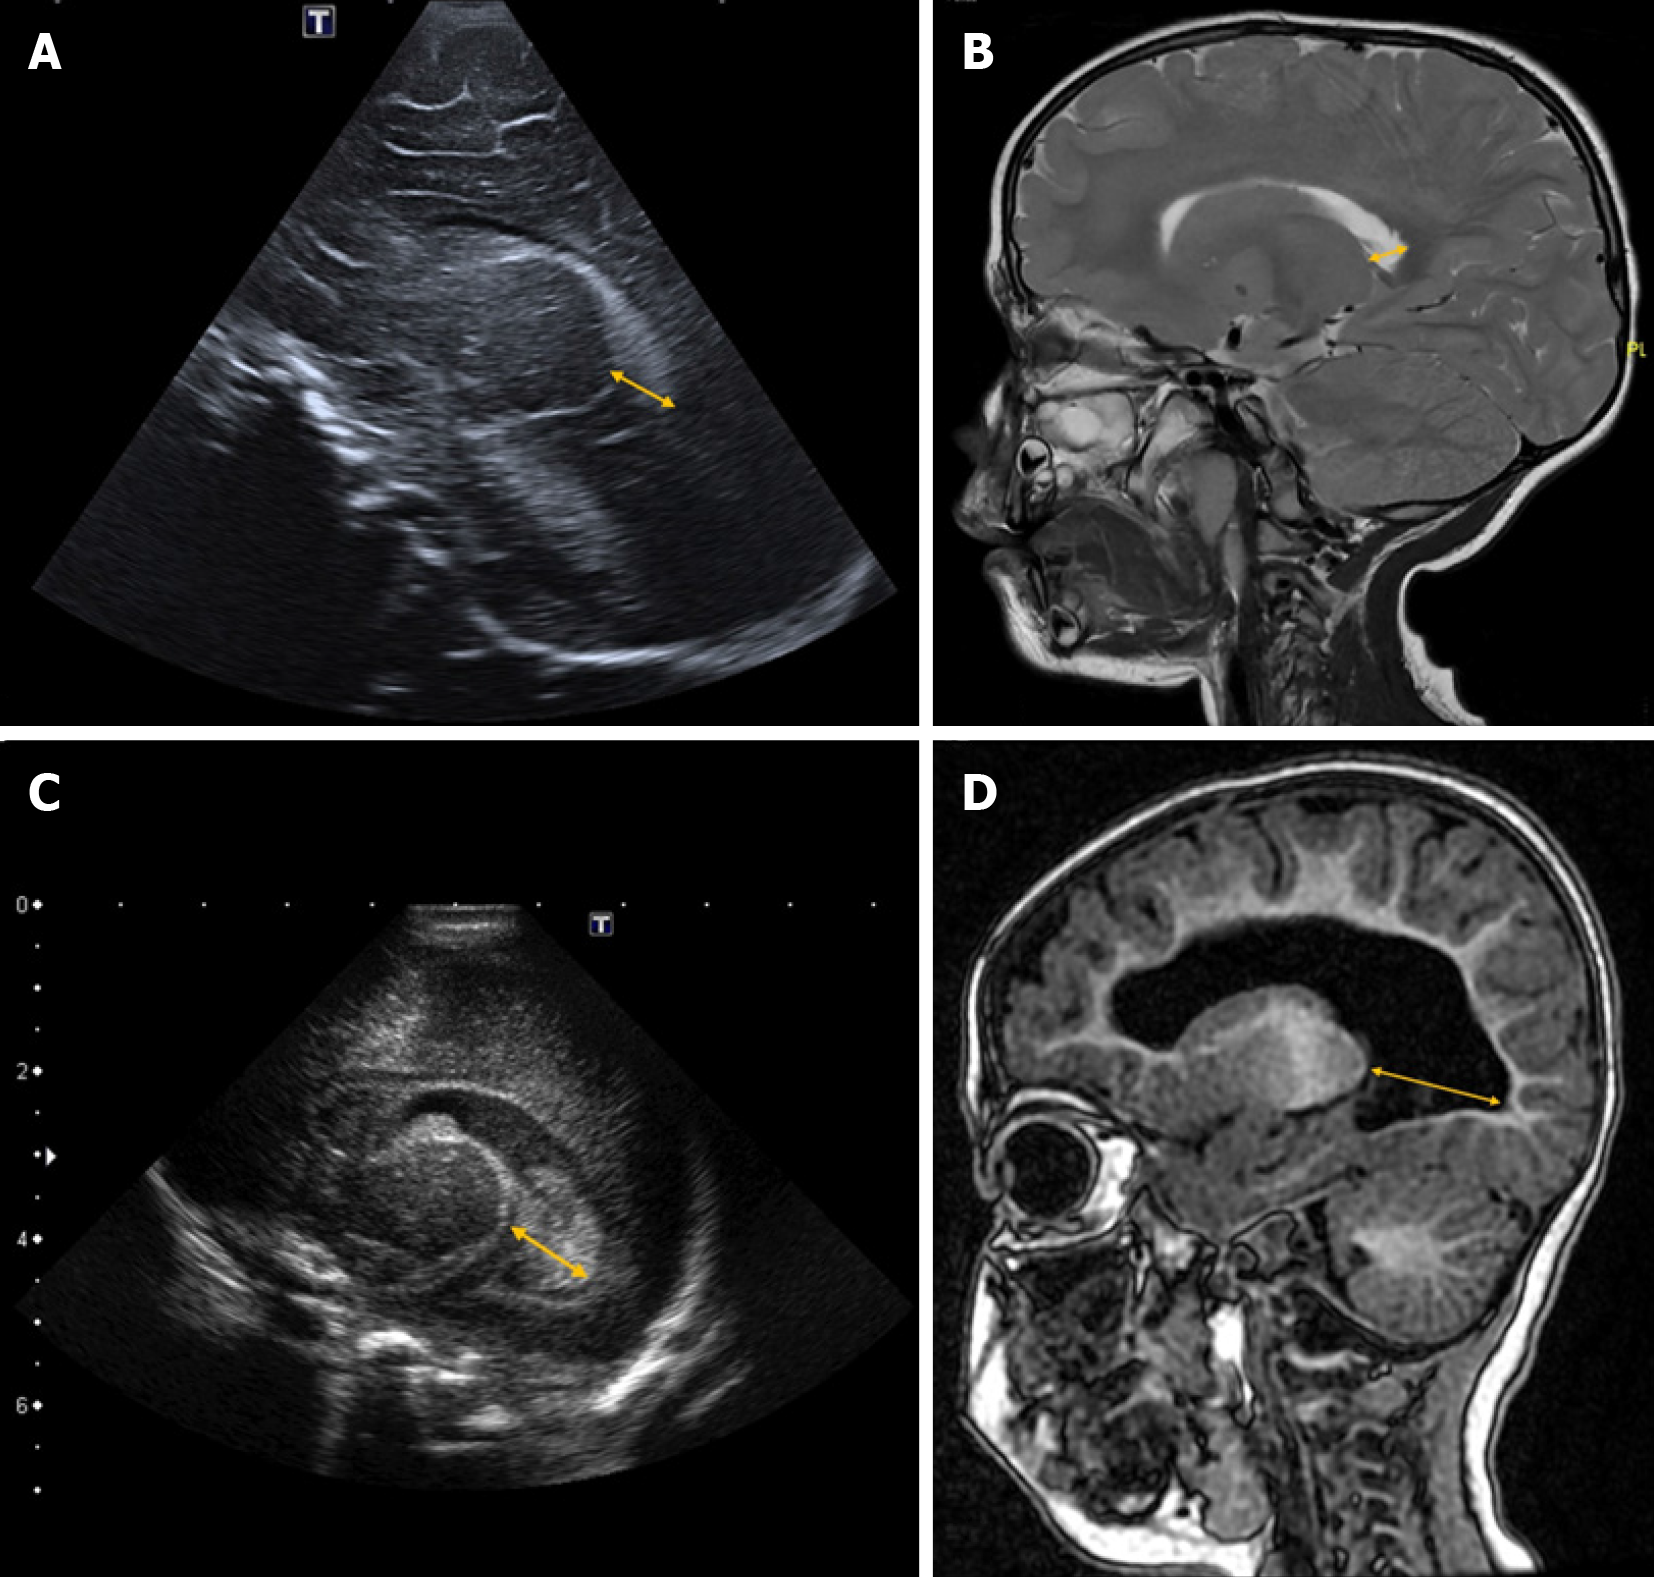
Figure 2 Thalamo-occipital distance.
Parasagittal ultrasound and sagittal magnetic resonance imaging (MRI) images illustrating the thalamo-occipital distance. The measurement corresponds to the distance between the posterior edge of the thalamus at its junction with the choroid plexus and the most external point of the occipital horn of the lateral ventricle (yellow arrow). A: Normal thalamo-occipital distance in a preterm infant (33 + 4 weeks) on parasagittal ultrasound; B: Normal thalamo-occipital distance in a 3-year-old child on sagittal T2-weighted MRI; C: Increased thalamo-occipital distance in a preterm infant (26 + 1 weeks) with hydrocephalus secondary to germinal matrix hemorrhage on parasagittal ultrasound; D: Increased thalamo-occipital distance in a 3-year-old child with asymmetric biventricular hydrocephalus due to perinatal ischemia on sagittal T1-weighted MRI.
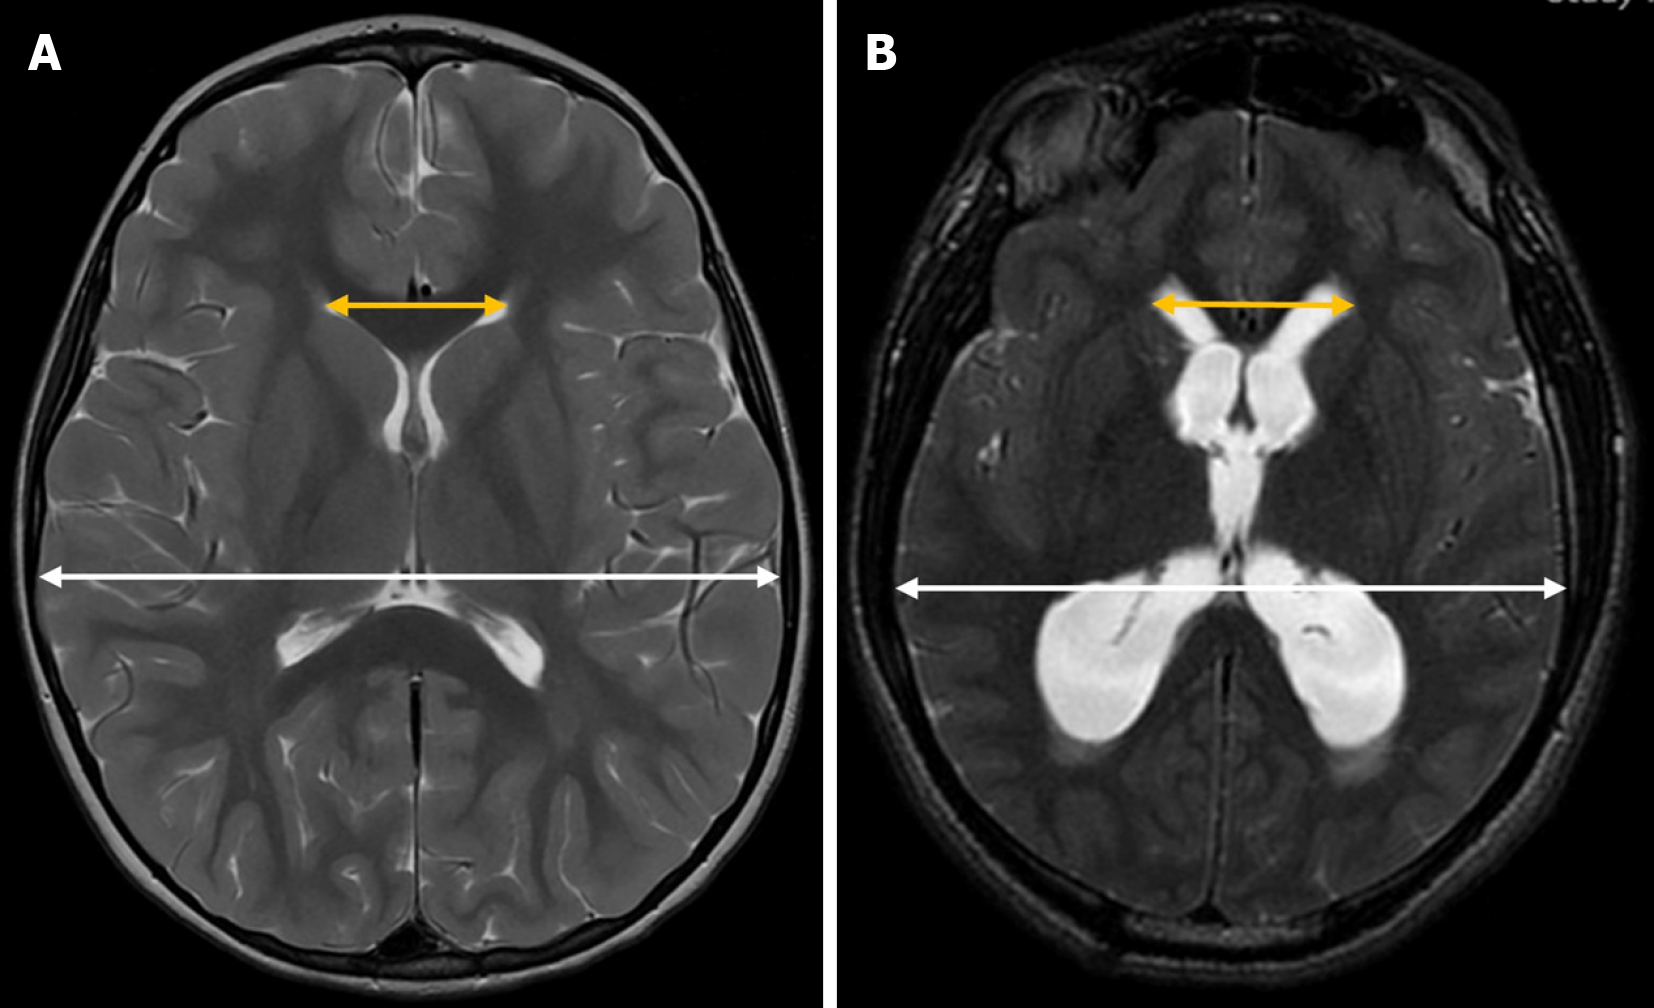
Figure 3 Evans’ index.
Axial T2-weighted magnetic resonance imaging illustrating Evans’ index. It is calculated by dividing the maximum width of the frontal horns of the lateral ventricles (yellow arrow) by the maximum cranial width (white arrow) in the same axial plane. A: Normal Evans’ index in a 4-year-old girl with a 4-week history of headache; B: Increased Evans’ index in a 15-year-old boy with supratentorial hydrocephalus due to an epidermoid cyst in the pineal gland.
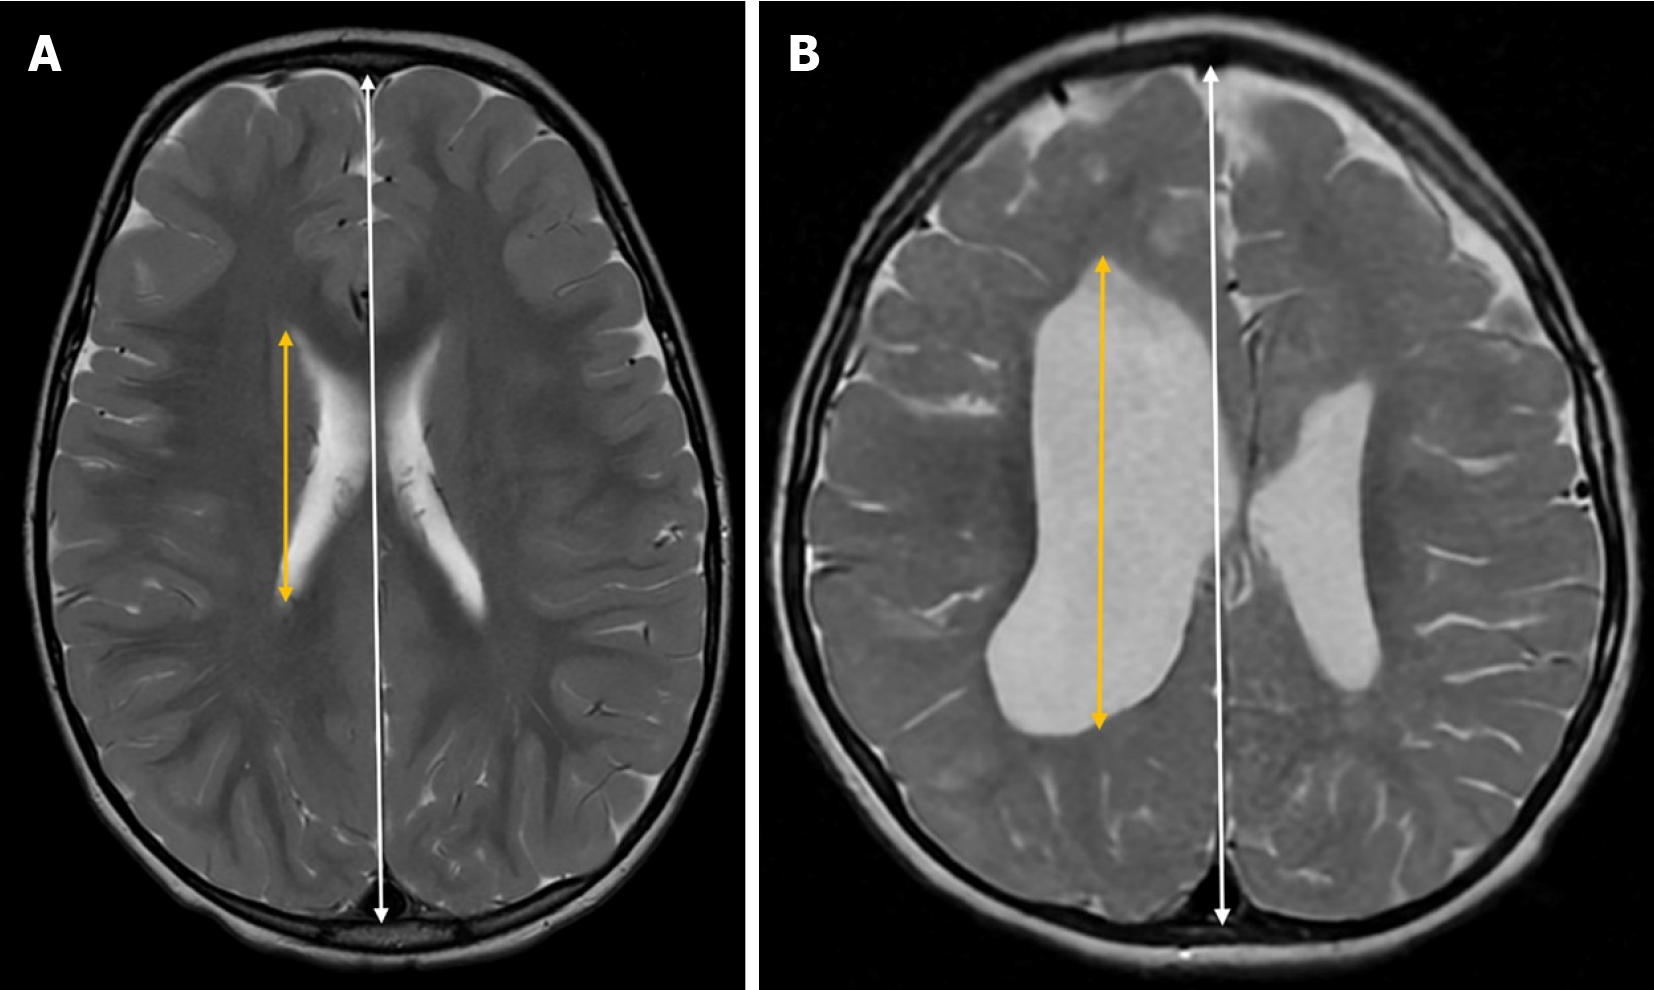
Figure 4 Anteroposterior lateral ventricle index.
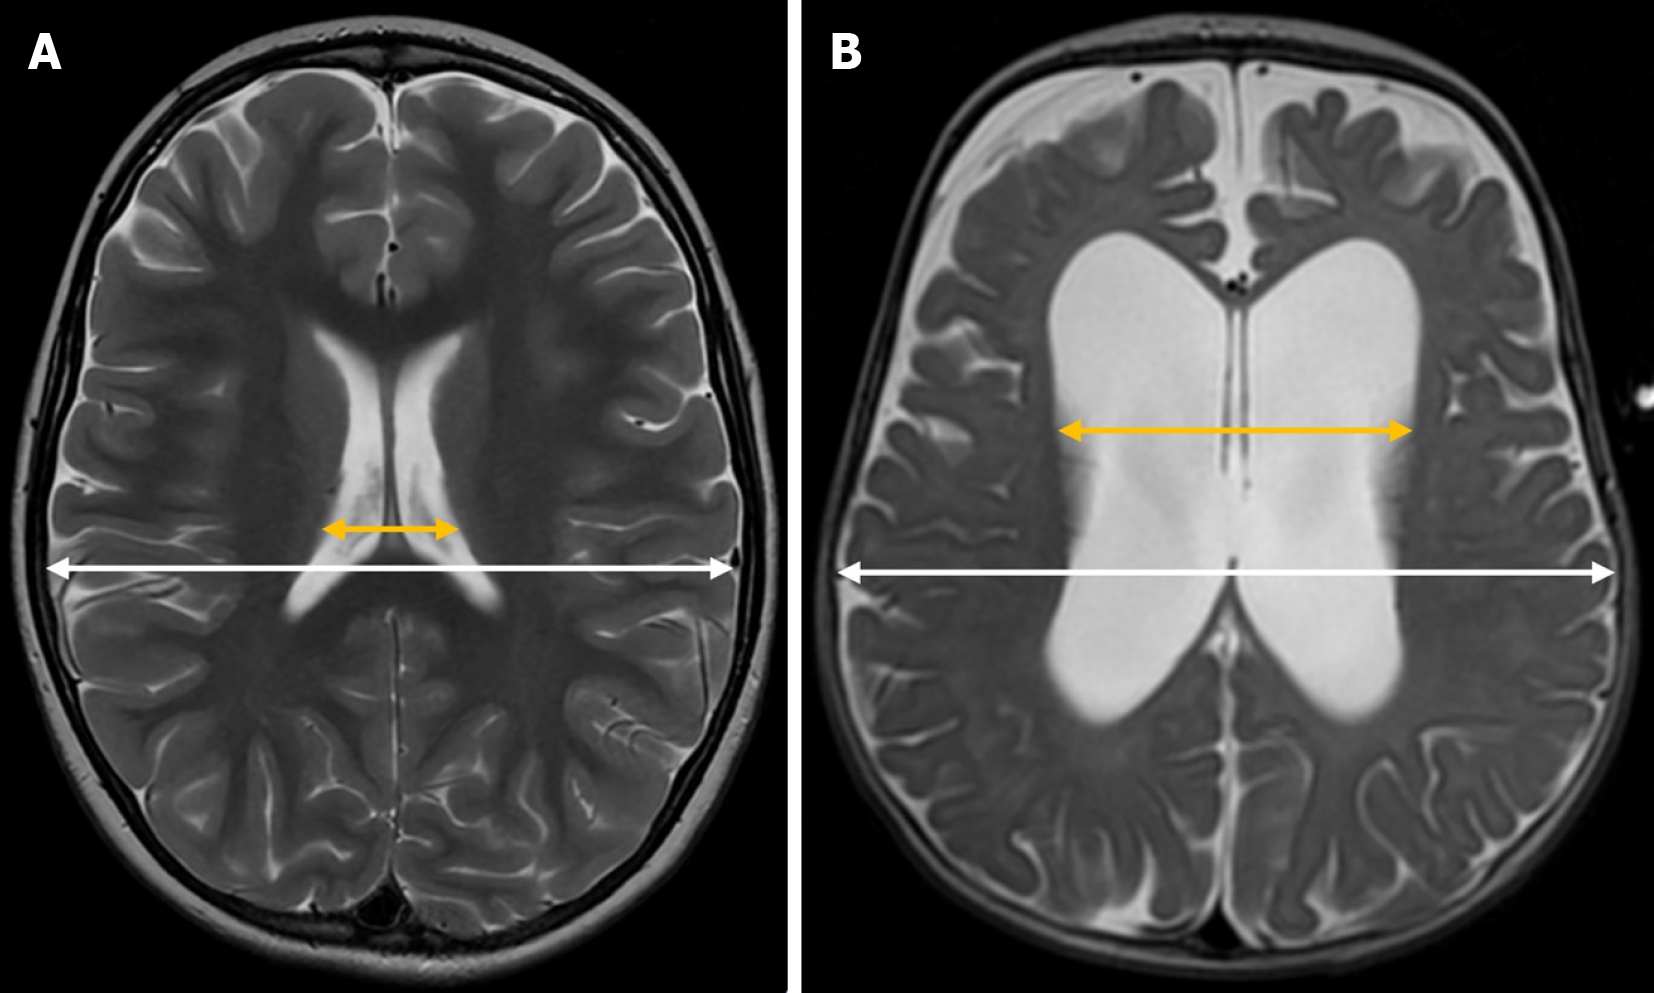
Axial T2-weighted magnetic resonance imaging illustrating the anteroposterior lateral ventricle index (ALVI). It is calculated by dividing the maximum anteroposterior diameter of the lateral ventricle (yellow arrow) by the maximum anteroposterior intracranial diameter (white arrow) in the same plane. A: Normal ALVI in a 3-year-old child; B: Increased ALVI in a 3-year-old child with asymmetric biventricular hydrocephalus due to perinatal ischemia.
Figure 5 Cella media index.
Axial T2-weighted magnetic resonance imaging illustrating the Cella media index. It is calculated by dividing the biparietal cranial diameter (white arrow) by the maximum external diameter of the central portions of the lateral ventricles (yellow arrow). A: Normal Cella media index in a 6-year-old girl with absence seizures and headache; B: Increased Cella media index in a 3-year-old boy with hydrocephalus due to compression from an arachnoid cyst in the right cerebellopontine angle.
Figure 6 Fronto-occipital horn ratio.
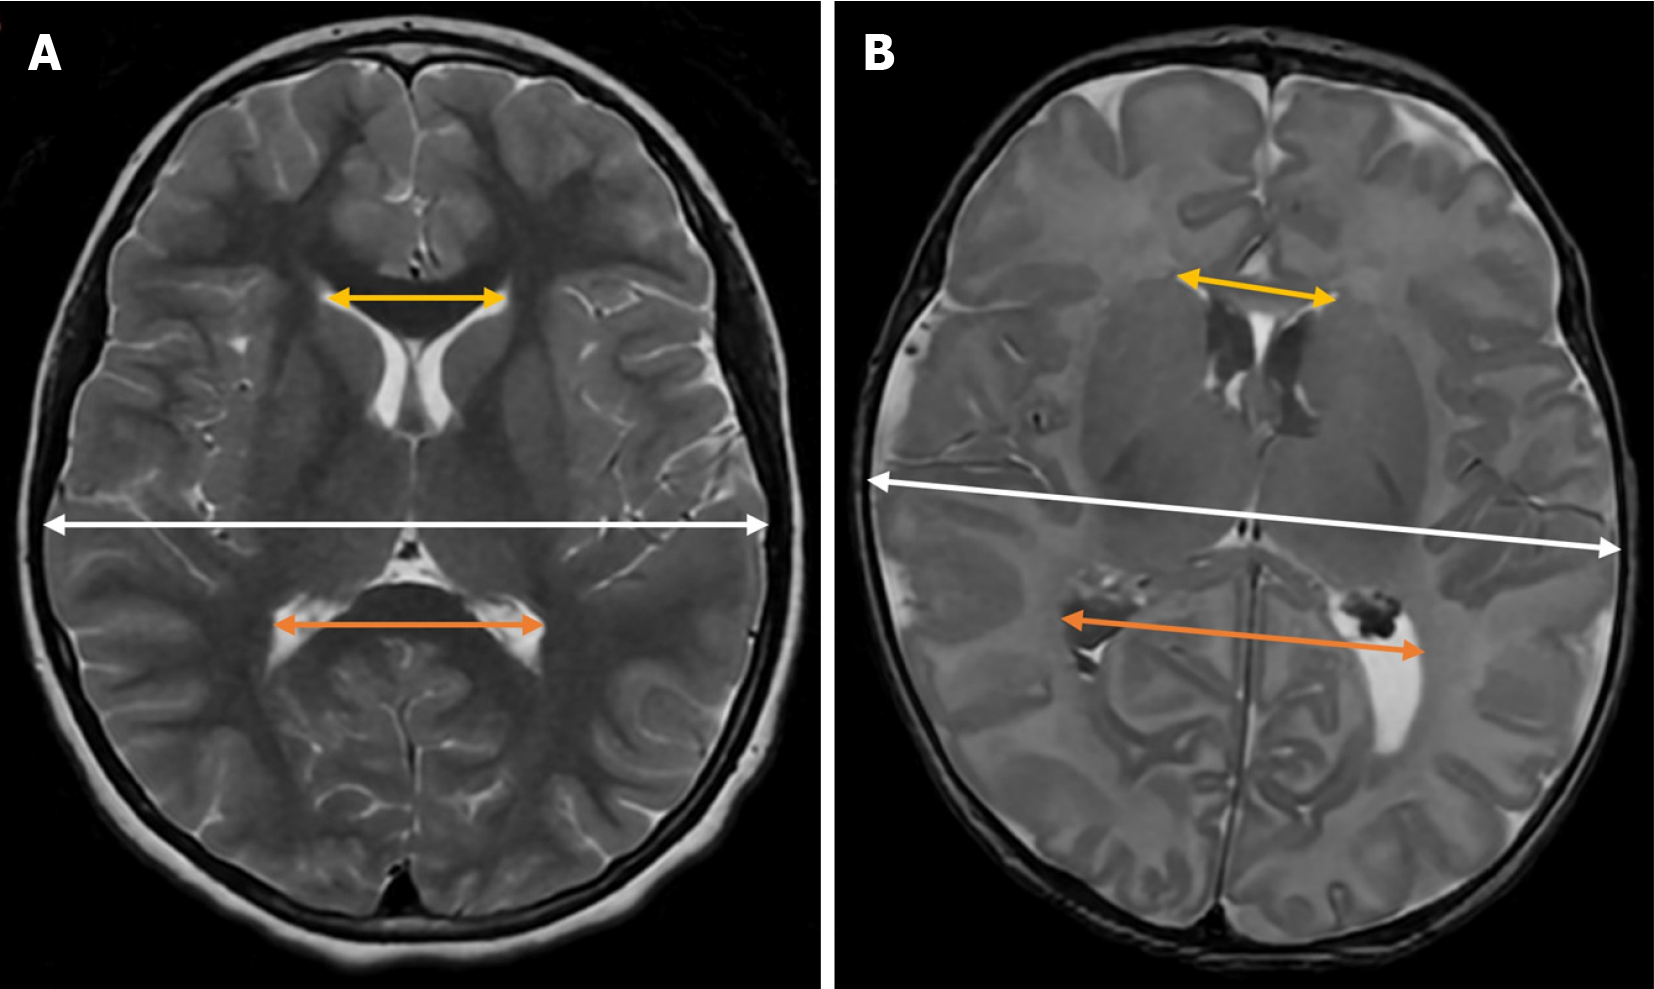
Axial T2-weighted magnetic resonance imaging illustrating the Fronto-occipital horn ratio (FOHR). It is calculated by adding the maximum diameters of the frontal (yellow arrow) and occipital (orange arrow) horns of the lateral ventricles at the level of the foramen of Monro and dividing this sum by twice the maximum intracranial biparietal diameter (white arrow). A: Normal FOHR in an 11-year-old girl with a 3-week history of headache; B: Increased FOHR in a 1-week-old full-term neonate with hydrocephalus due to intraventricular hemorrhage.
Figure 7 Bicaudate index.
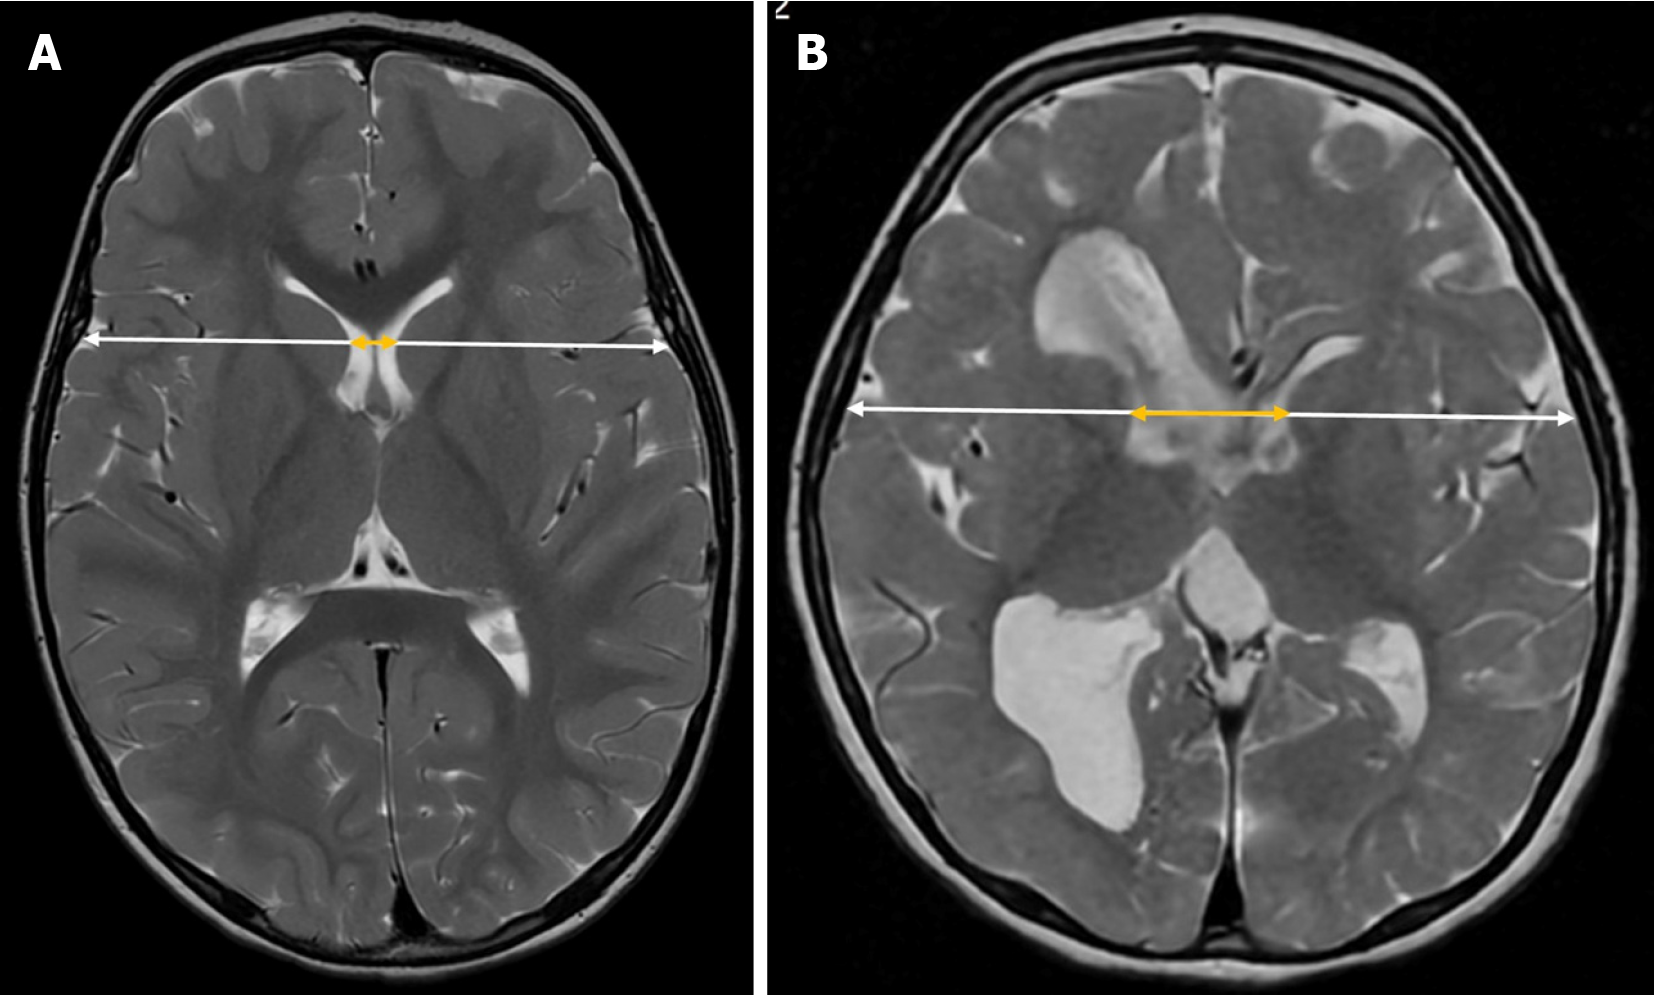
Axial T2-weighted magnetic resonance imaging illustrating the bicaudate index. It is calculated by dividing the distance between the most lateral portions of the frontal horns of the lateral ventricles at the level of the caudate nuclei (yellow arrow) by the transverse brain diameter at the same level (white arrow). A: Normal bicaudate index in a 3-year-old child; B: Increased bicaudate index in a 3-year-old child with asymmetric biventricular hydrocephalus due to perinatal ischemia.
- Citation: Navarro-Ballester A, Álvaro-Ballester R, Lara-Martínez MÁ. Imaging biomarkers for detection and longitudinal monitoring of ventricular abnormalities from birth to childhood. World J Radiol 2025; 17(5): 106084
- URL: https://www.wjgnet.com/1949-8470/full/v17/i5/106084.htm
- DOI: https://dx.doi.org/10.4329/wjr.v17.i5.106084


