Copyright
©The Author(s) 2023.
World J Radiol. Sep 28, 2023; 15(9): 256-273
Published online Sep 28, 2023. doi: 10.4329/wjr.v15.i9.256
Published online Sep 28, 2023. doi: 10.4329/wjr.v15.i9.256
Figure 1 PRISMA flow chart for literature search.
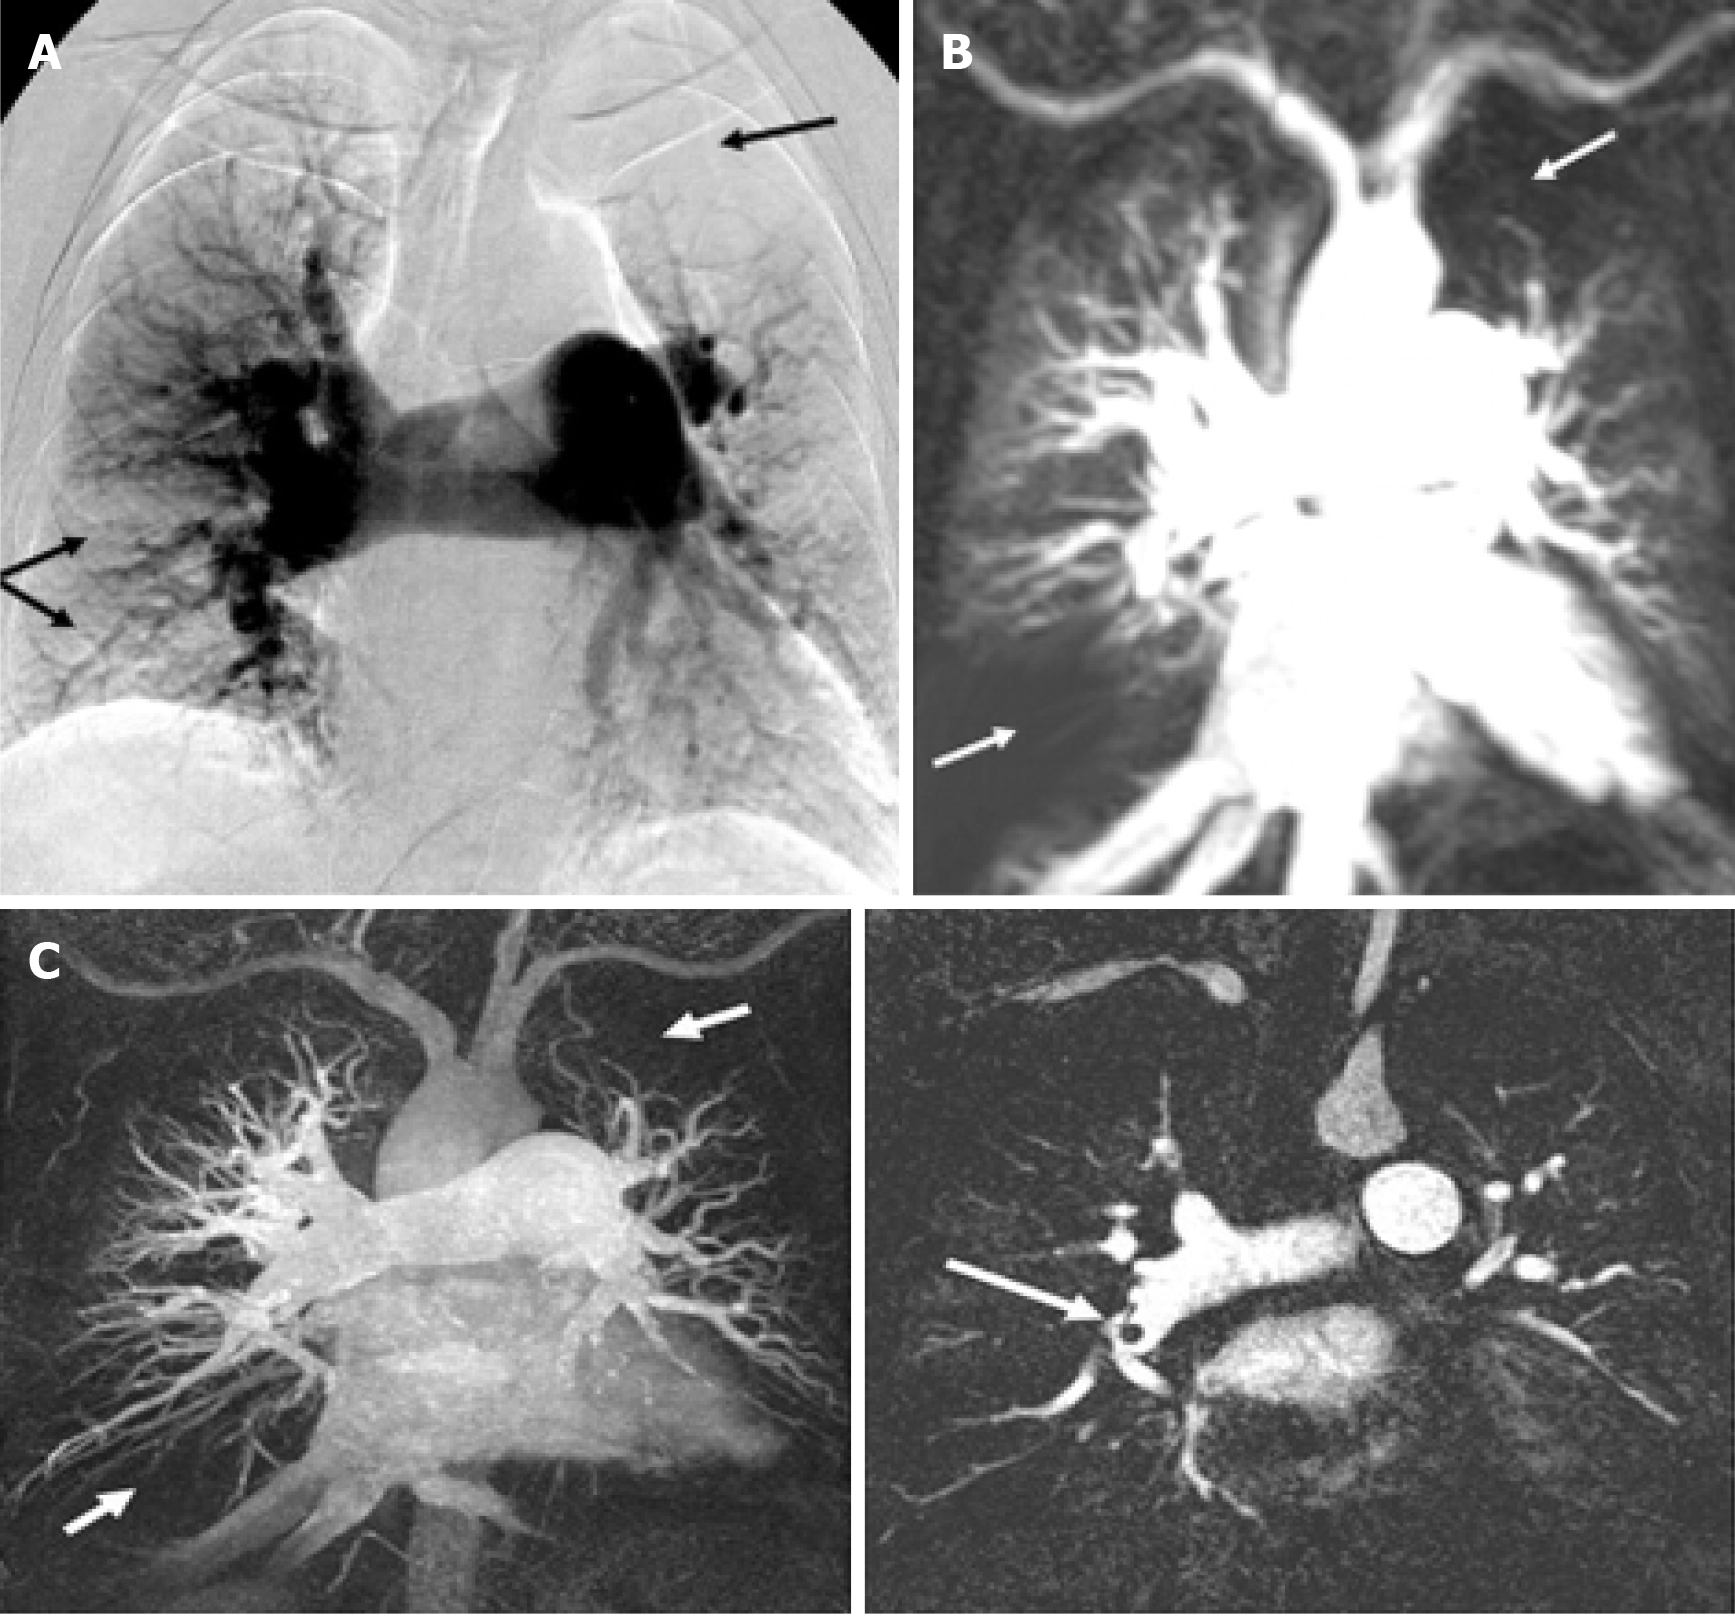
Figure 2 Comparing digital subtraction angiography, pulmonary perfusion magnetic resonance imaging and magnetic resonance angiography for identifying perfusion defects in chronic thromboembolic pulmonary hypertension patient.
A: Digital subtraction angiography showing perfusion defects (arrows) in left upper lobe and right lower lobe due to thromboembolic occlusion; B: Magnetic resonance imaging perfusion image at peak enhancement showing hypo-intense perfusion defects at same locations; C: Magnetic resonance angiogram of the same patient demonstrating dark thromboembolic material in the right pulmonary artery corresponding to perfusion defects at the same location. Citation: Nikolaou K, Schoenberg SO, Attenberger U, Scheidler J, Dietrich O, Kuehn B, Rosa F, Huber A, Leuchte H, Baumgartner R, Behr J, Reiser MF. Pulmonary arterial hypertension: diagnosis with fast perfusion MR imaging and high-spatial-resolution MR angiography--preliminary experience. Radiology 2005; 236: 694-703 [PMID: 15994997 DOI: 10.1148/radiol.2361040502].
Figure 3 Comparing single photon emission computed tomography and dynamic contract enhanced perfusion magnetic resonance imaging for identifying perfusion defects in chronic thromboembolic pulmonary hypertension patient.
Left to right, single photon emission computed tomography and Perfusion magnetic resonance imaging (MRI) at peak enhancement of a chronic thromboembolic pulmonary hypertension patient showing perfusion defects in right and left lower lobes. On the right, semi-quantitative pulmonary blood flow, pulmonary blood volume & mean transit time maps acquired from perfusion MRI demonstrating reduced flow at the same locations. Note left to right scale depicting lower to higher pulmonary blood flow values. Citation: Johns CS, Swift AJ, Rajaram S, Hughes PJC, Capener DJ, Kiely DG, Wild JM. Lung perfusion: MRI vs. SPECT for screening in suspected chronic thromboembolic pulmonary hypertension. J Magn Reson Imaging 2017; 46: 1693-1697 [PMID: 28376242 DOI: 10.1002/jmri.25714].
Figure 4 Comparing computed tomography chest and dynamic contract enhanced perfusion magnetic resonance imaging for identifying perfusion defects in pulmonary hypertension patient with COPD.
A: Chest computed tomography showing lobular emphysema in the lungs; B-D: Quantitative perfusion maps (anterior to posterior) showing heterogeneously reduced pulmonary blood flow, pulmonary blood volume and mean transit time respectively representing thromboembolic occlusion in respective pulmonary segments. Note on the right-hand side, quantitative scale from top to bottom showing higher to lower quantitative values. Citation: Ohno Y, Hatabu H, Murase K, Higashino T, Kawamitsu H, Watanabe H, Takenaka D, Fujii M, Sugimura K. Quantitative assessment of regional pulmonary perfusion in the entire lung using three-dimensional ultrafast dynamic contrast-enhanced magnetic resonance imaging: Preliminary experience in 40 subjects. J Magn Reson Imaging 2004; 20: 353-365 [PMID: 15332240 DOI: 10.1002/jmri.20137].
- Citation: Lacharie M, Villa A, Milidonis X, Hasaneen H, Chiribiri A, Benedetti G. Role of pulmonary perfusion magnetic resonance imaging for the diagnosis of pulmonary hypertension: A review. World J Radiol 2023; 15(9): 256-273
- URL: https://www.wjgnet.com/1949-8470/full/v15/i9/256.htm
- DOI: https://dx.doi.org/10.4329/wjr.v15.i9.256


