Copyright
©The Author(s) 2023.
World J Radiol. Aug 28, 2023; 15(8): 241-249
Published online Aug 28, 2023. doi: 10.4329/wjr.v15.i8.241
Published online Aug 28, 2023. doi: 10.4329/wjr.v15.i8.241
Figure 1 Coronal [(18)F]fluorodeoxyglucose positron emission tomography/computed tomography showing example of region of interest analysis on an abdominal aortic graft (arrow).
A: Non-contrast computed tomography (CT); B: Positron emission tomography (PET); C: Fused PET/CT images.
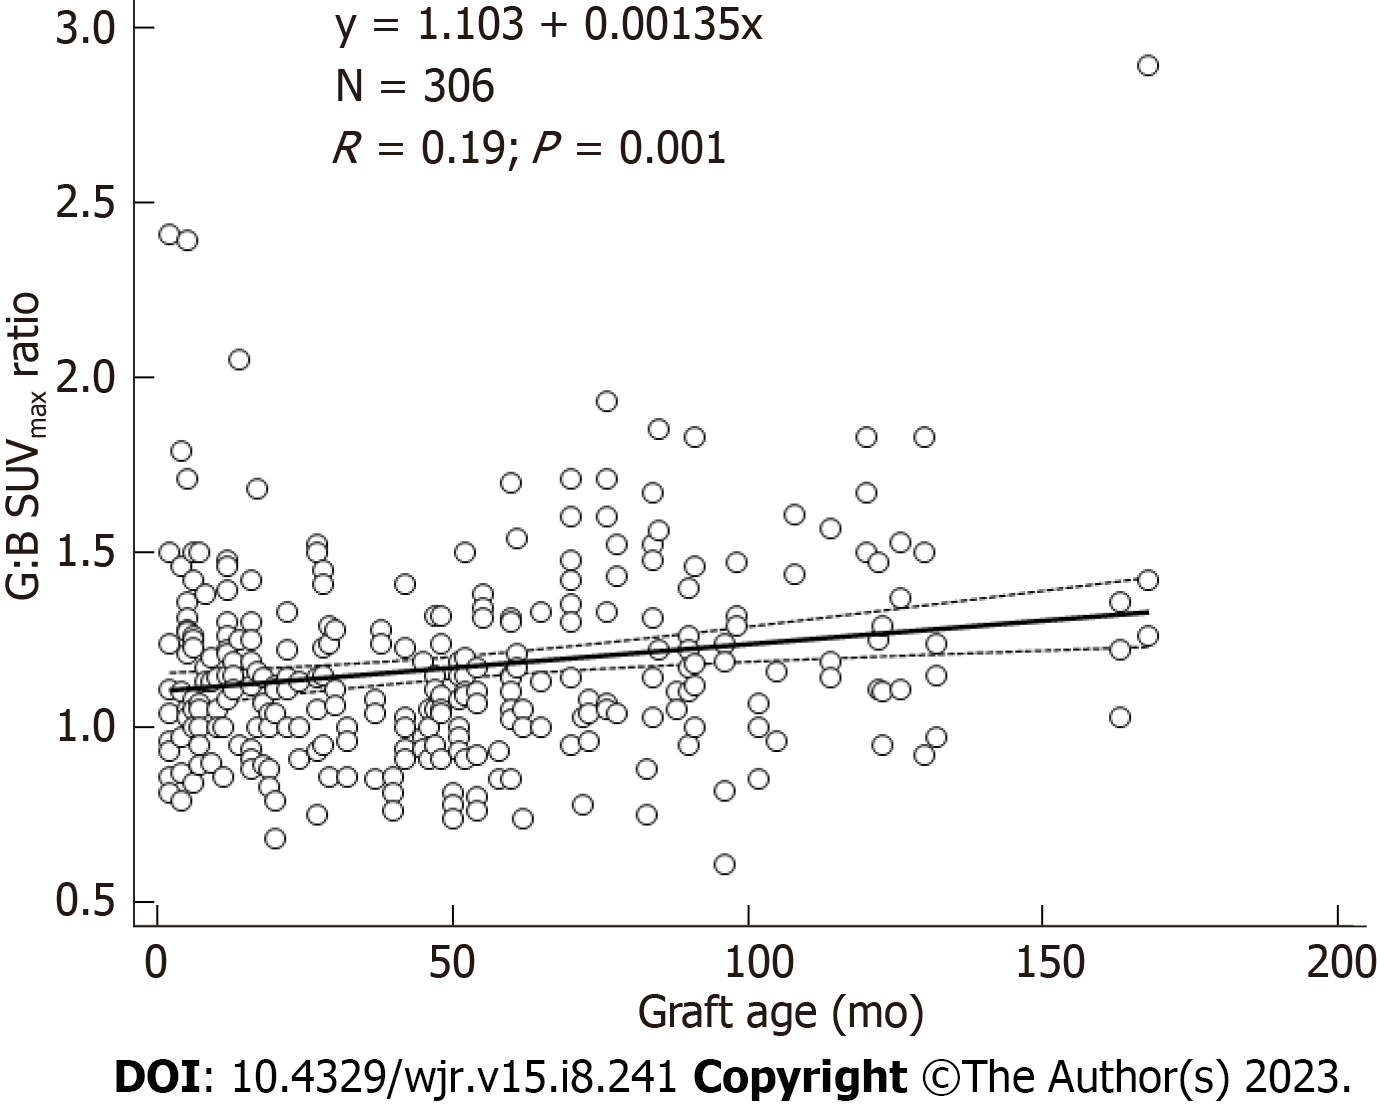
Figure 2 Graft uptake ratios vs graft age in months for abdominal aortic grafts.
SUVmax: Maximum standardized uptake value.
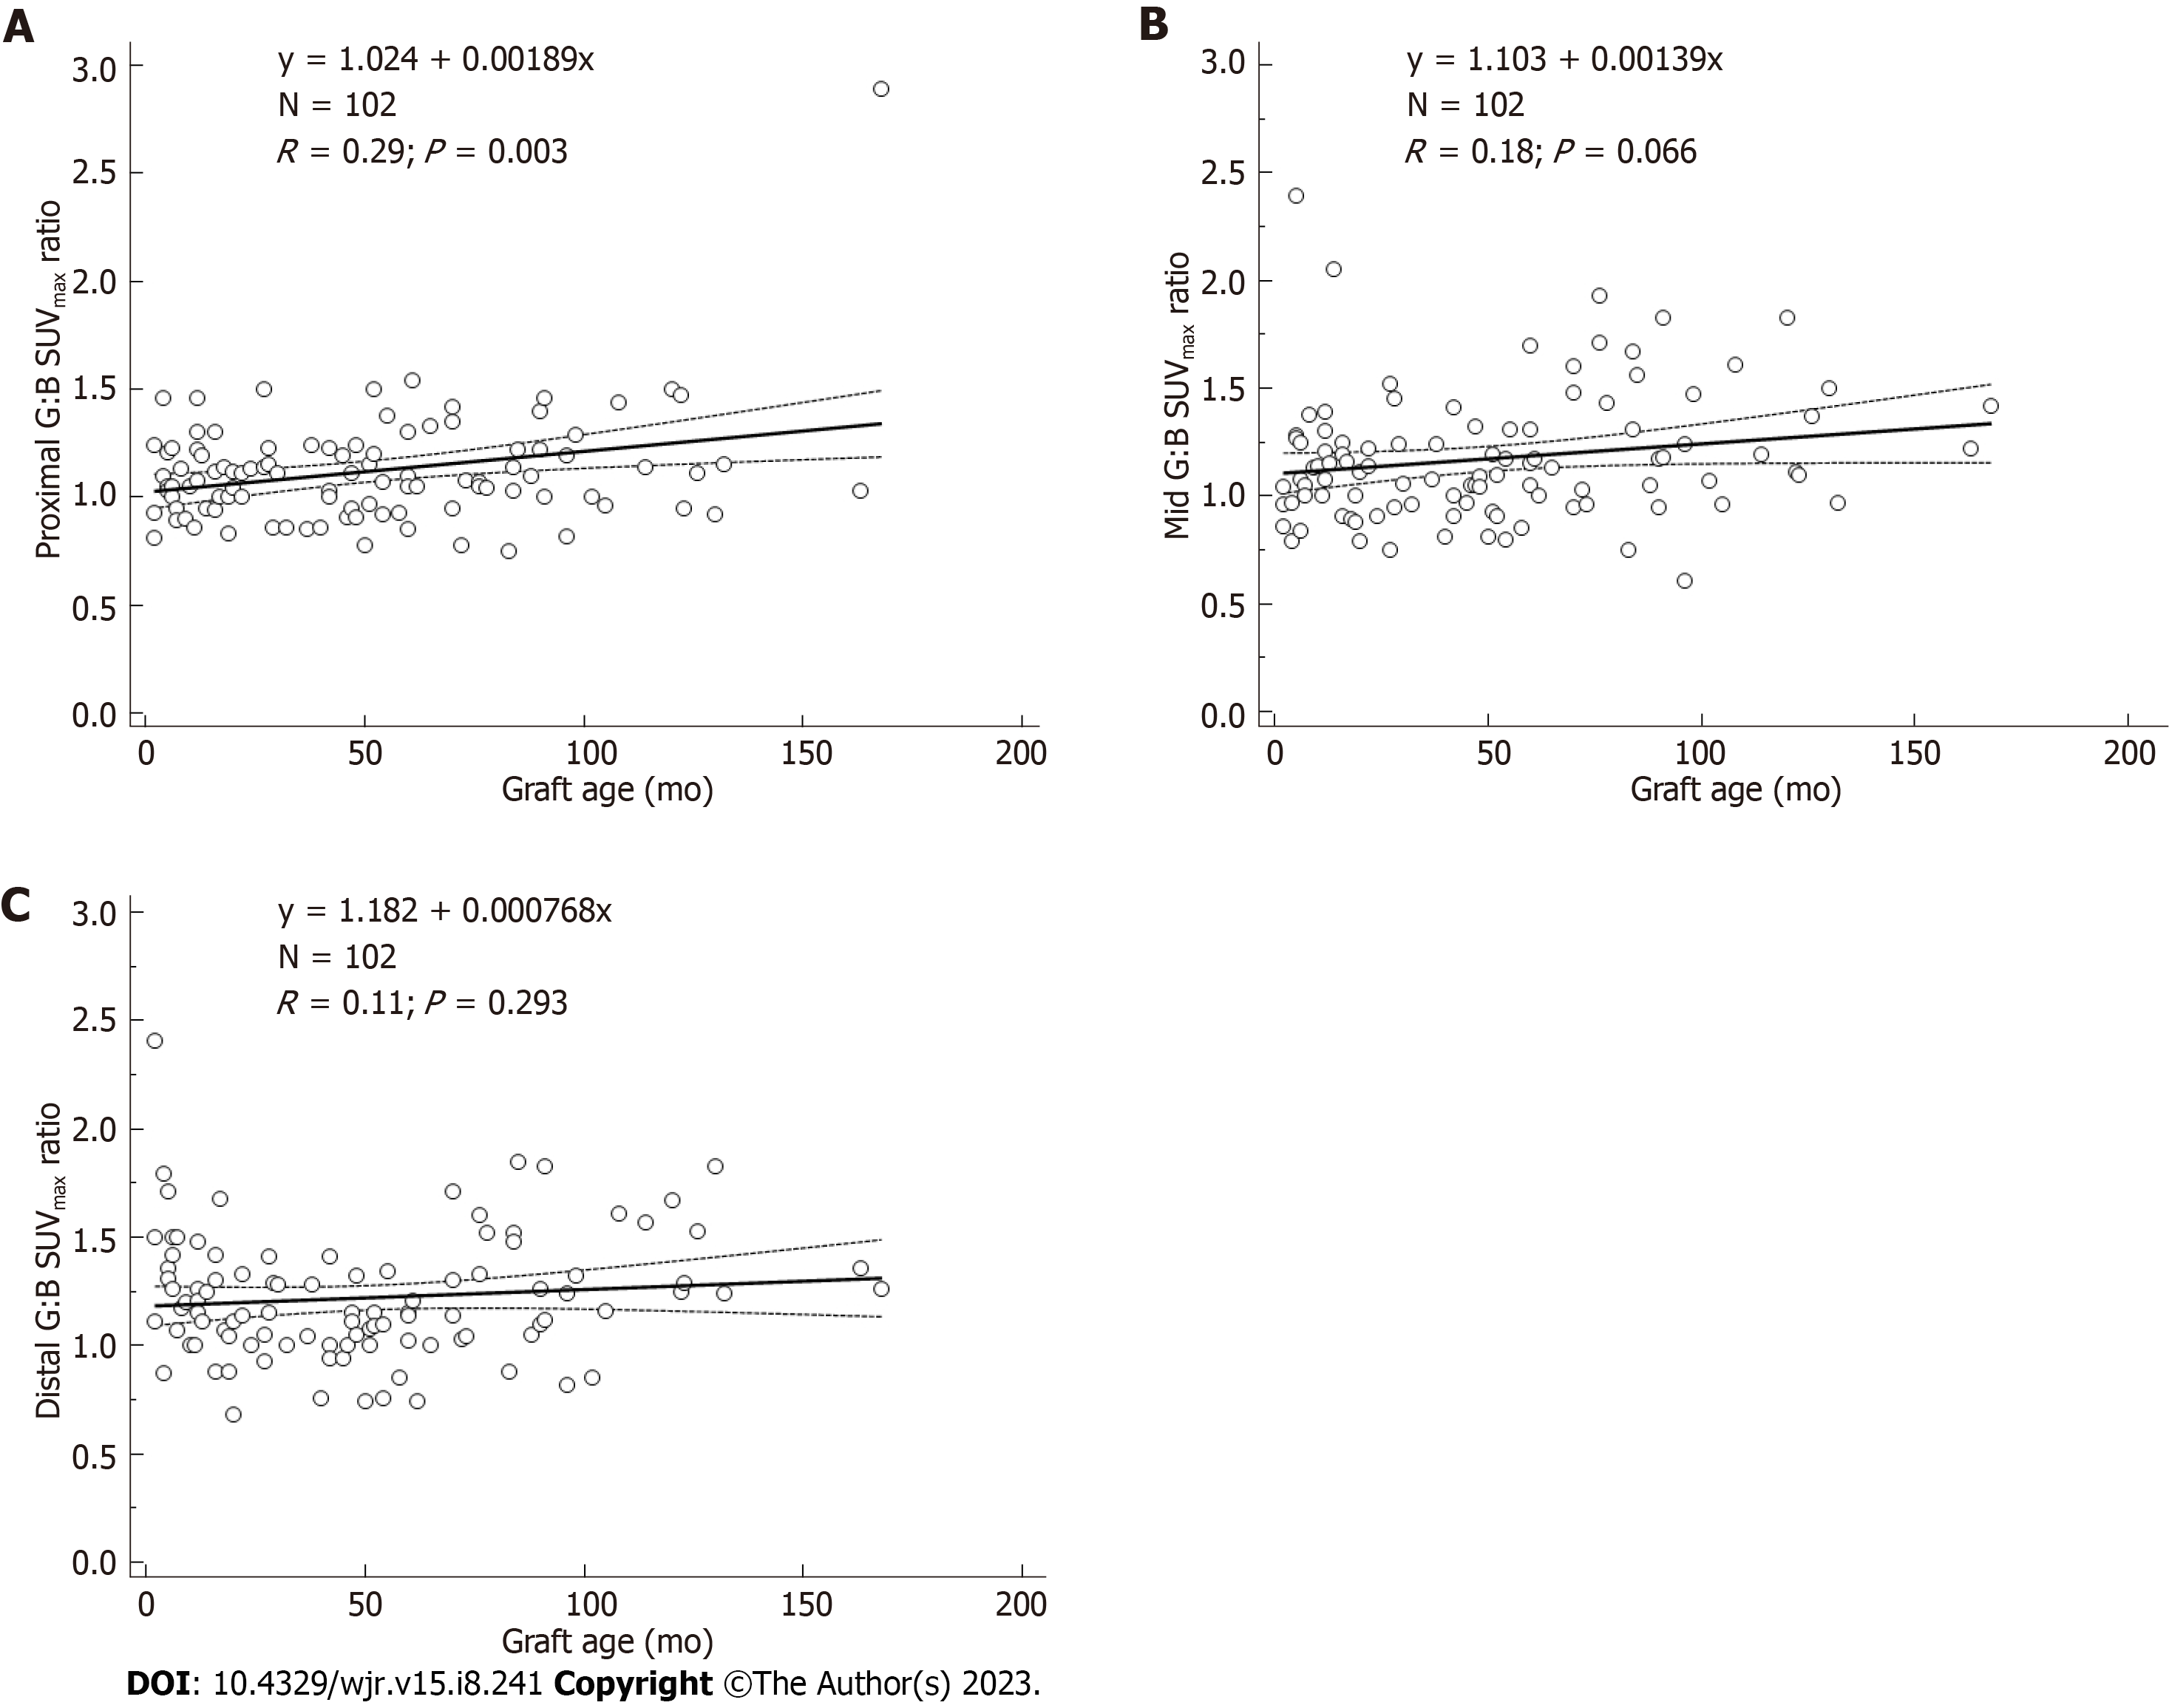
Figure 3 Uptake ratios vs graft age in months.
A: Proximal regions; B: Mid regions; C: Distal regions of abdominal aortic grafts.
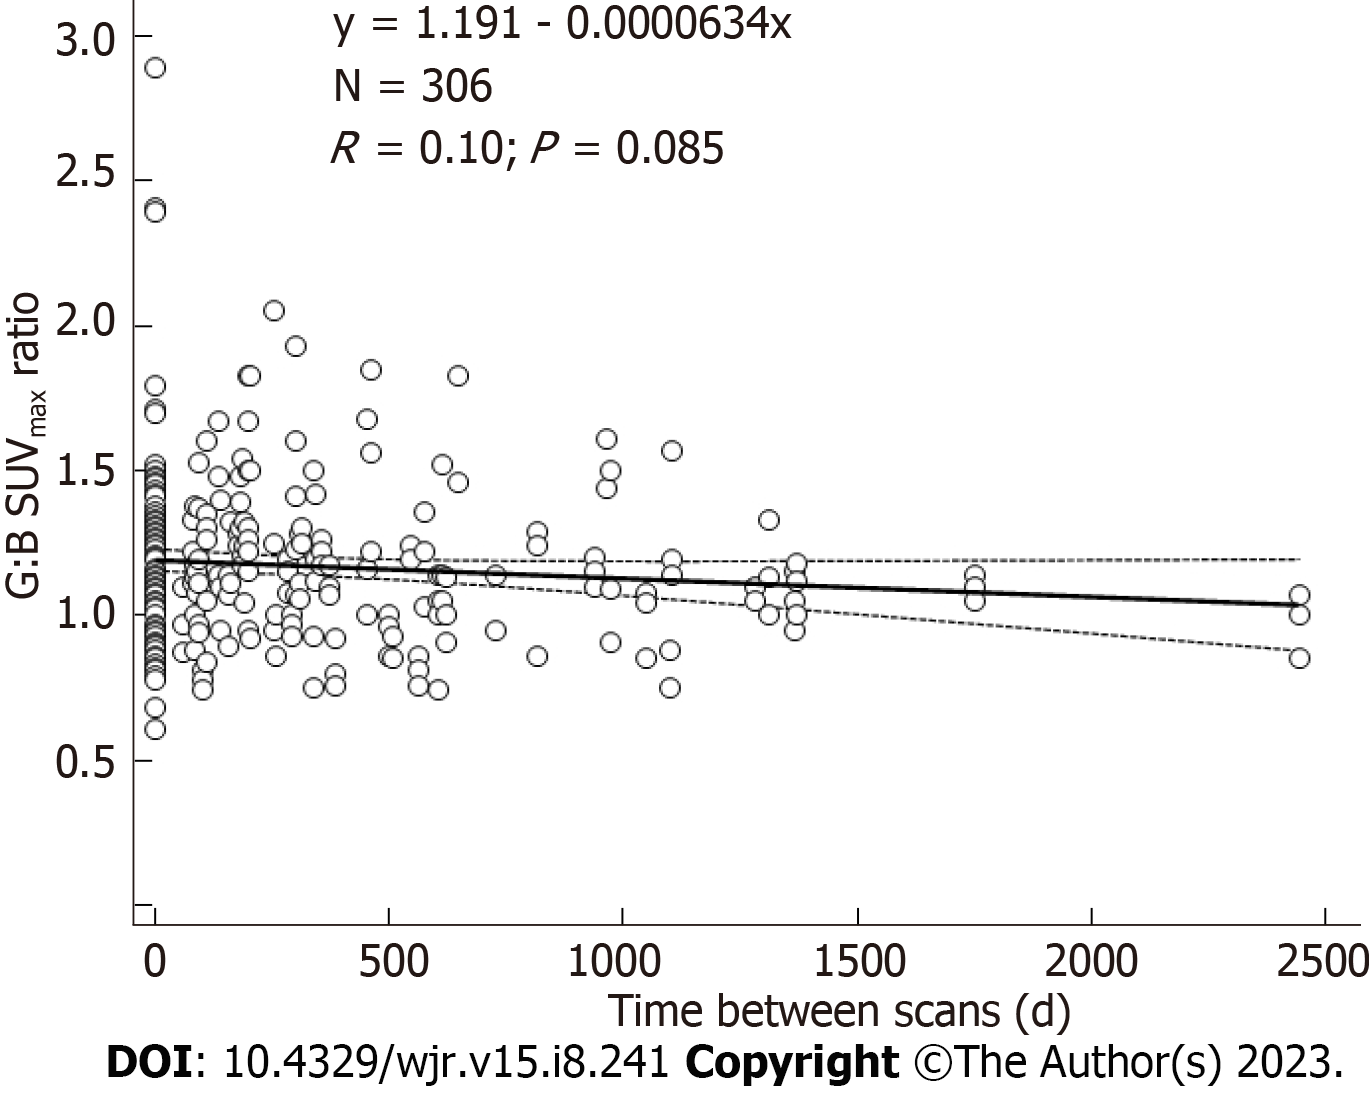
Figure 4 Uptake ratios of abdominal aortic grafts for all patients at all scan times.
SUVmax: Maximum standardized uptake value.
- Citation: Bennett P, Tomas MB, Koch CF, Nichols KJ, Palestro CJ. Appearance of aseptic vascular grafts after endovascular aortic repair on [(18)F]fluorodeoxyglucose positron emission tomography/computed tomography. World J Radiol 2023; 15(8): 241-249
- URL: https://www.wjgnet.com/1949-8470/full/v15/i8/241.htm
- DOI: https://dx.doi.org/10.4329/wjr.v15.i8.241


