©The Author(s) 2023.
World J Radiol. Jun 28, 2023; 15(6): 170-181
Published online Jun 28, 2023. doi: 10.4329/wjr.v15.i6.170
Published online Jun 28, 2023. doi: 10.4329/wjr.v15.i6.170
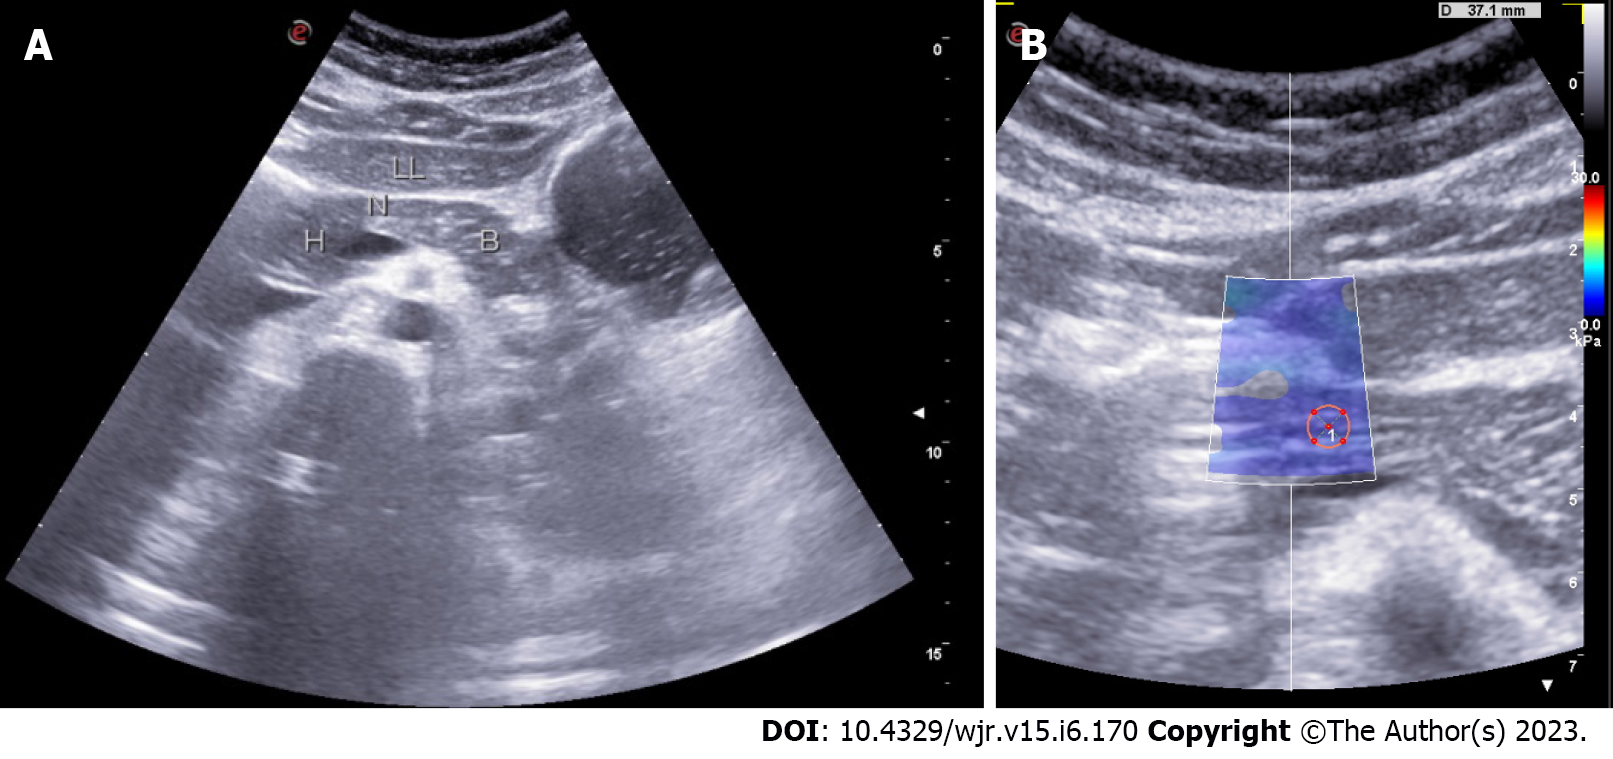
Figure 1 Transabdominal ultrasonography.
A: Grayscale appearance of the normal pancreas (LL- Left lobe of liver, H- Head of pancreas, N- neck of pancreas, B-Body of pancreas). The pancreas is isoechoic compared to normal liver and shows a granular appearance and smooth outline; B: 2D Shear wave elastography measurement from the normal pancreas-neck region (3.84 ± 0.45 kPa).
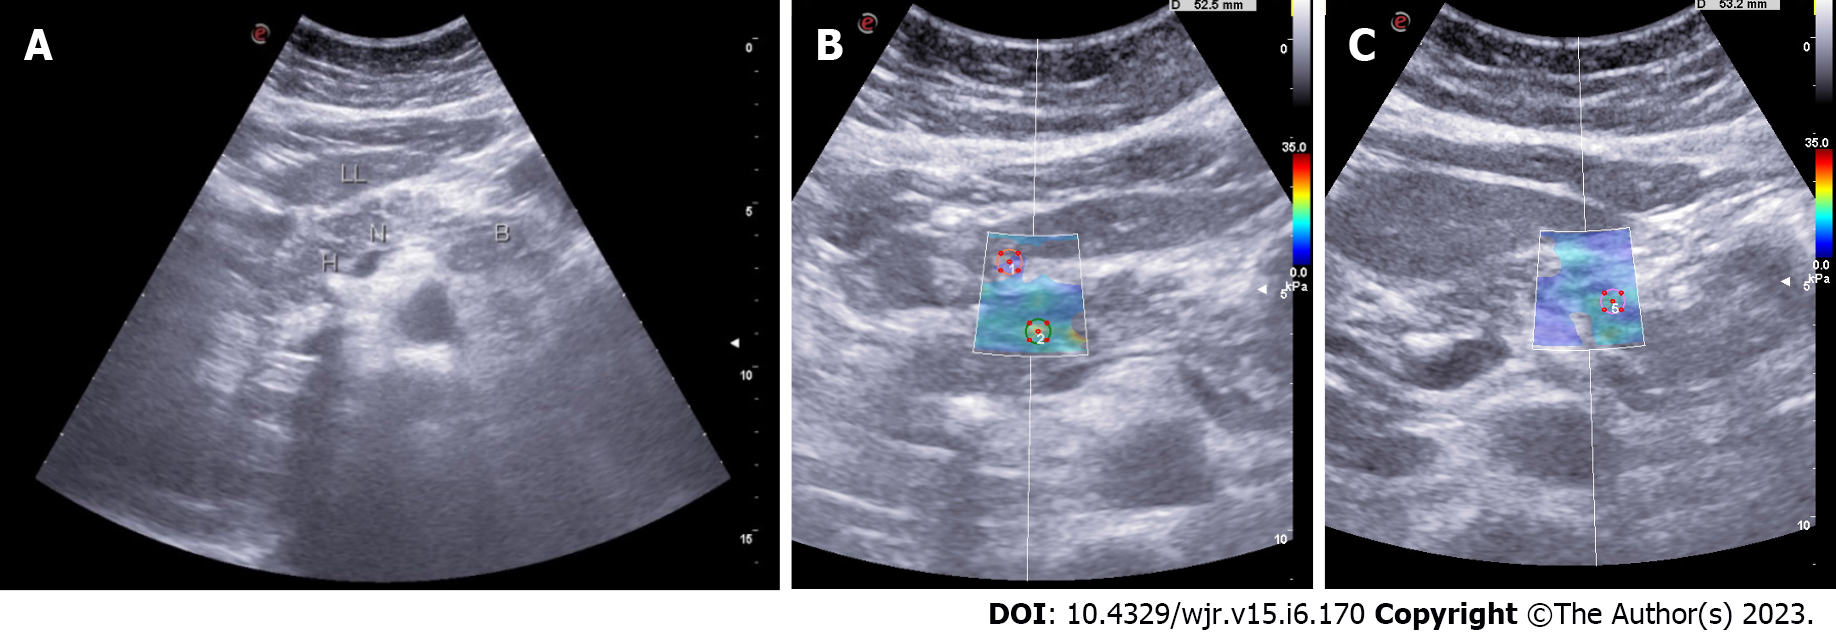
Figure 2 Shear wave velocity in patients with chronic pancreatitis was significantly higher than that in healthy volunteers in each part of the pancreas.
A: Grayscale appearance of the pancreas in chronic calcific pancreatitis. (LL- Left lobe of liver, H- Head of pancreas, N- neck of pancreas, B-Body of pancreas). It shows a focal hyperechoic signal compared to normal liver and a mildly lobulated outline, a focus of calcification in the head region with posterior acoustic shadowing; B: 2D Shear wave elastography measurement of the pancreas in chronic calcific pancreatitis - head region (15.55 ± 2.64 kPa); C: 2D Shear wave elastography measurement of the pancreas in chronic calcific pancreatitis - region (11 ± 2.07 kPa).
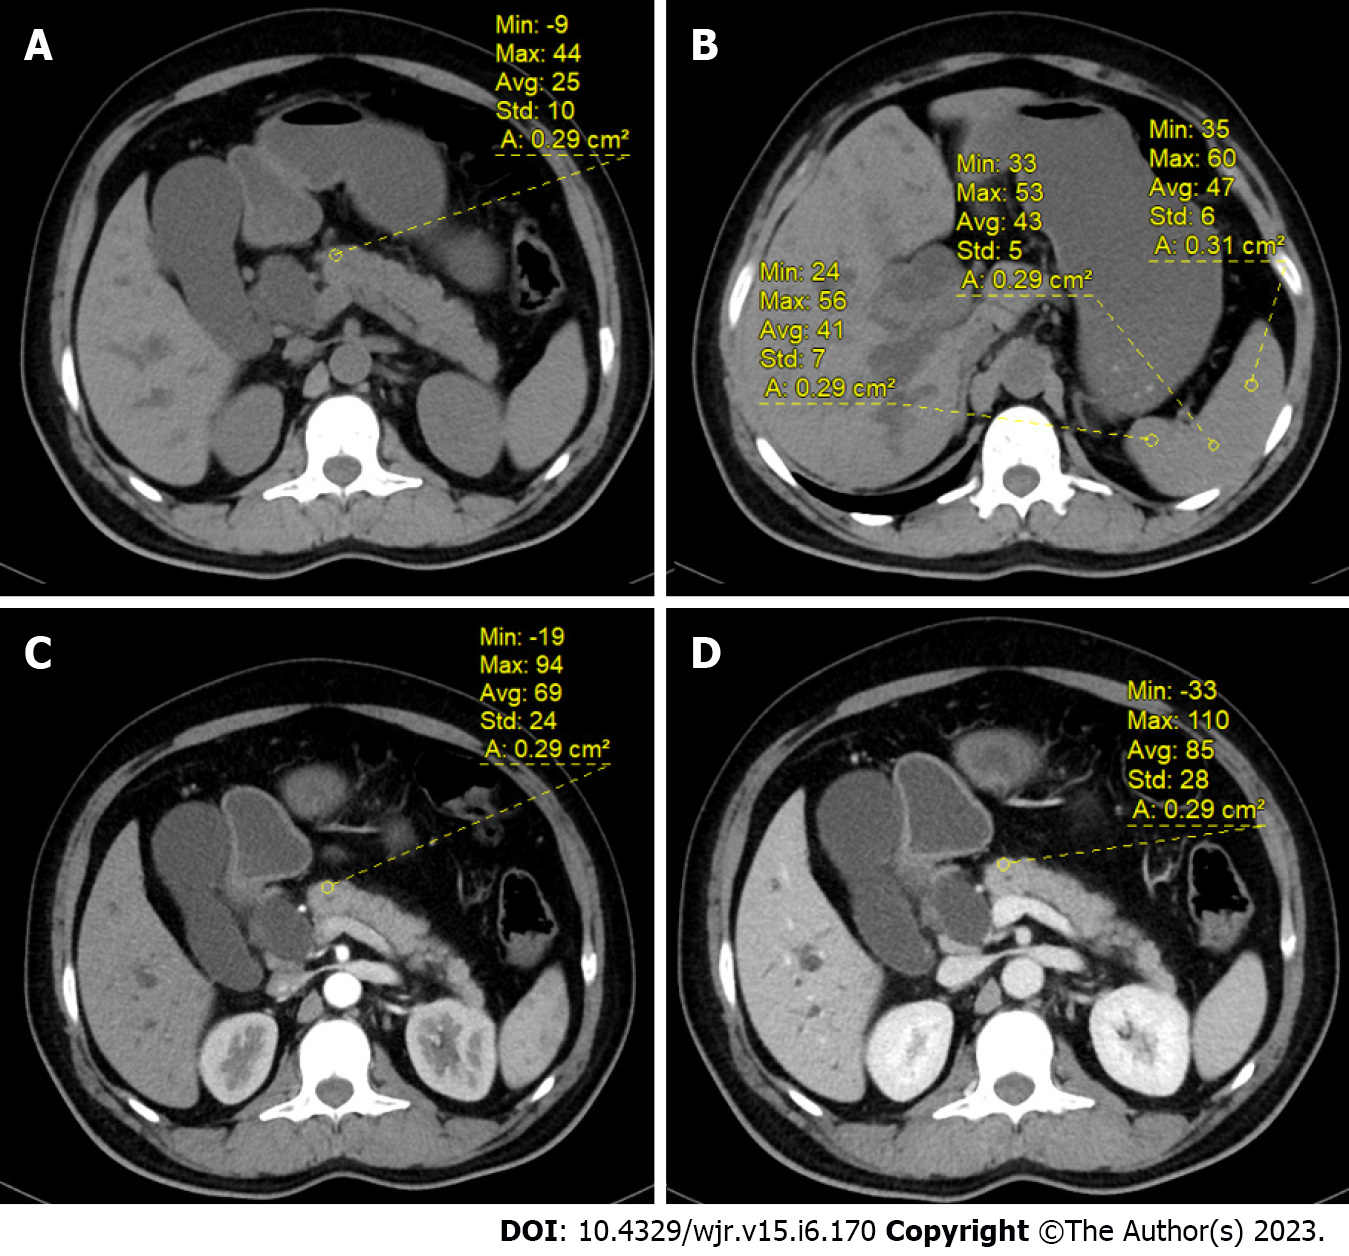
Figure 3 Calculation of pancreatic attenuation index and pancreatic enhancement ratio.
A: Hounsfield unit (HU) of the pancreatic neck in the plain phase; B: HU of the spleen in plain phase; C: HU of the pancreatic neck in the arterial phase; D: HU of the pancreatic neck in the equilibrium phase. ROI: Region of interest.
- Citation: Kalayarasan R, Himaja M, Ramesh A, Kokila K. Radiological parameters to predict pancreatic texture: Current evidence and future perspectives. World J Radiol 2023; 15(6): 170-181
- URL: https://www.wjgnet.com/1949-8470/full/v15/i6/170.htm
- DOI: https://dx.doi.org/10.4329/wjr.v15.i6.170


