©The Author(s) 2022.
World J Radiol. Jun 28, 2022; 14(6): 114-136
Published online Jun 28, 2022. doi: 10.4329/wjr.v14.i6.114
Published online Jun 28, 2022. doi: 10.4329/wjr.v14.i6.114
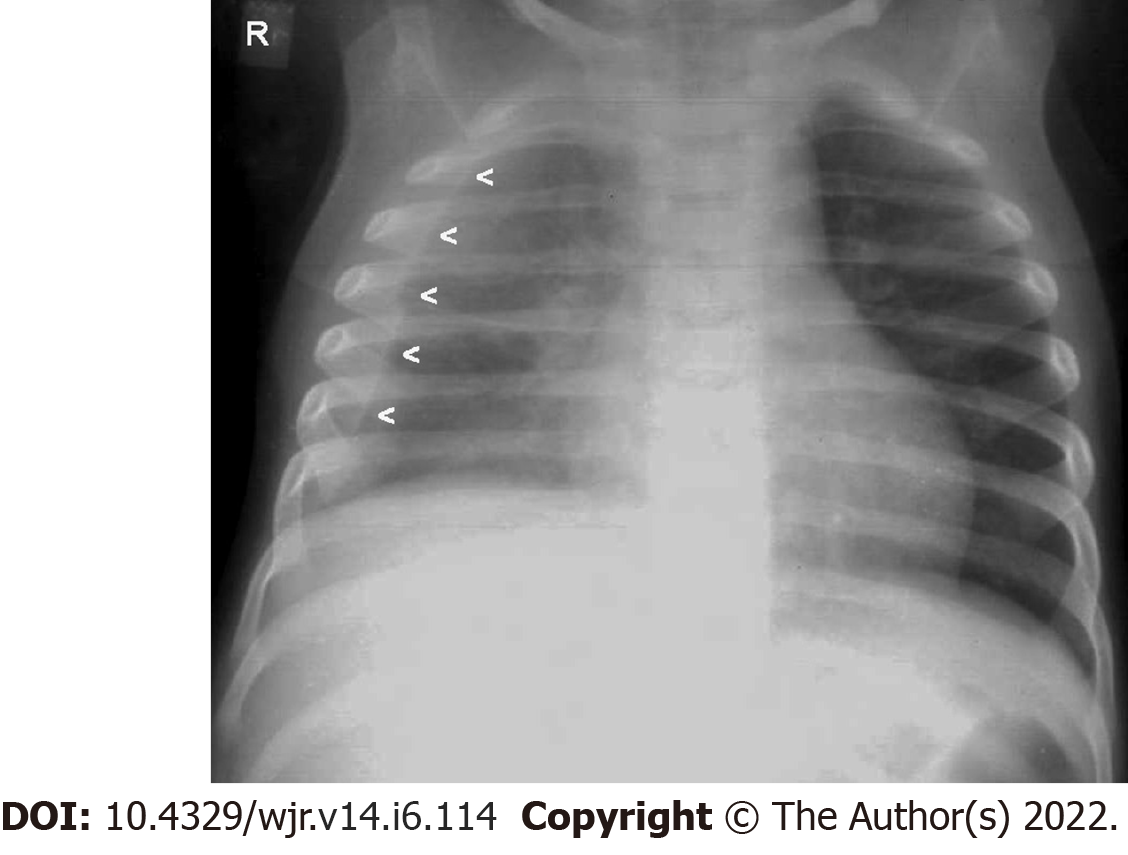
Figure 1 Lamellar pleural effusion.
Frontal chest radiograph of an 18-mo-old child with Pulmonary tuberculosis (primary complex) reveals a lamellar pleural effusion- (homogeneous increased radio-opacity along lateral aspect of right lung field with blunting of the right costophrenic angle- mimicking the appearance of pleural thickening) - [arrowheads]. Image courtesy – Department of Radiology, KEM Hospital, Mumbai.
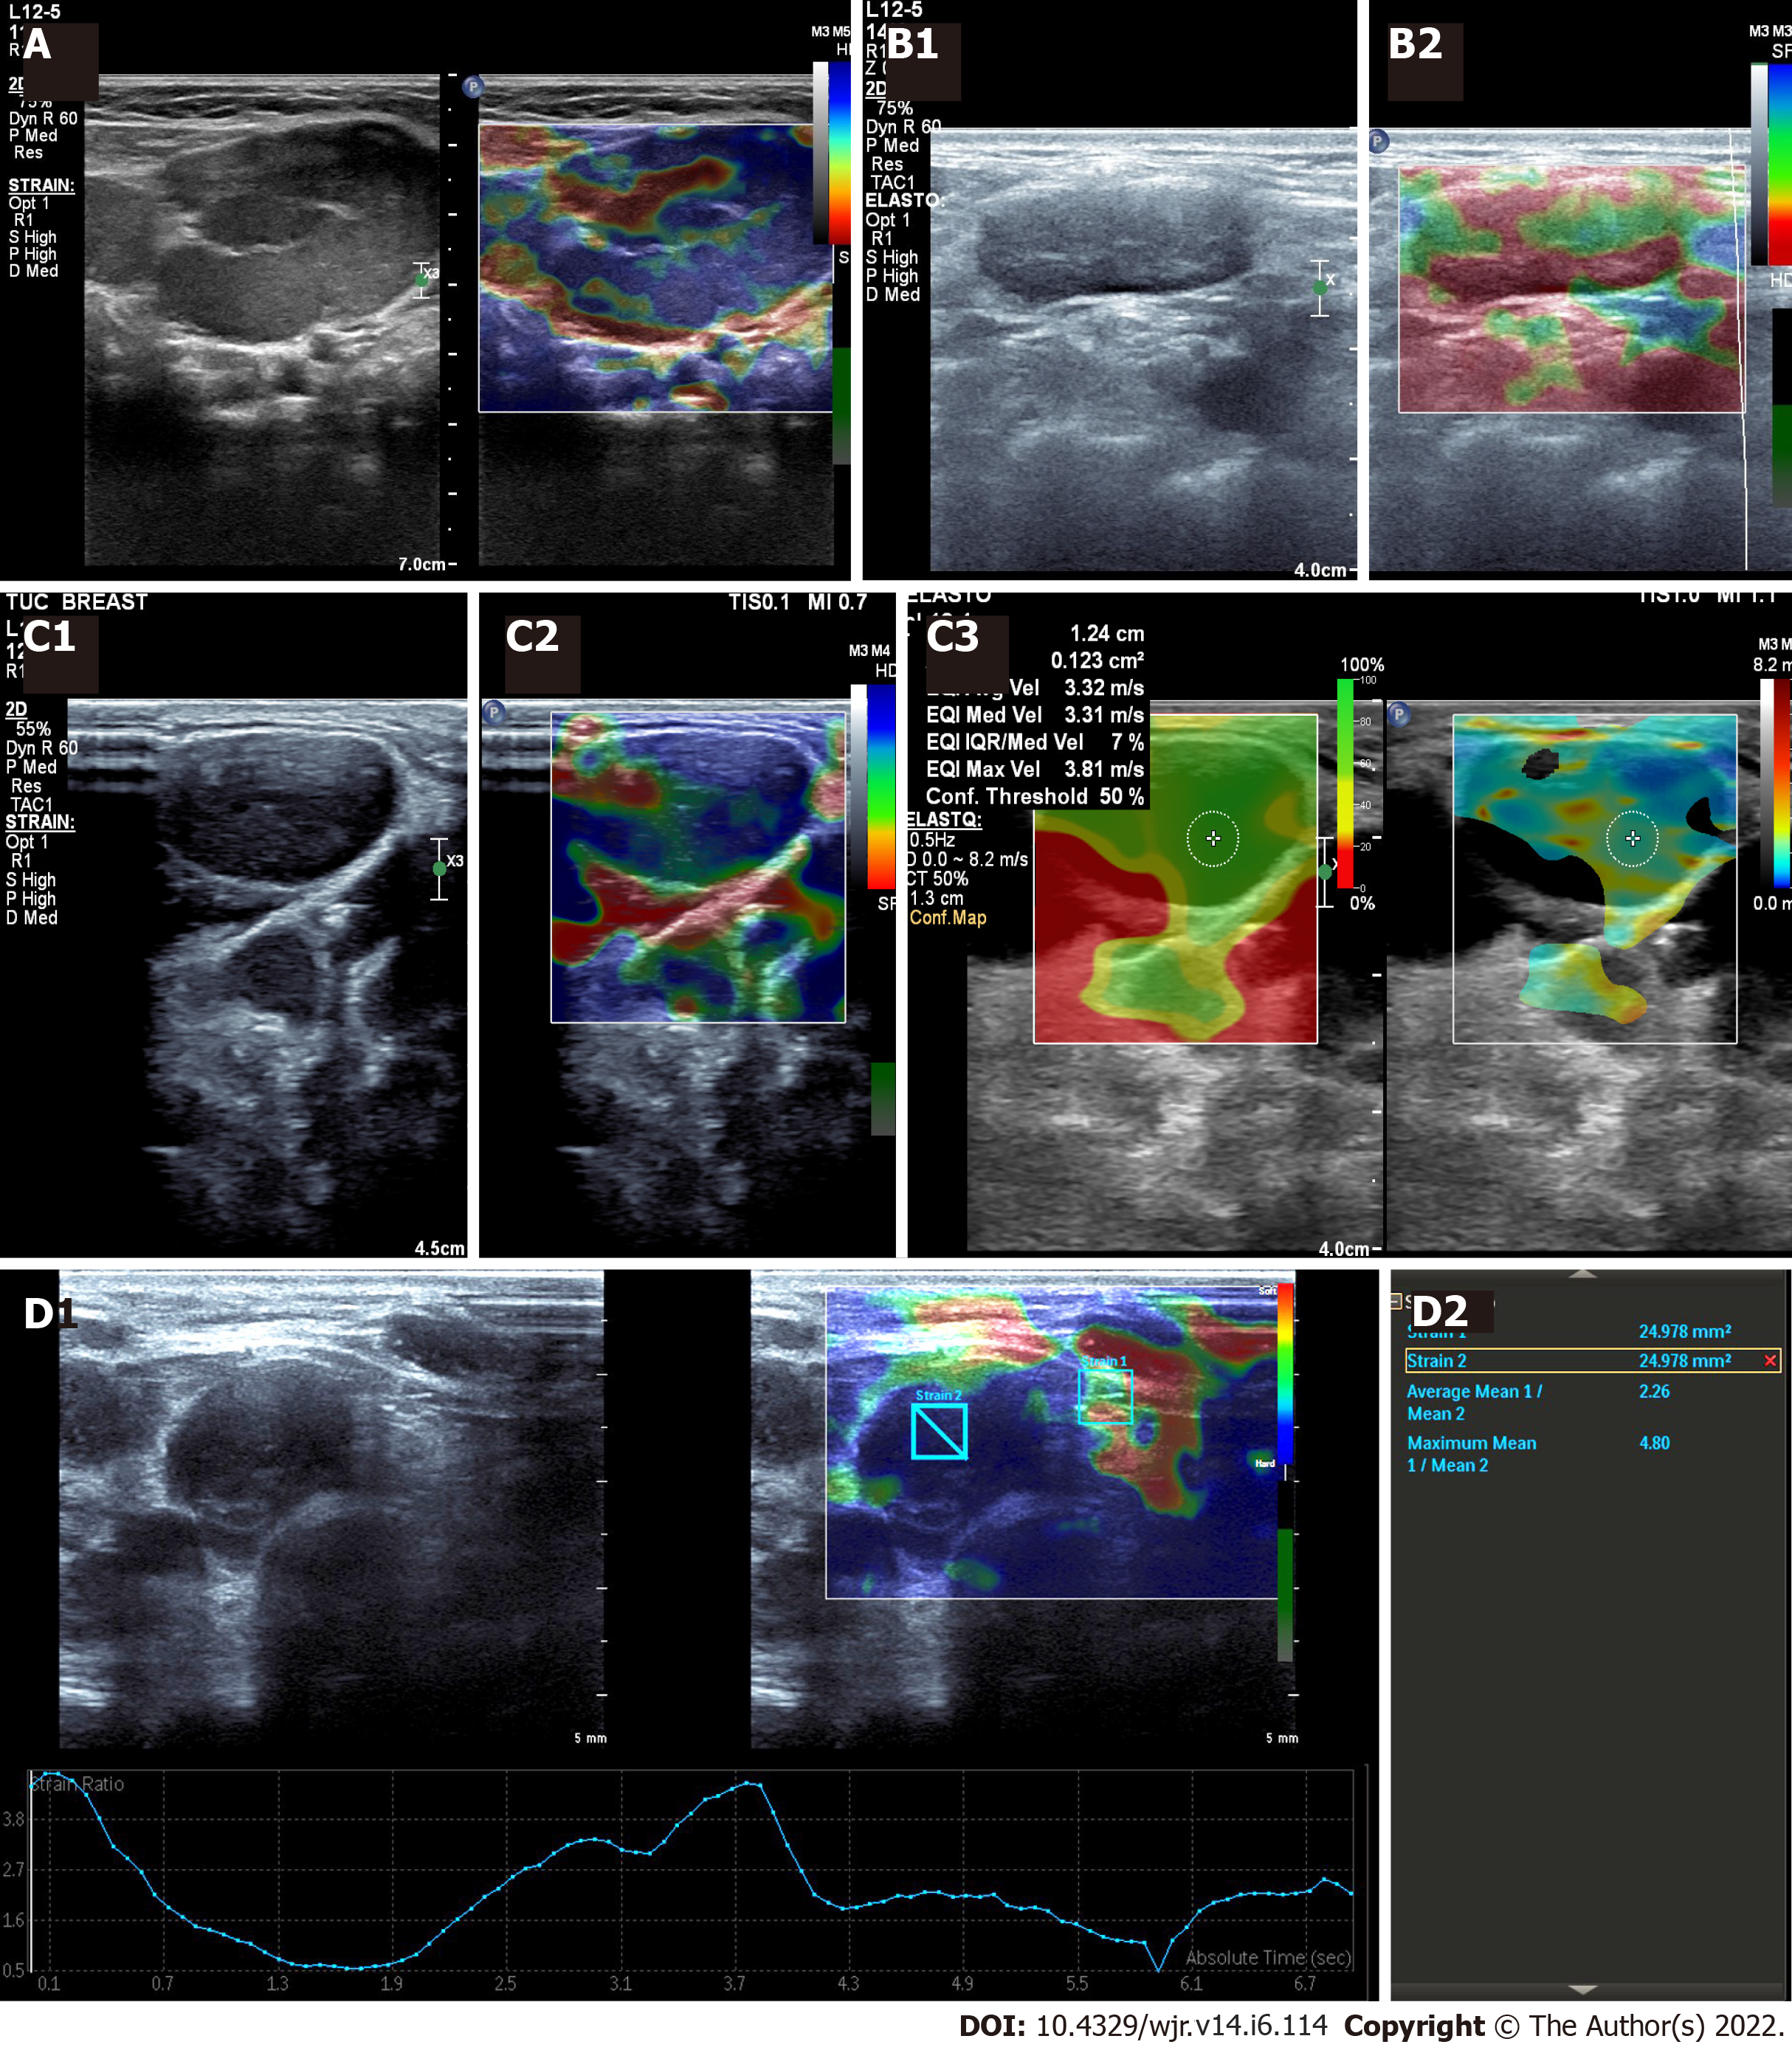
Figure 2 Cervical tuberculosis lymph node.
A: Cervical tuberculosis lymph node: Ultrasonography (US) elastography - central necrotic area appears soft (red); B: Tuberculous lymphadenopathy: A 16-year-old female with fever and neck swelling; B1: Grey scale B-mode image: shows an enlarged lymph node with diffusely hypoechoic echotexture and loss of fatty hilum; B2: Strain US Elastography: Showing a mixed pattern, predominantly soft (red); C: Tuberculous lymphadenopathy: 35-year-old male with neck swelling and history of weight loss; C1: Grey scale image: shows an enlarged lymph node with diffusely hypoechoic echotexture and loss of fatty hilum; C2: Strain US elastography: Showing soft areas within (red areas) s/o necrosis / liquefaction; C3: Shear wave US elastography: Shows relatively low shear wave values; D: Tuberculous lymphadenopathy: Neck US of a 14-year-old female (known case of drug resistant tuberculosis); D1: Grey scale B-mode image: enlarged lymph nodes with diffusely hypoechoic echotexture and loss of fatty hilum; D2: Strain US Elastography: The strain elastography reveals a low strain ratio (2.26). Elastography details are noted on the elastography graph too. Trucut biopsy was done - results awaited. Images courtesy Dr. Chaubal N, Thane Ultrasound Centre, India.
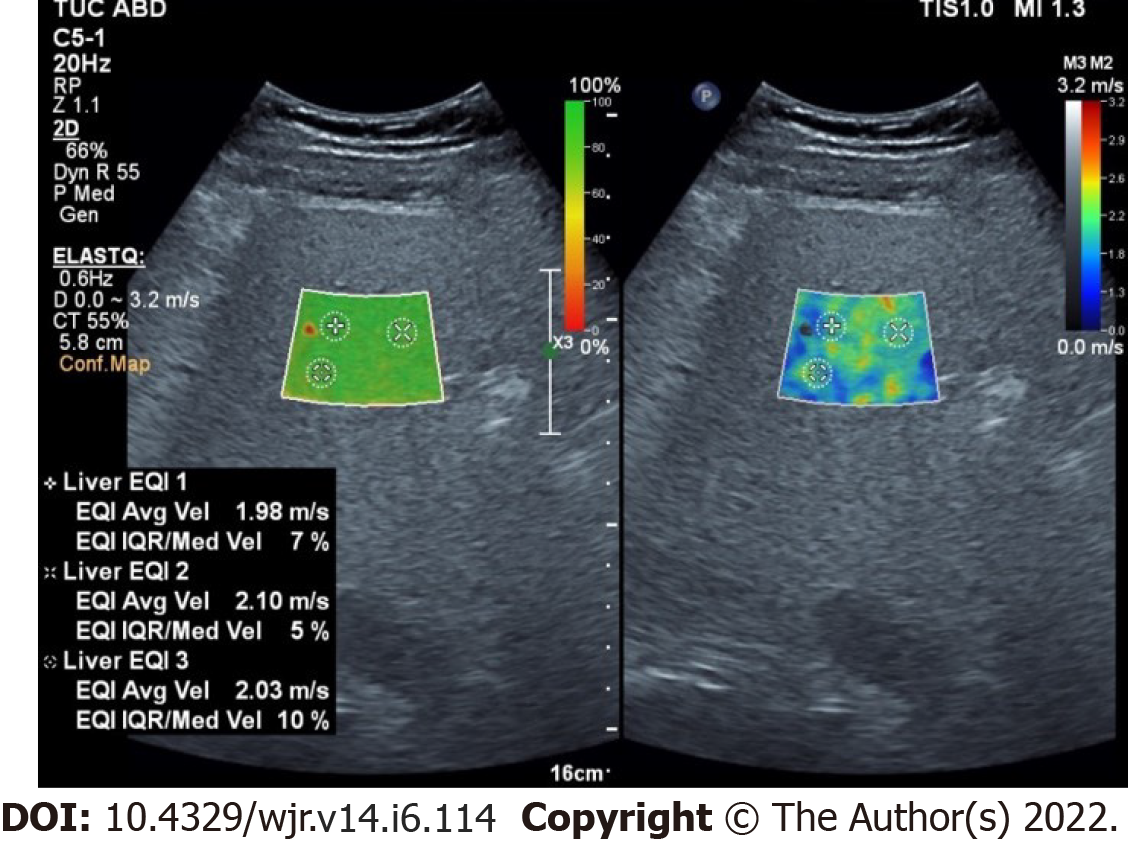
Figure 3 Shear wave ultrasonography elastography of Liver: 28-year male, on tuberculosis medications for 8 mo, with altered liver functions.
Stiffness median - 1.76 metres/sec -- Metavir F3: indicative of Enhanced liver fibrosis. Images courtesy Dr. Chaubal N, Thane Ultrasound Centre, India.
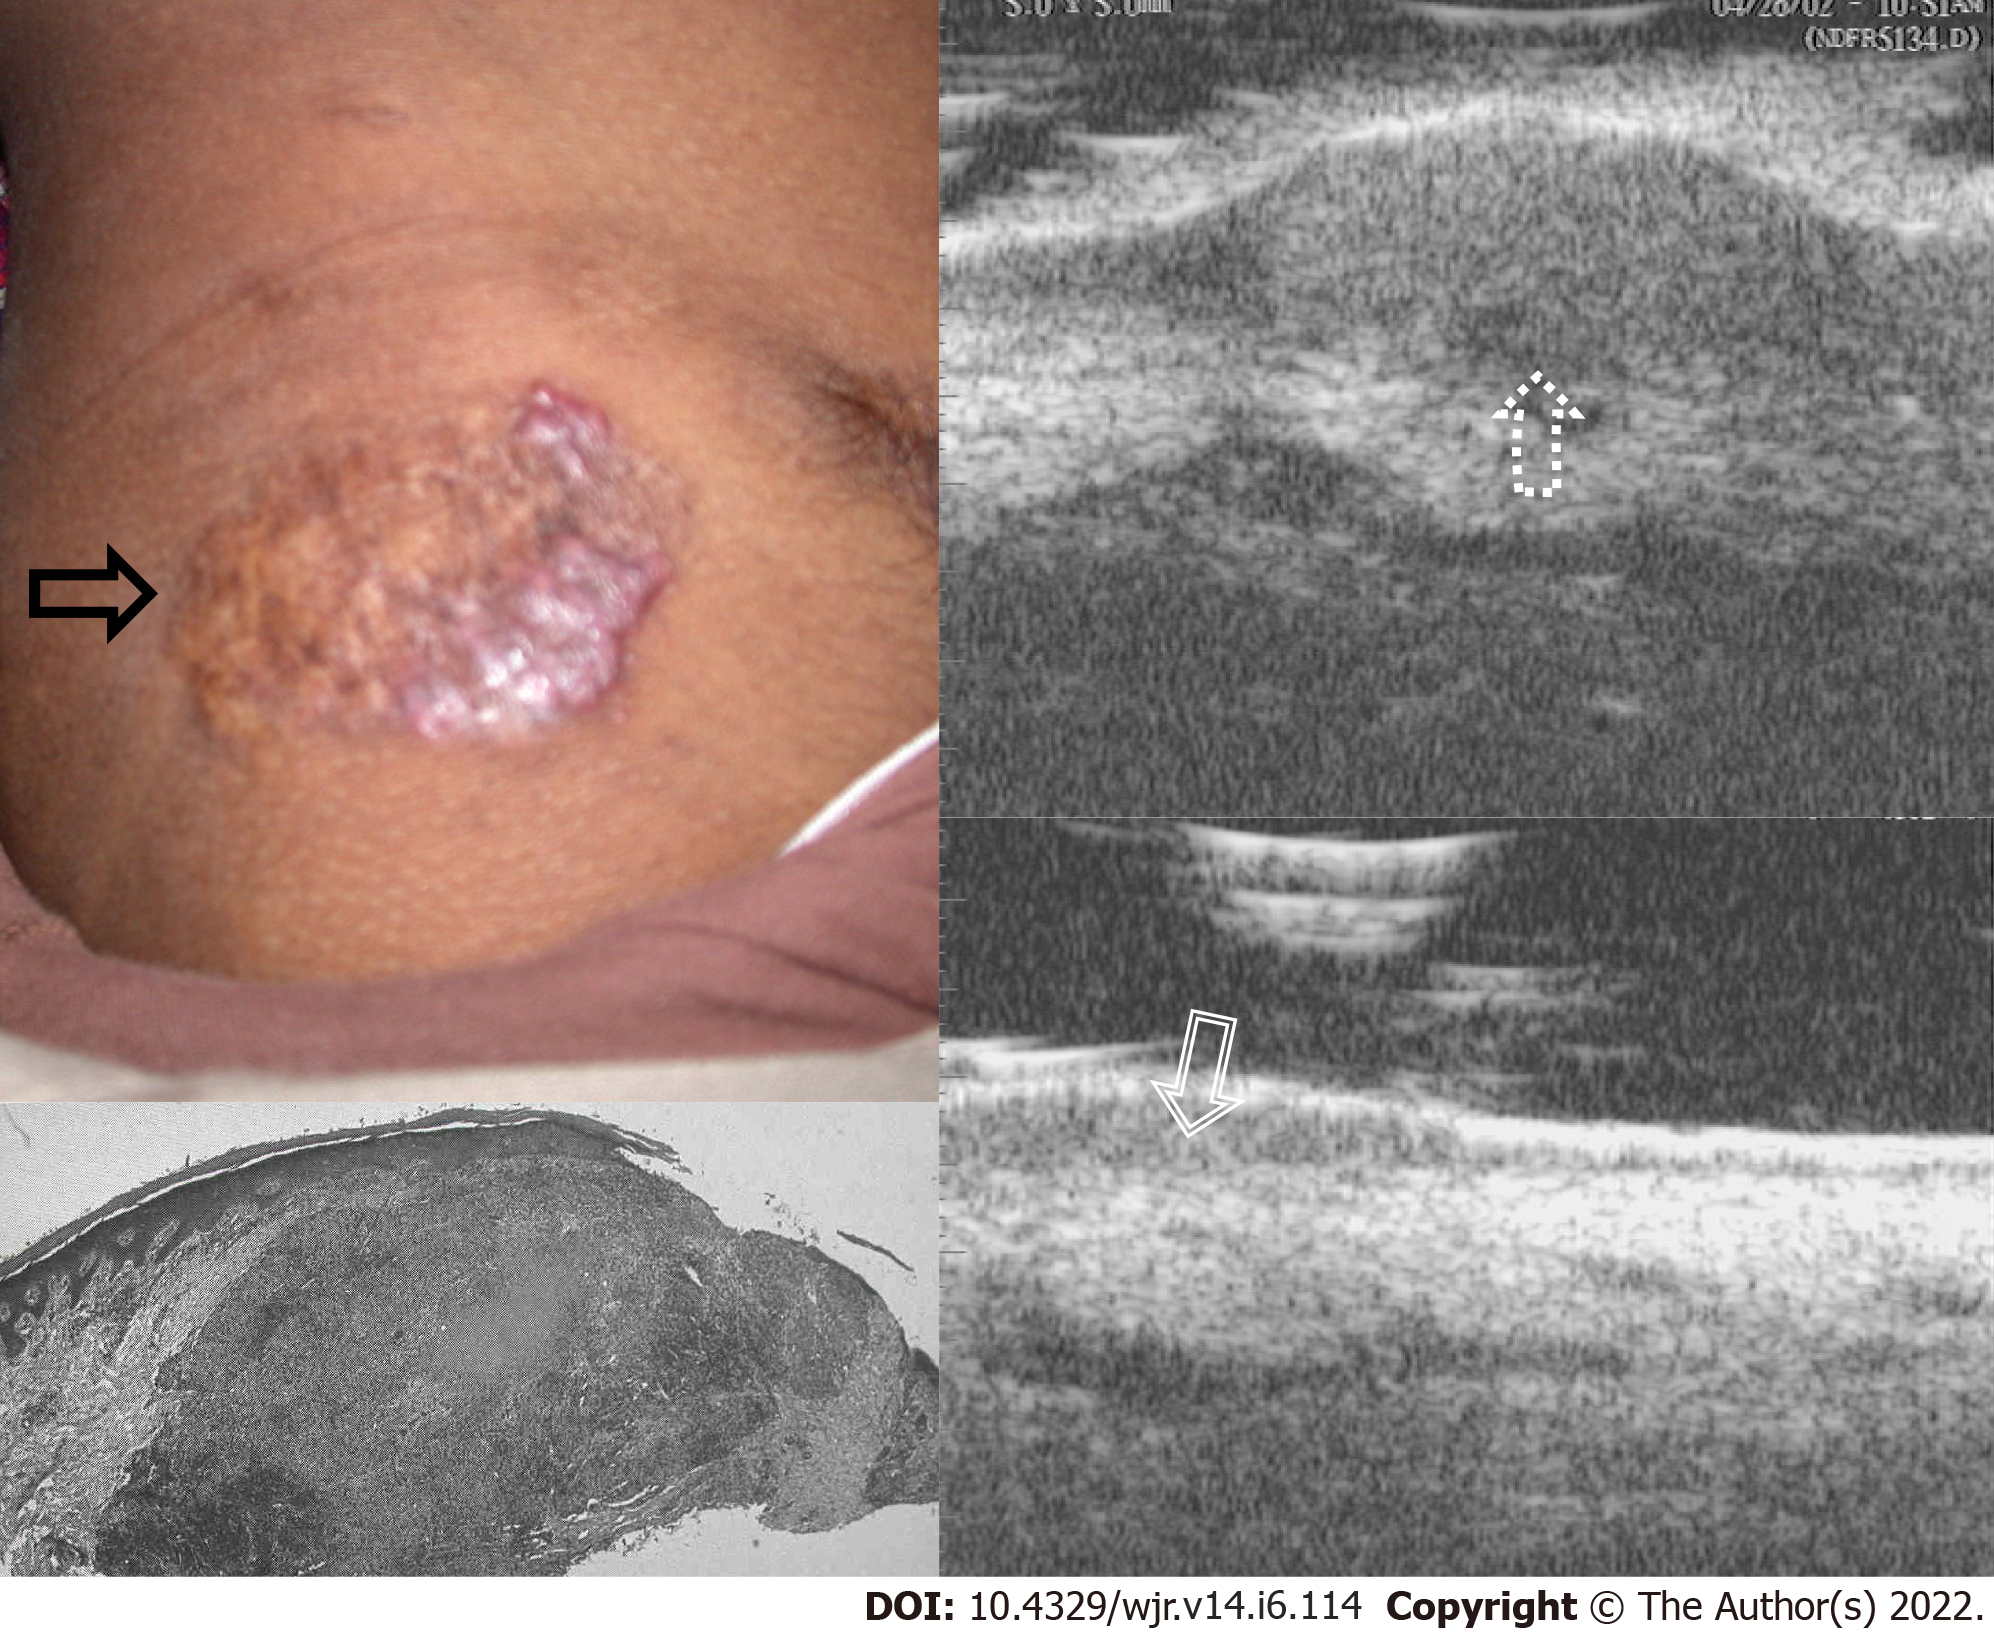
Figure 4 Ultrasound Biomicroscopy scanned at 50 MHz - Skin tuberculosis - lupus vulgaris.
A well-defined reddish-brown plaque with papulo-nodular borders is seen on the skin (black arrow), Ultrasound biomicroscopy (UBM) shows a well-defined heterogenous mass lesion in the dermis (up arrow-dotted), Histopathology shows a well-defined tuberculous granuloma in the dermis (white filled arrow), Follow up UBM after 6 mo of AKT shows marked decrease in the size of granuloma in the dermis (down arrow- dashed). Images Courtesy Dr. Bhatt K, UBM Institute & Sonography Centre, Mumbai.
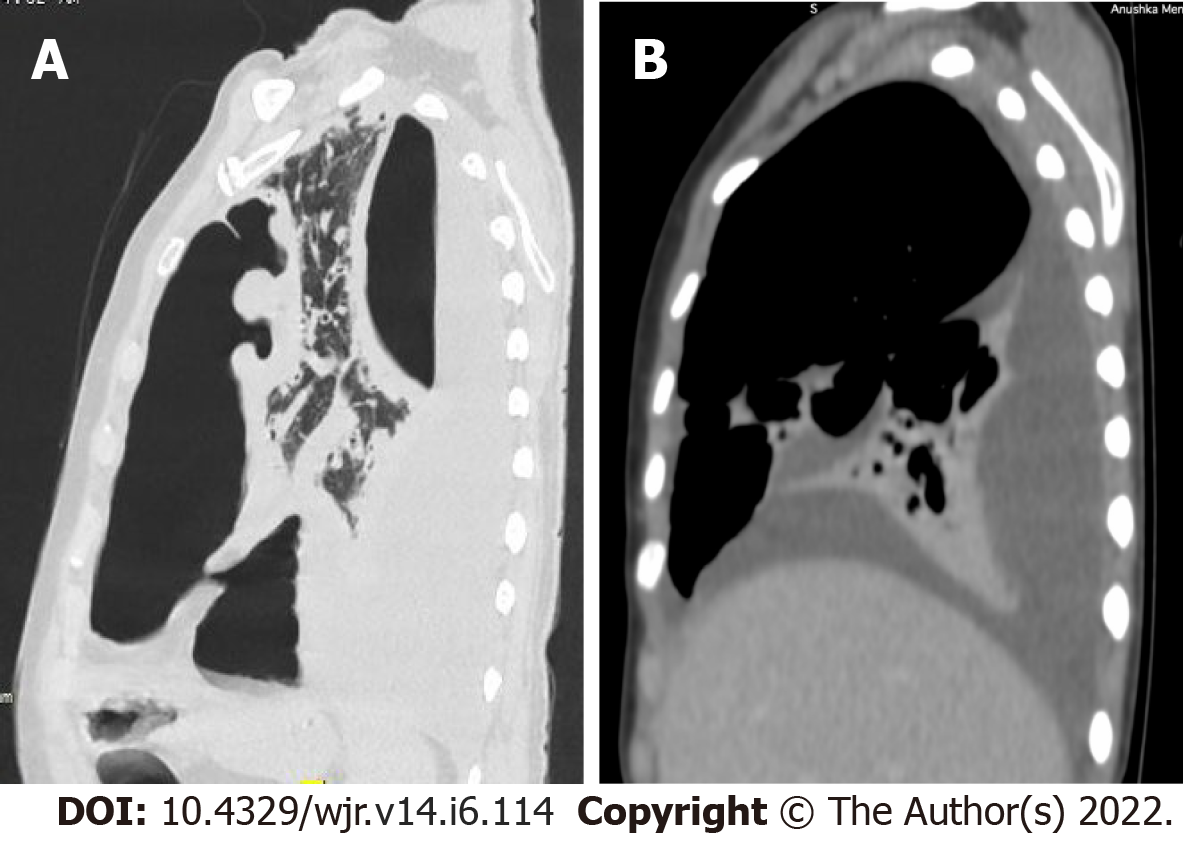
Figure 5 Tuberculous pyo-pneumothorax.
A: Sagittal high-resolution computed tomography image in lung window showing a thick-walled cavity communicating with the left pleural space. A large loculated collection in the left pleural space showing air-fluid level; B: Sagittal image in a mediastinal window showing a Right pleural effusion with partial collapse of Right lower lobe. Images courtesy Dr. Thakkar H, Prof & Head (Radiology), KEM Hospital, Mumbai.
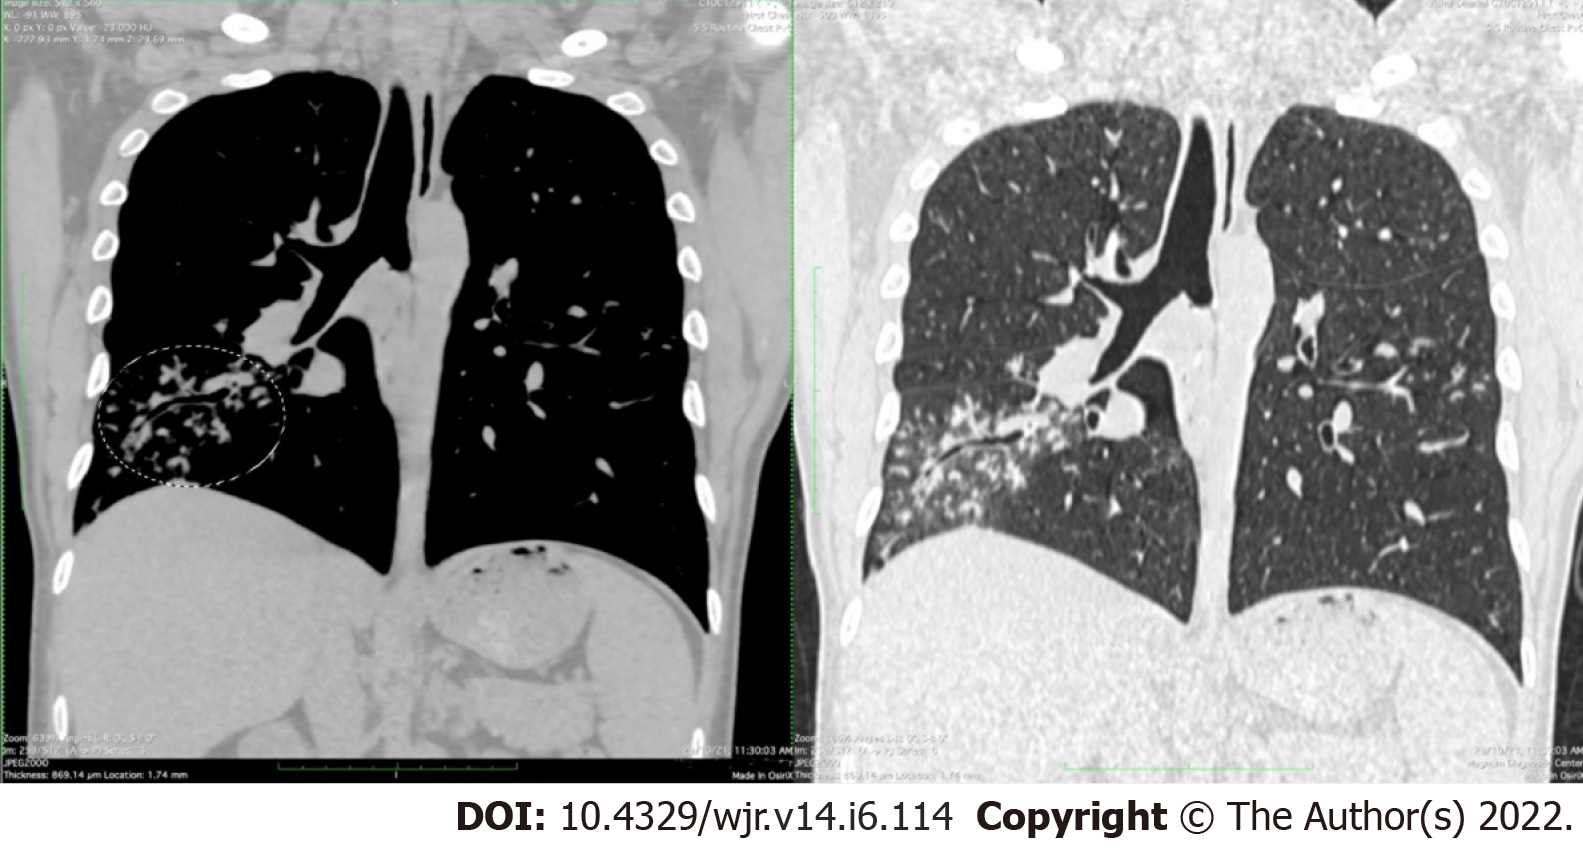
Figure 6 Endobronchial spread of tuberculosis.
Coronal computed tomography images in mediastinal and lung windows; demonstrative of multiple discrete and confluent centrilobular nodules in the lateral basal segment of right lower lobe, some of which show V-Y branching pattern (“tree in bud appearance”- circled area). Enlarged mediastinal lymph nodes are also observed in the subcarinal region. Images courtesy Dr. Joshi A, Prof & Head (Department of Radiology), LTMMC & LTMGH, Mumbai.
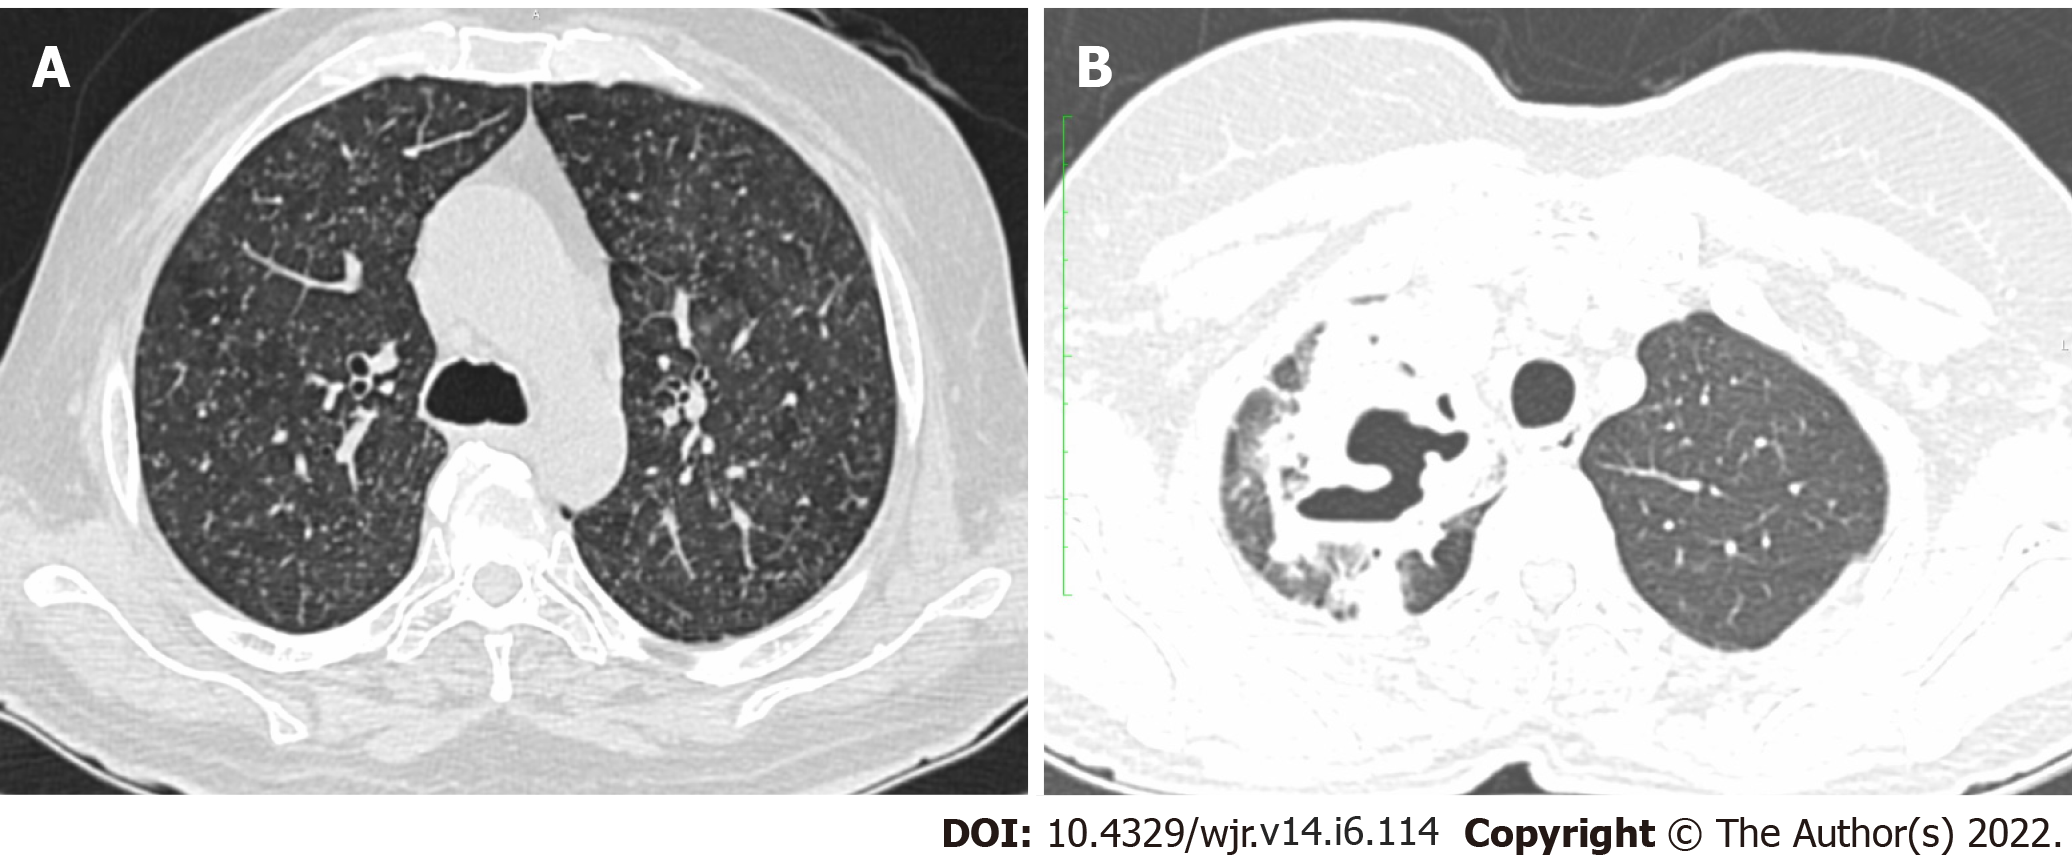
Figure 7 Tuberculosis sagittal computed tomography.
A: Miliary tuberculosis: Axial high-resolution computed tomography (HRCT) image in lung window demonstrates miliary nodules scattered in both lungs; B: Tuberculous cavity: Axial HRCT image in lung window showing a thick-walled cavity in the apical segment of the right upper lobe. Images courtesy Dr. Joshi A, Prof & Head (Department of Radiology), LTMMC & LTMGH, Mumbai.
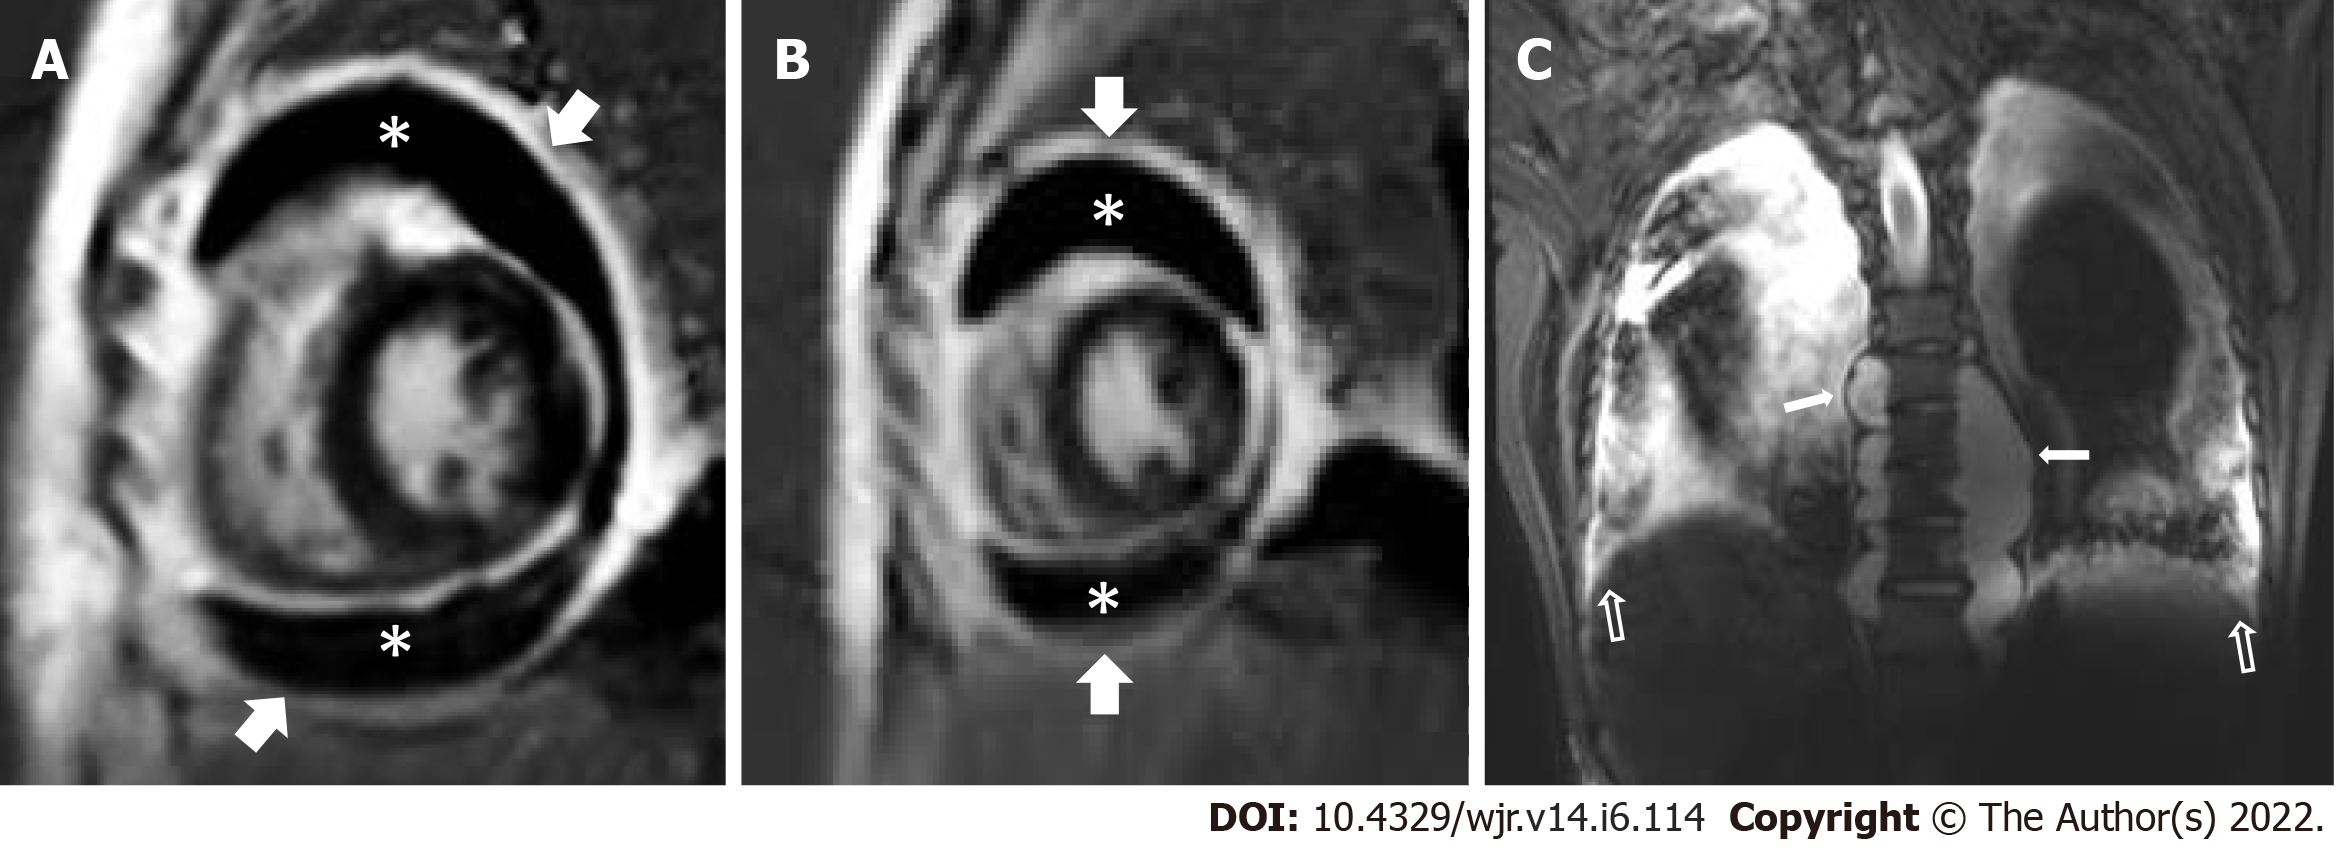
Figure 8 Tuberculous pericarditis and pericardial effusion: 3 Tesla Cardiac magnetic resonance imaging.
A and B: PSIR (short axis view) images shows enhancing pericardial thickening (arrow) and moderate distension of pericardial space with hypointense fluid (asterisk); C: Coronal STIR dorsal spine: Paraspinal abscesses (white arrow -filled) with concomitant pleural effusions (white arrow- unfilled).
Figure 9 Cardiac tuberculous myo-pericarditis - ‘the myocarditis-pericarditis complex - a sign of cardiac tuberculosis’: 3 tesla cardiac magnetic resonance imaging.
A: PSIR (4 chamber view -4CH) images shows enhancing pericardial thickening (thin arrow) and peripherally enhancing nodules in the subepicardial myocardium (thick arrow); B: PSIR (VLA view) - Thickened enhancing pericardium (unfilled arrow) with multiple nodular lesions (filled arrow) involving the myo-pericardium; C: Cine 4CH view: Diffuse pericardial thickening (<). In addition, nodular wall thickening (<) of the atria, and the interatrial septum is noted. (The patient was 10-year-old boy with a 2-mo h/o fever and chest pain and responded to anti-tuberculosis medications- regression of the lesions noted).
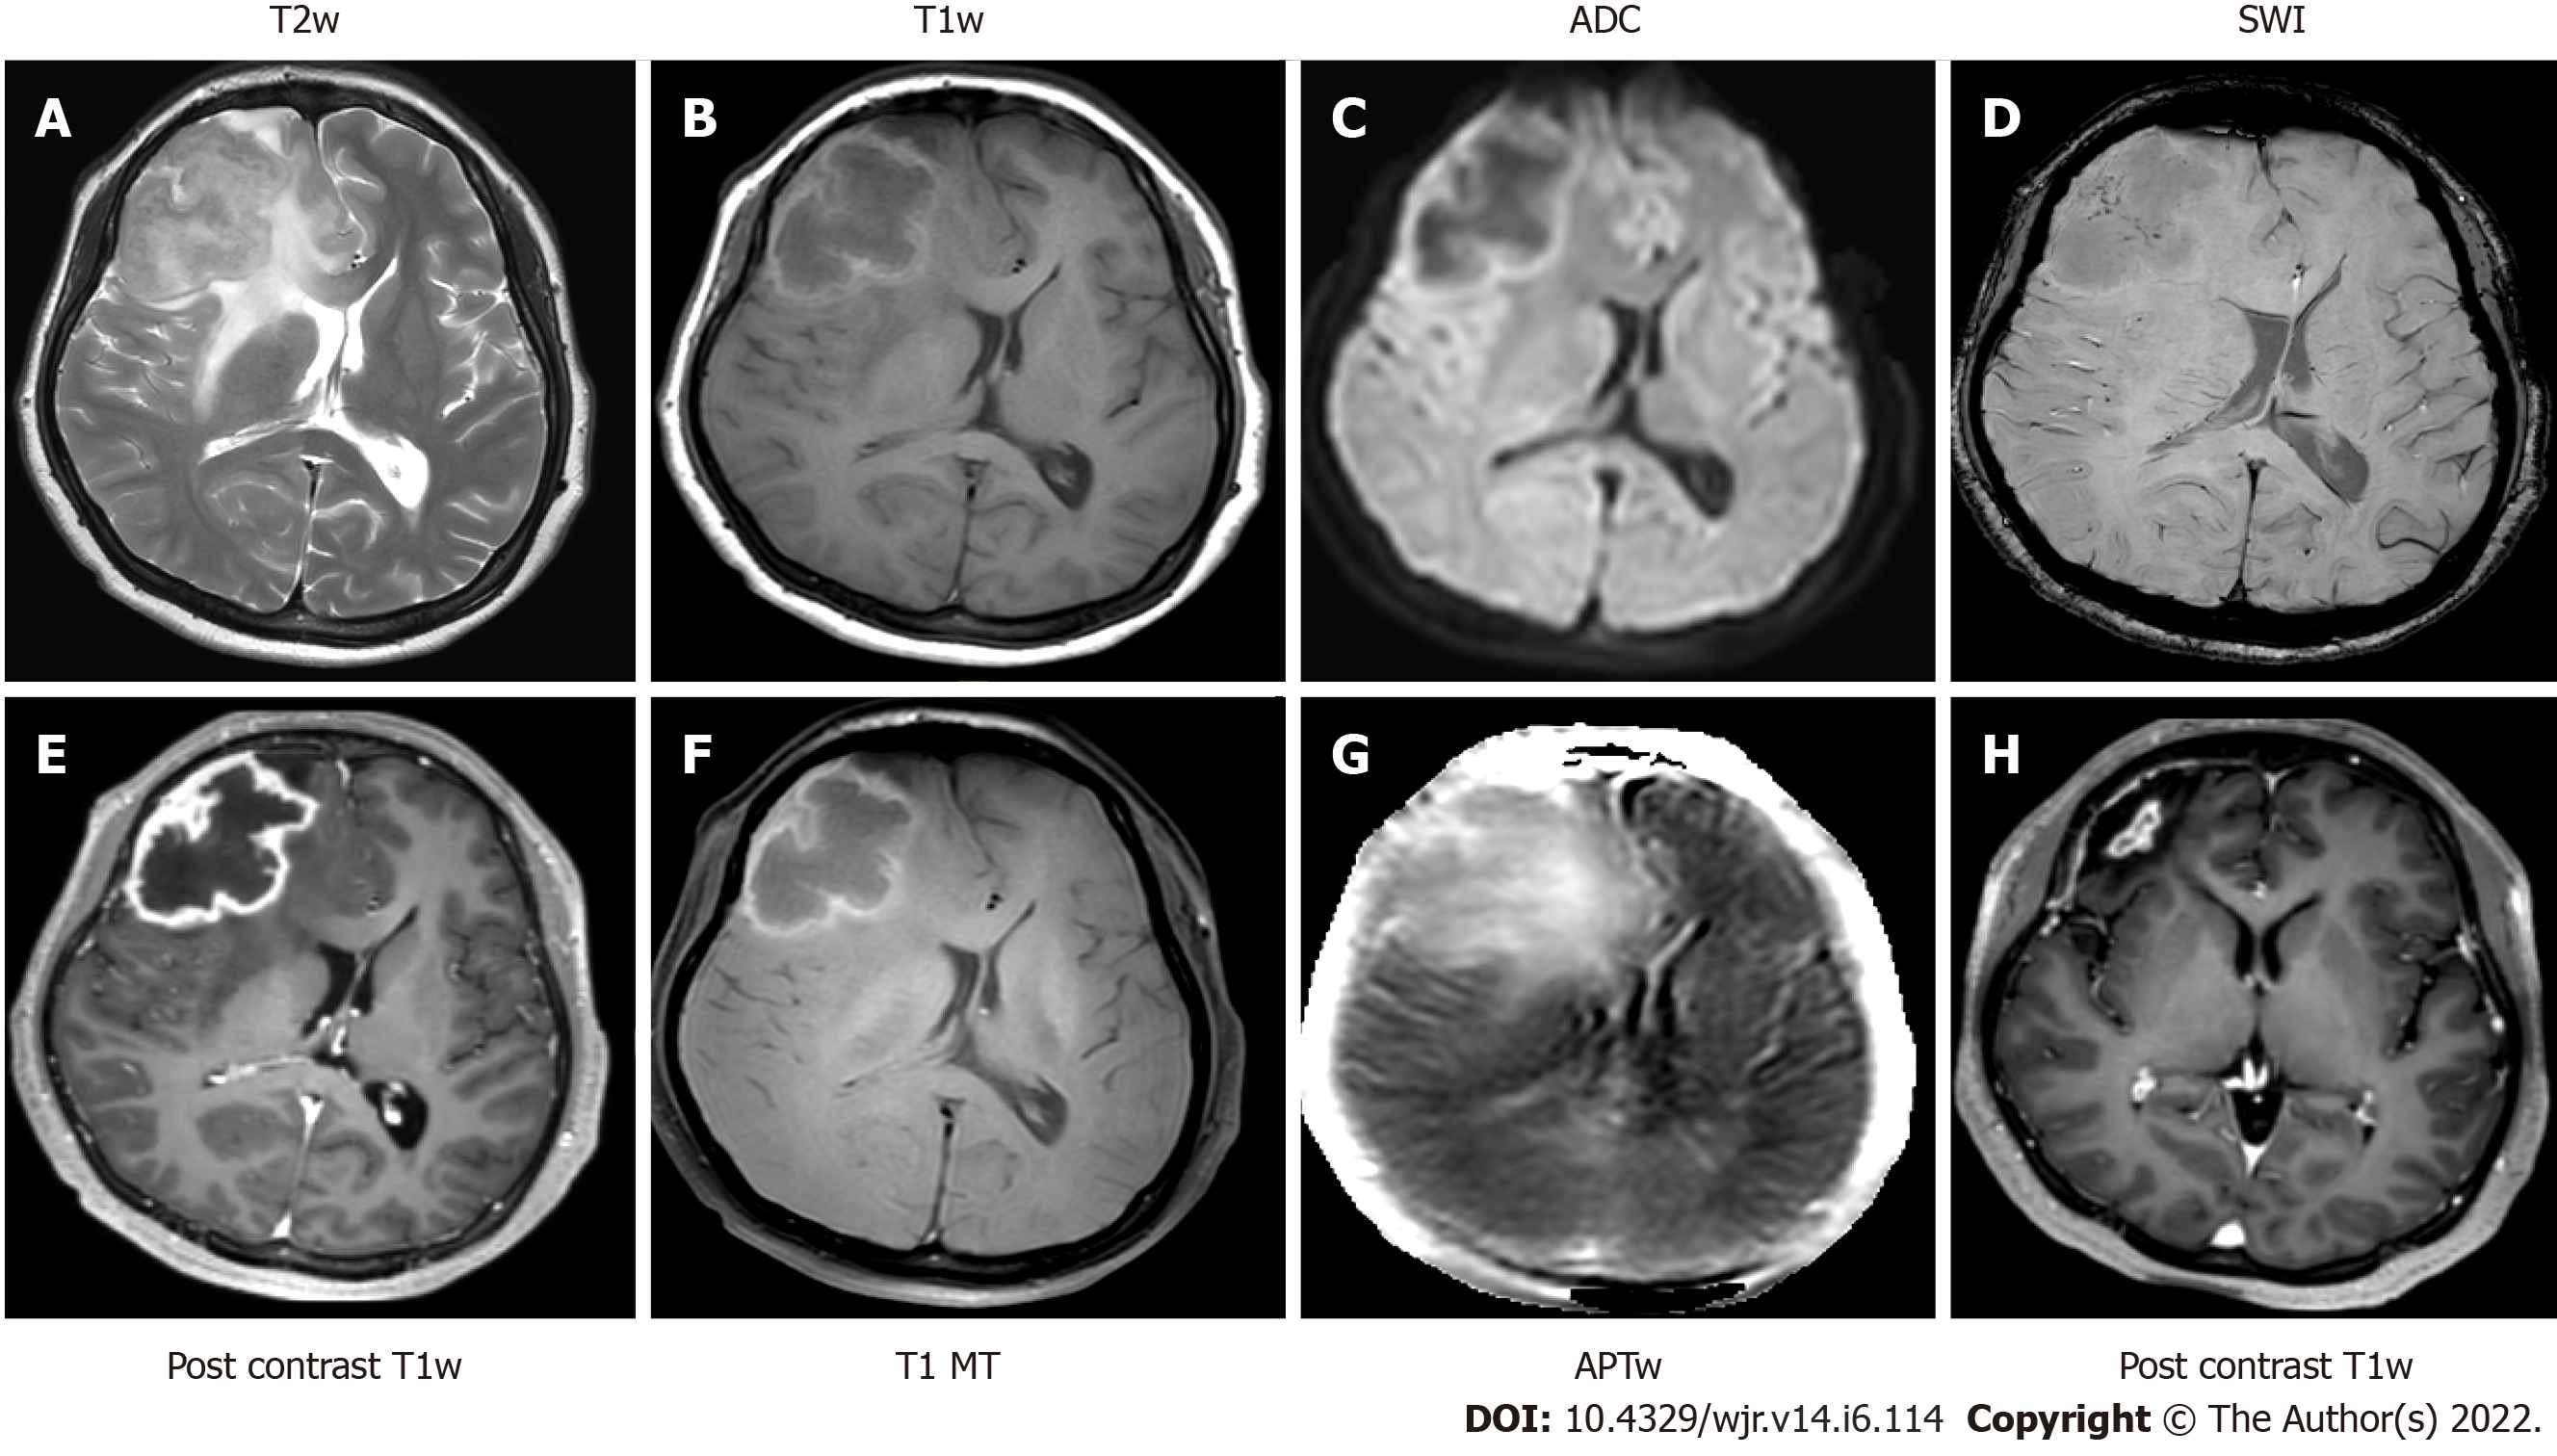
Figure 10 Magnetic resonance imaging - tuberculoma.
A: Axial T2-weighted imaging shows a variable T2 hypointense circumscribed mass lesion in the right anterior frontal region, with surrounding perilesional edema; B: T1 weighted imaging shows a peripheral T1 hyperintense rim; C: Apparent diffusion co-efficient map shows restriction of diffusion; D: Susceptibility weighted imaging demonstrates fine punctate intralesional foci of blooming; E Post contrast T1 weighted imaging showing slightly irregular peripheral rim enhancement; F: T1 magnetization transfer images; G: Amide proton transfer weighted images show elevated magnetization transfer asymmetry in the periphery of the lesion; H: T1 post contrast imaging after completion of anti-tuberculosis treatment reveals significant reduction in the size of the previously seen ring enhancing lesion. APT: Amide proton transfer. Images courtesy Dr. Saini J, Professor, Neuroimaging & IVR, NIMHANS, Bangalore.
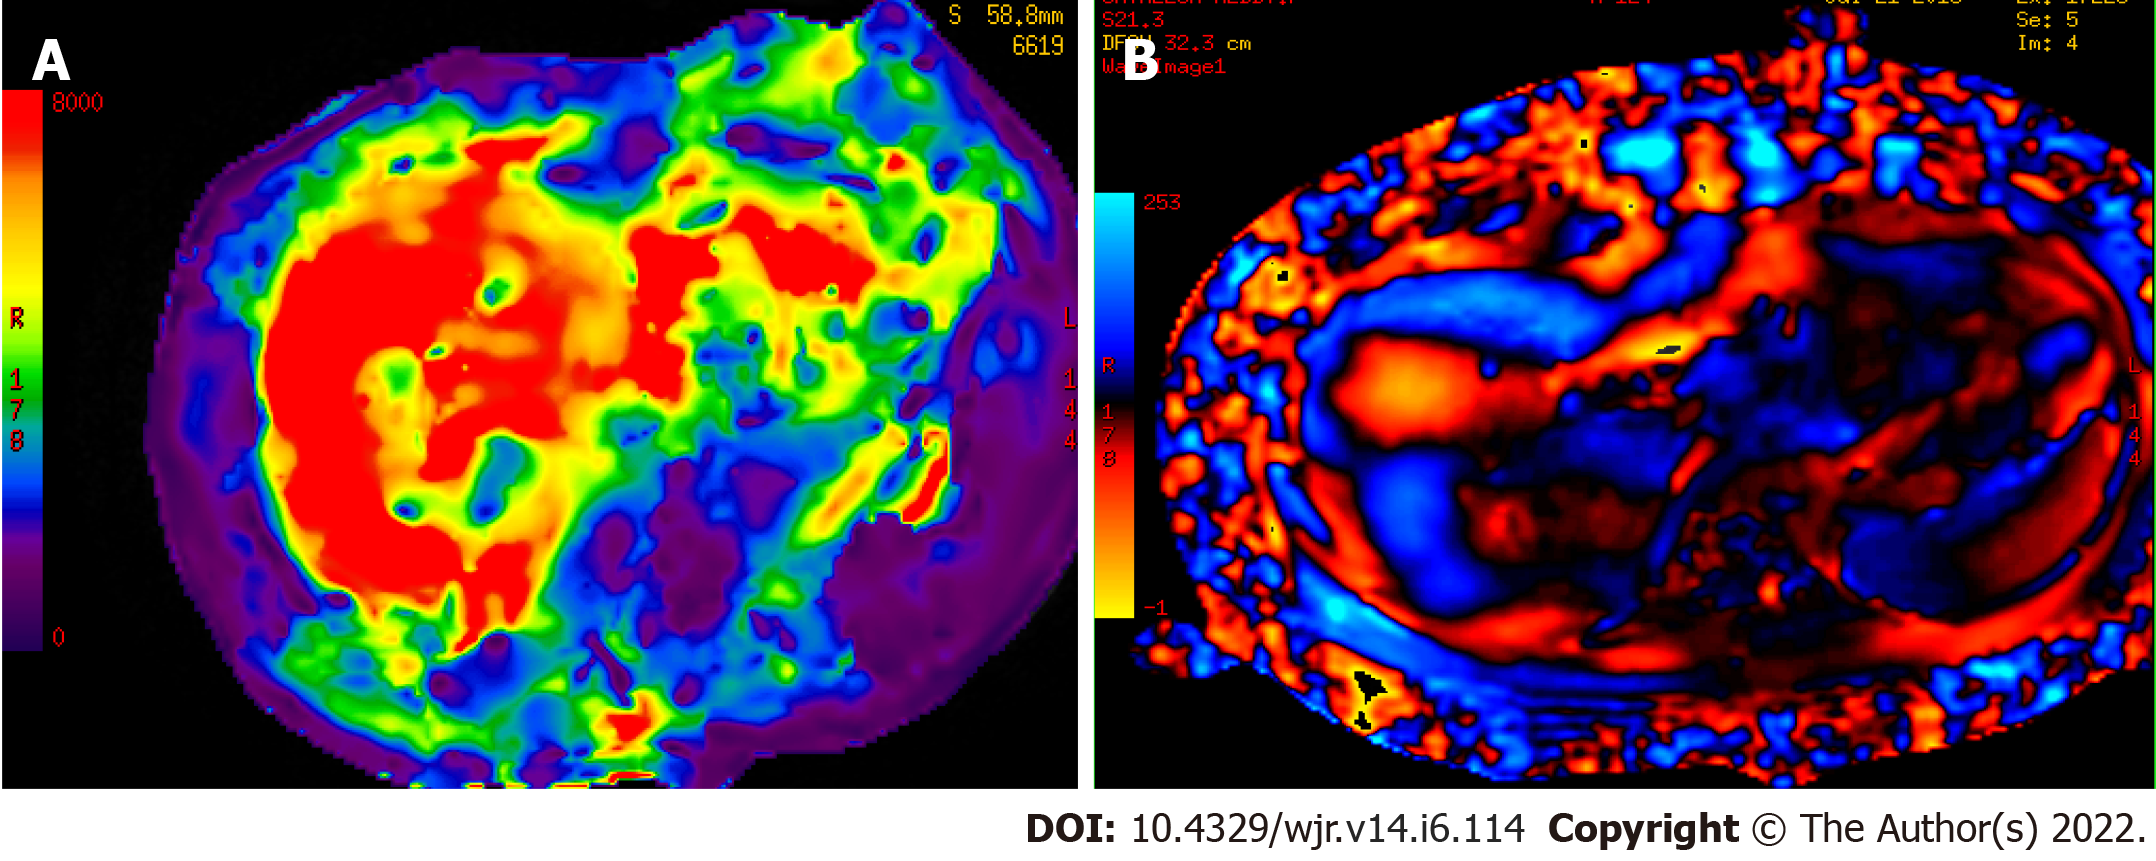
Figure 11 Post tuberculosis medication liver fibrosis on magnetic resonance elastography.
A: Color elastogram of liver with a 0-8kPa scale shows the stiffness distribution in organs for qualitative evaluation. Red or orange regions have higher stiffness values, whereas blue and purple regions are depictive of lower stiffness values. Severe Liver fibrosis is noted - 8.1kPa; B: Wave image of liver shows excellent wave propagation anteriorly and laterally. Low amplitude waves with wave distortion observed in segment VII and II of liver. Images courtesy Dr. Bhaskar N, Vista Imaging Centre, Bangalore.
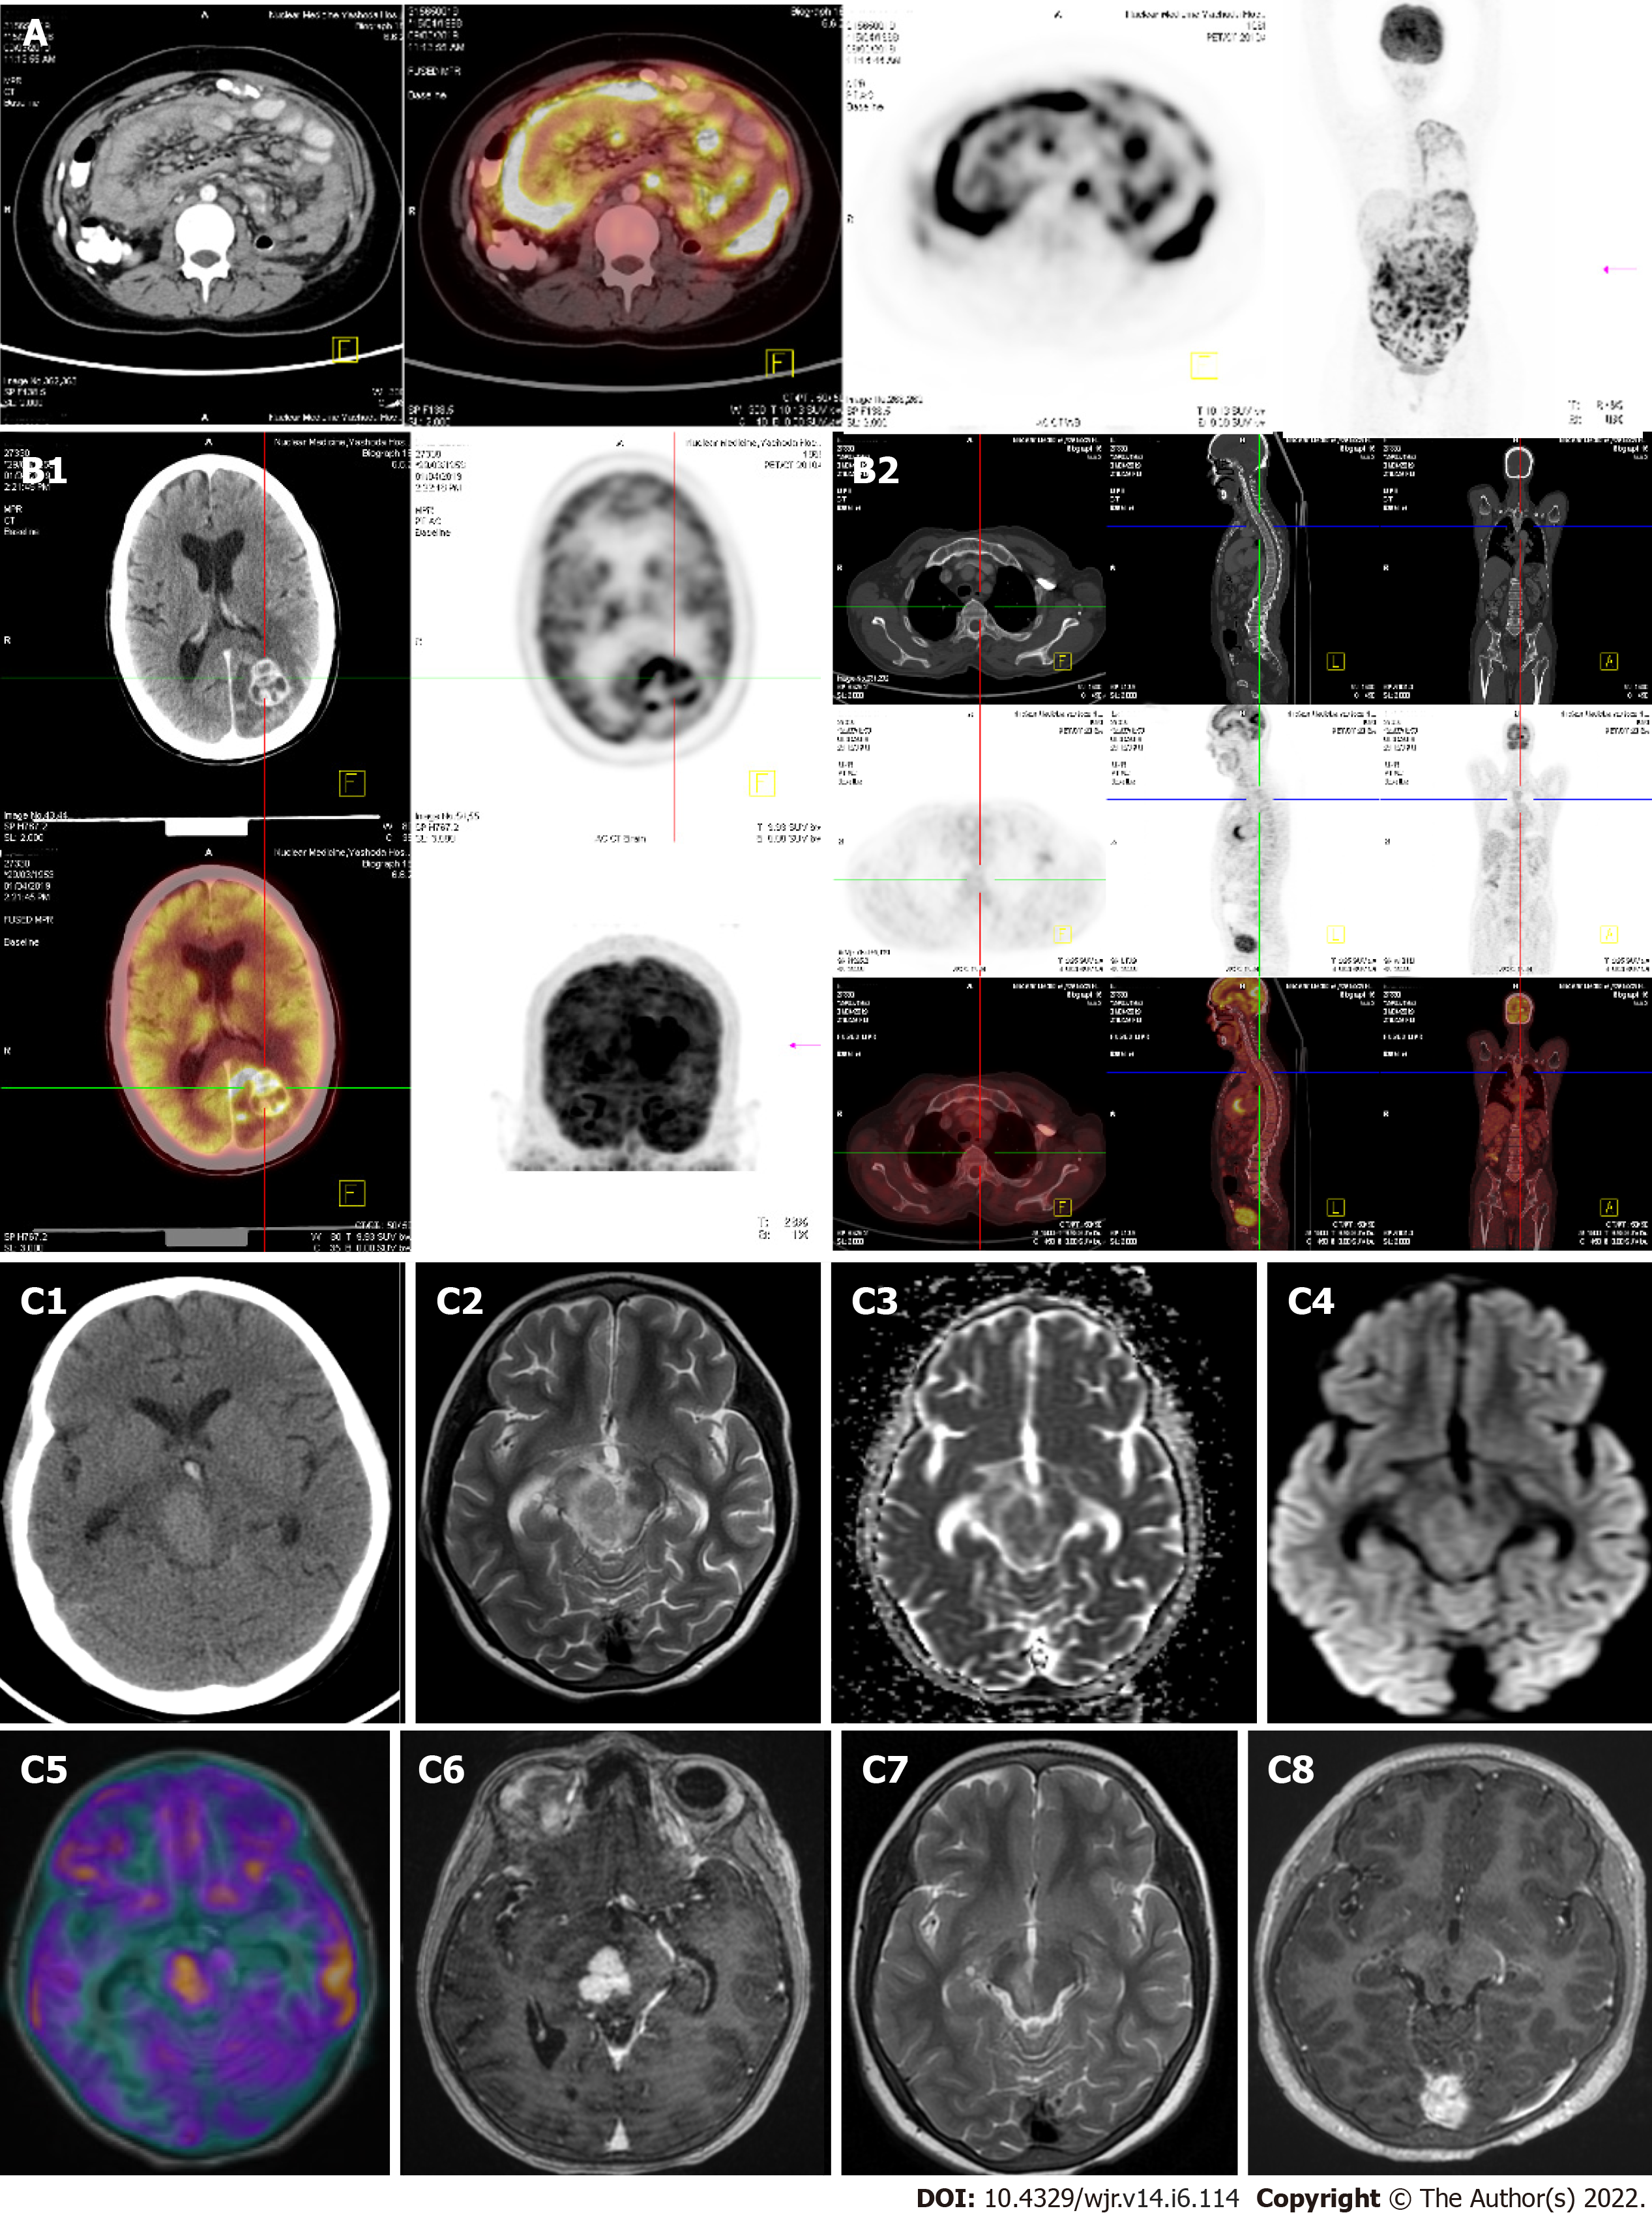
Figure 12 Fusion imaging.
A: Fluoro-deoxyglucose (FDG) positron emission tomography (PET)/computed tomography (CT) Abdominal tuberculosis: 55-year F - h/o loss of weight with mild abdominal pain on and off gradually increasing (for 4 mo). Low grade evening rise of fever. Whole body PET CT showing irregular peritoneal thickening with nodularities and cocoon formation. PET and fused PET-CT images showing significant amount of uptake with SUV max of 12.3; B: Whole body FDG-PET/CT - Brain Tuberculomas:45 years male - h/o seizures for 5 mo, gradually increasing in frequency. PET-CT advised for the possibility of metastases; B1: Whole body FDG-PET/CT done showing irregular ring enhancing lesions in the brain with peri-lesional edema. PET and fused PET-CT images showing significant amount of uptake with SUV max of 14.8; B2: There is no other abnormal uptake in the entire body. (Normal myocardial uptake and left axillary vessel uptake is noted); C: Fusion imaging (MR-PET): Tuberculoma with Rubral tremor. 12-year-old girl presented with right 3rd and 4th cranial nerve palsy along with rhythmic to and fro left ‘shoulder joint tremor’ which worsened with movement; C1: Axial non-contrast CT image demonstrates a well circumscribed hyperdense mass lesion within the right half of the midbrain; C2: T2-weighted imaging shows variable T2 hypo intensity within the lesion; C3 and C4: Diffusion weighted imaging and apparent diffusion co-efficient maps reveal restricted diffusion within the lesion; C5: Fusion imaging (T1W and PET) demonstrates avid glucose uptake within the lesion; C6: Post contrast T1 weighted imaging with fat saturation, reveals intense nodular enhancement. Stereotactic biopsy of the lesion revealed granulomatous inflammatory pathology; C7 and C8: After completion of anti-tuberculosis treatment, resolution of the granulomatous lesion with residual gliosis was observed on T2 weighted and Post contrast fat saturated T1w images. Images (A & B) courtesy Dr. Sikander Shaikh, Consultant radiologist, Yashodha Hospital, Hyderabad & Image (C) courtesy Dr. Saini J, Professor, Neuroimaging & IVR, NIMHANS, Bangalore.
- Citation: Merchant SA, Shaikh MJS, Nadkarni P. Tuberculosis conundrum - current and future scenarios: A proposed comprehensive approach combining laboratory, imaging, and computing advances. World J Radiol 2022; 14(6): 114-136
- URL: https://www.wjgnet.com/1949-8470/full/v14/i6/114.htm
- DOI: https://dx.doi.org/10.4329/wjr.v14.i6.114


