
















Copyright: ©Author(s) 2026.
World J Cardiol. Jul 26, 2026; 18(7): 120097
Published online Jul 26, 2026. doi: 10.4330/wjc.v18.i7.120097
Published online Jul 26, 2026. doi: 10.4330/wjc.v18.i7.120097
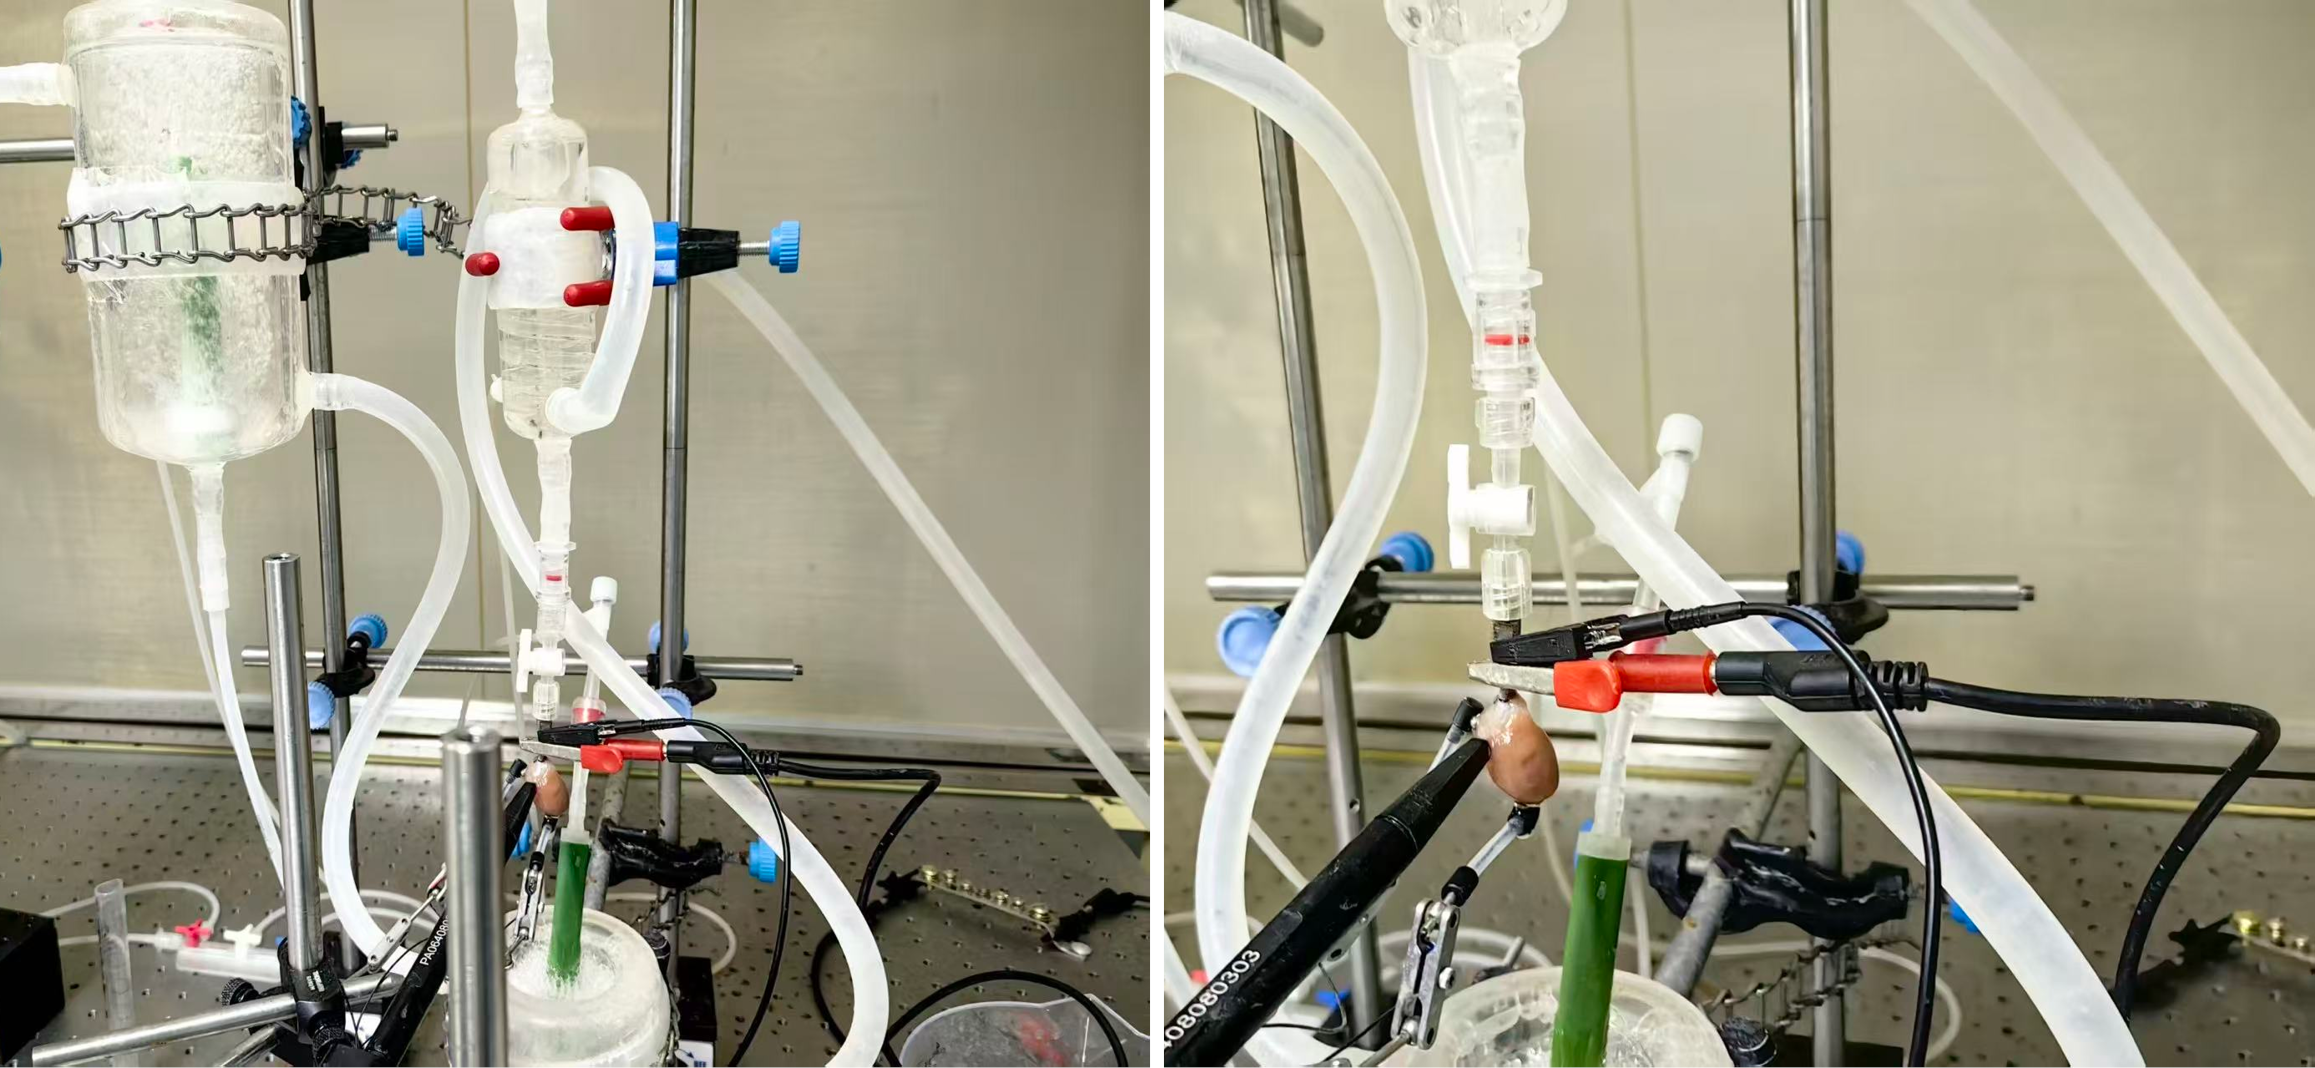
Figure 1
Electrophysiological conduction measurements in isolated hearts of septic rats.
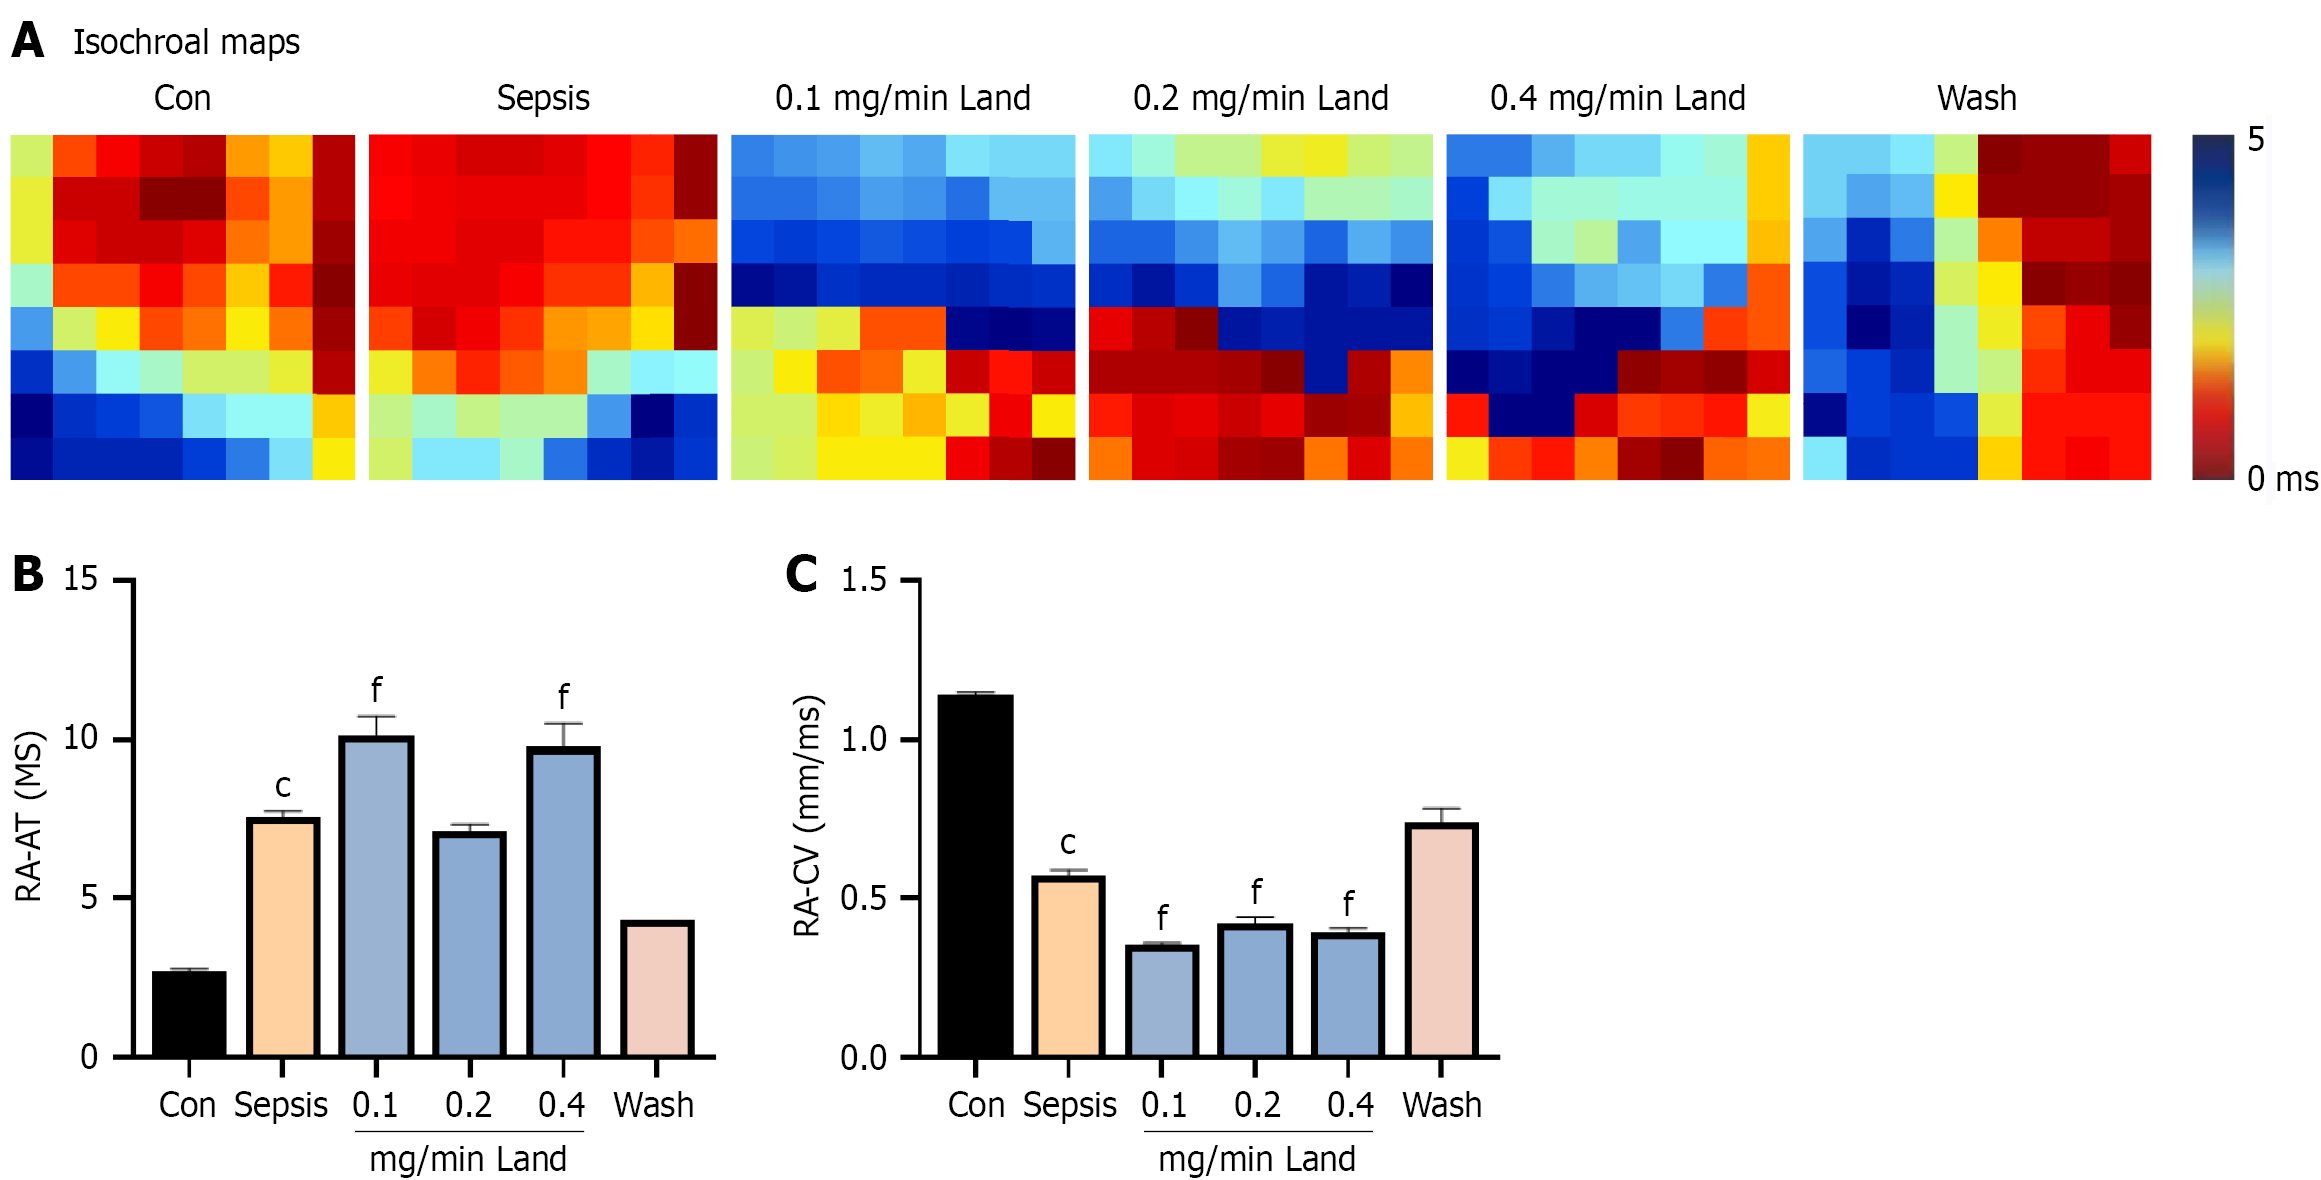
Figure 2 Effects of landiolol on right atrial conduction time and conduction velocity in septic rats: An electrophysiological mapping study.
A: Conduction maps of isolated perfused hearts across groups; B: Atrial conduction time among the groups; C: Atrial conduction velocity in different groups. Results are shown as mean ± SEM. cP < 0.001 vs control, fP < 0.001 vs sepsis. Con: Control; RA-AT: Atrial conduction time; RA-CV: Atrial conduction velocity.
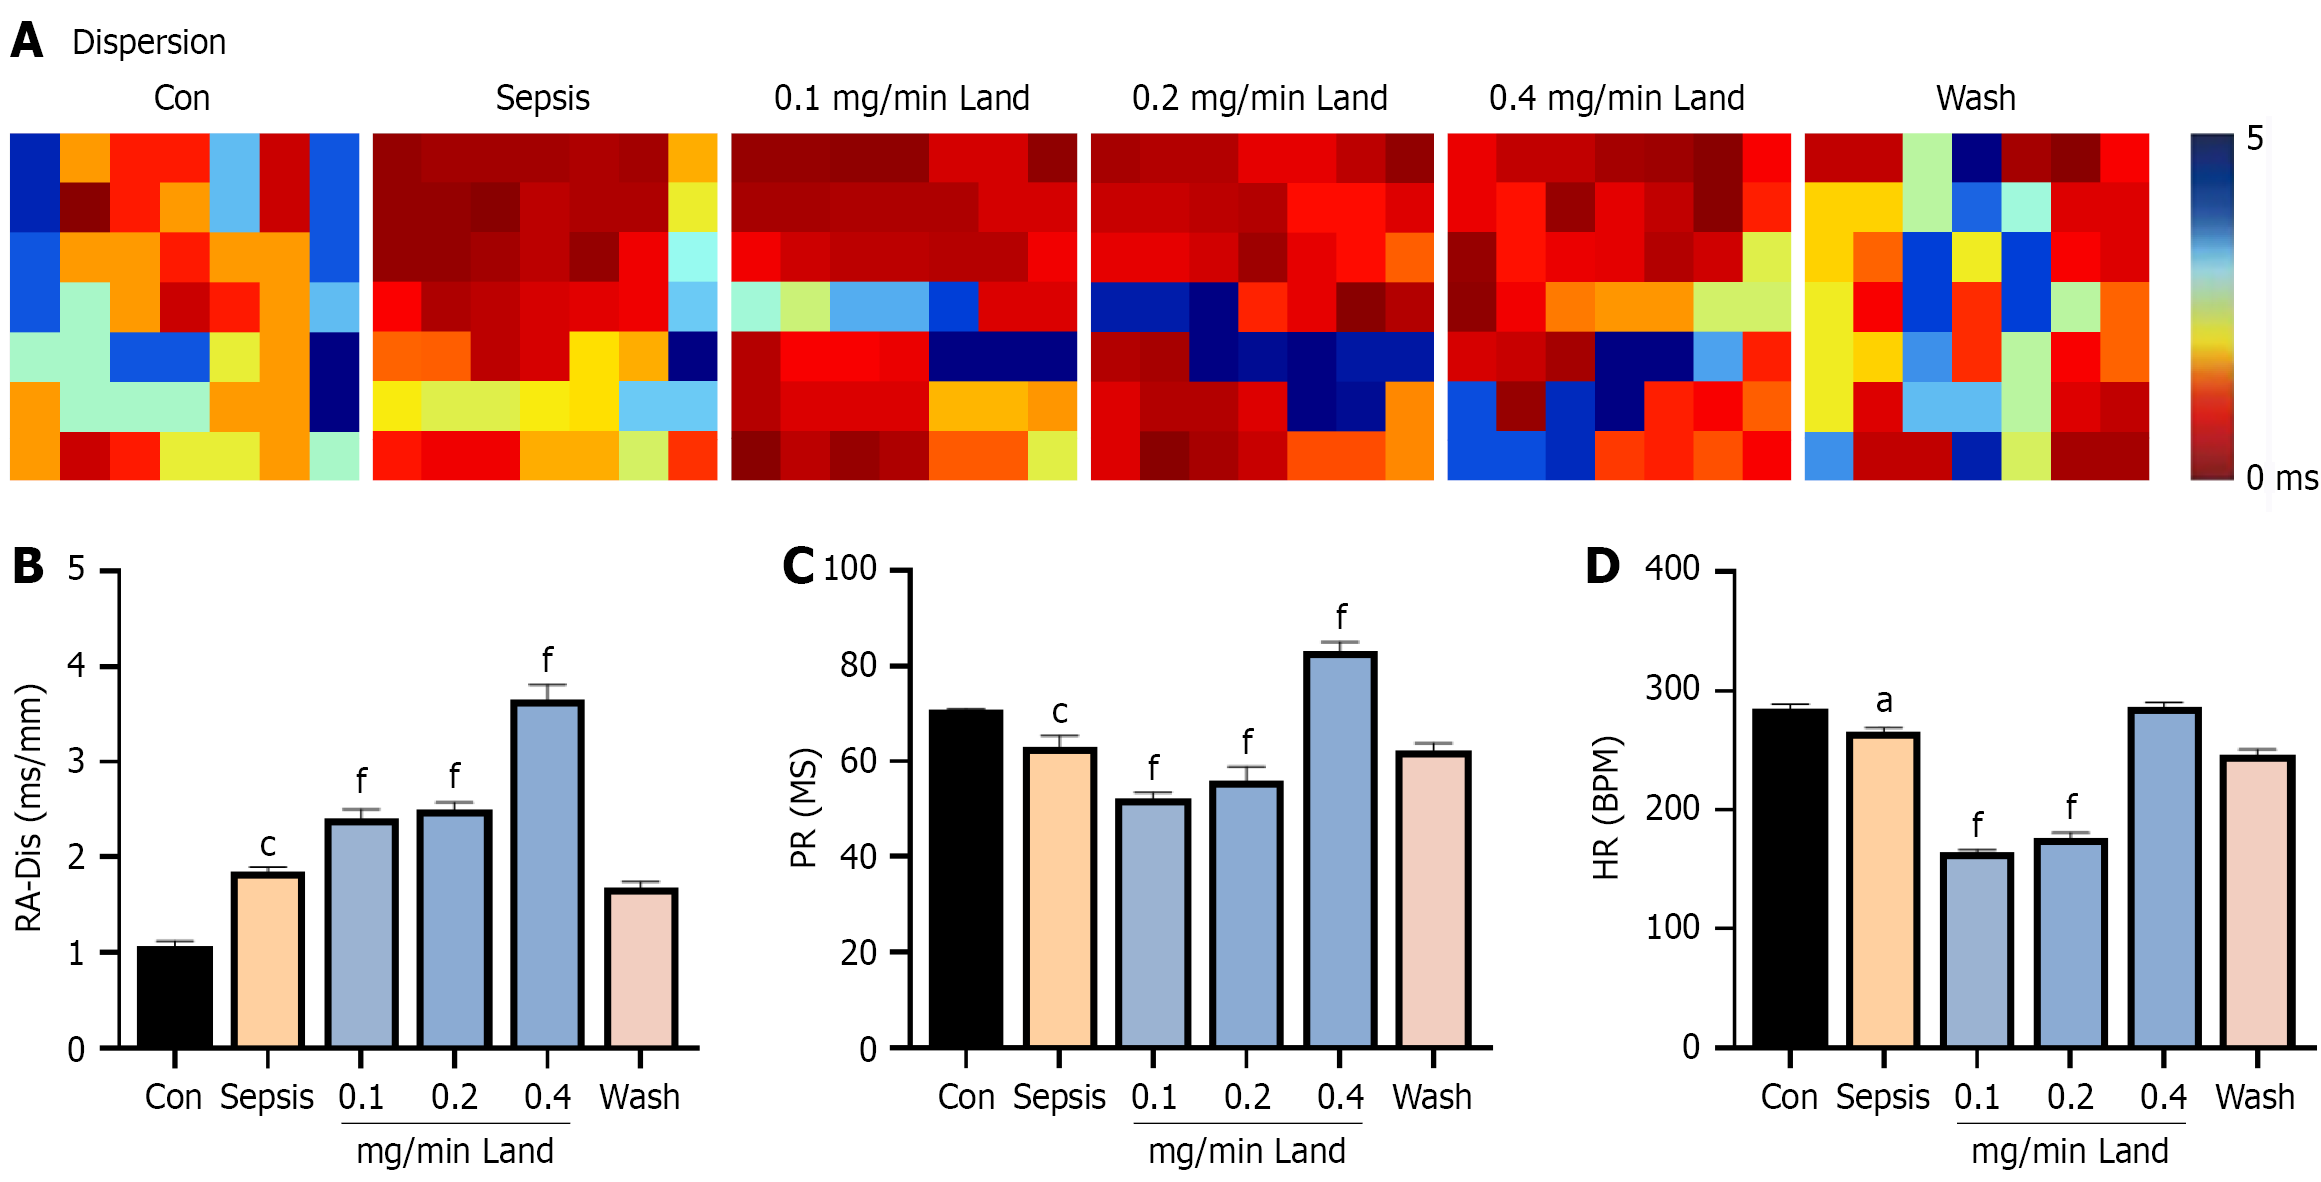
Figure 3 Effects of landiolol on right atrial conduction dispersion and basic electrophysiological parameters in septic rats.
A: Conduction maps of isolated perfused hearts across the groups; B: Atrial conduction dispersion among the groups; C: PR interval; D: Heart rate. Results are shown as mean ± SEM. aP < 0.05 vs control, cP < 0.001 vs control, fP < 0.001 vs sepsis. Con: Control; HR: Heart rate; RA-Dis: Atrial conduction dispersion.
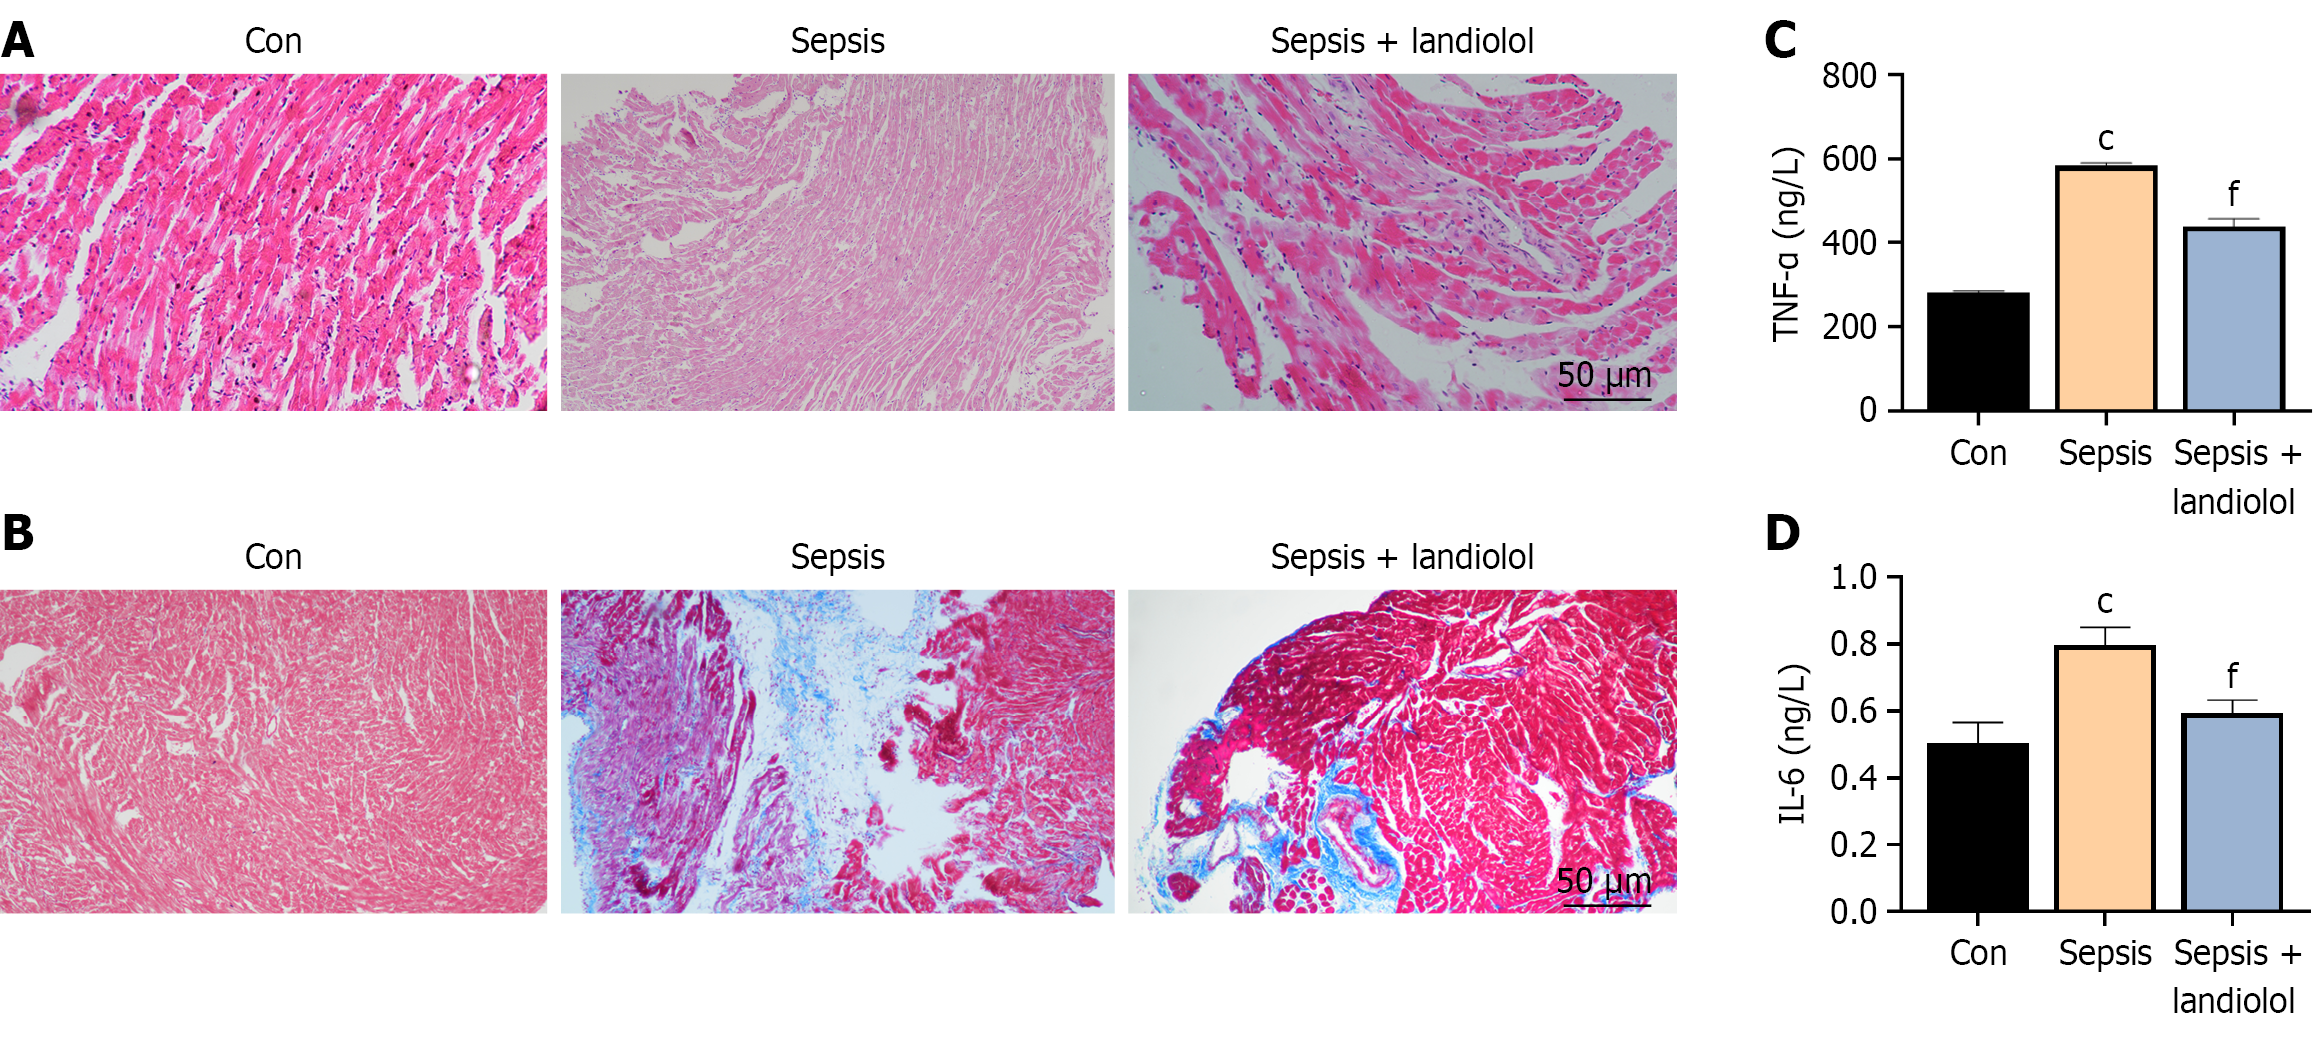
Figure 4 Landiolol reduced myocardial injury and fibrosis.
A: Representative heart sections stained with hematoxylin and eosin in each group; B: Representative heart sections stained with Masson’s staining in each group; C: Serum levels of tumor necrosis factor-α were measured by enzyme-linked immunosorbent assay; D: Serum levels of Interleukin-6 were measured by enzyme-linked immunosorbent assay. Results are shown as mean ± SD. cP < 0.001 vs control, fP < 0.001 vs sepsis. Con: Control; IL-6: Interleukin-6; TNF-α: Tumor necrosis factor-α.
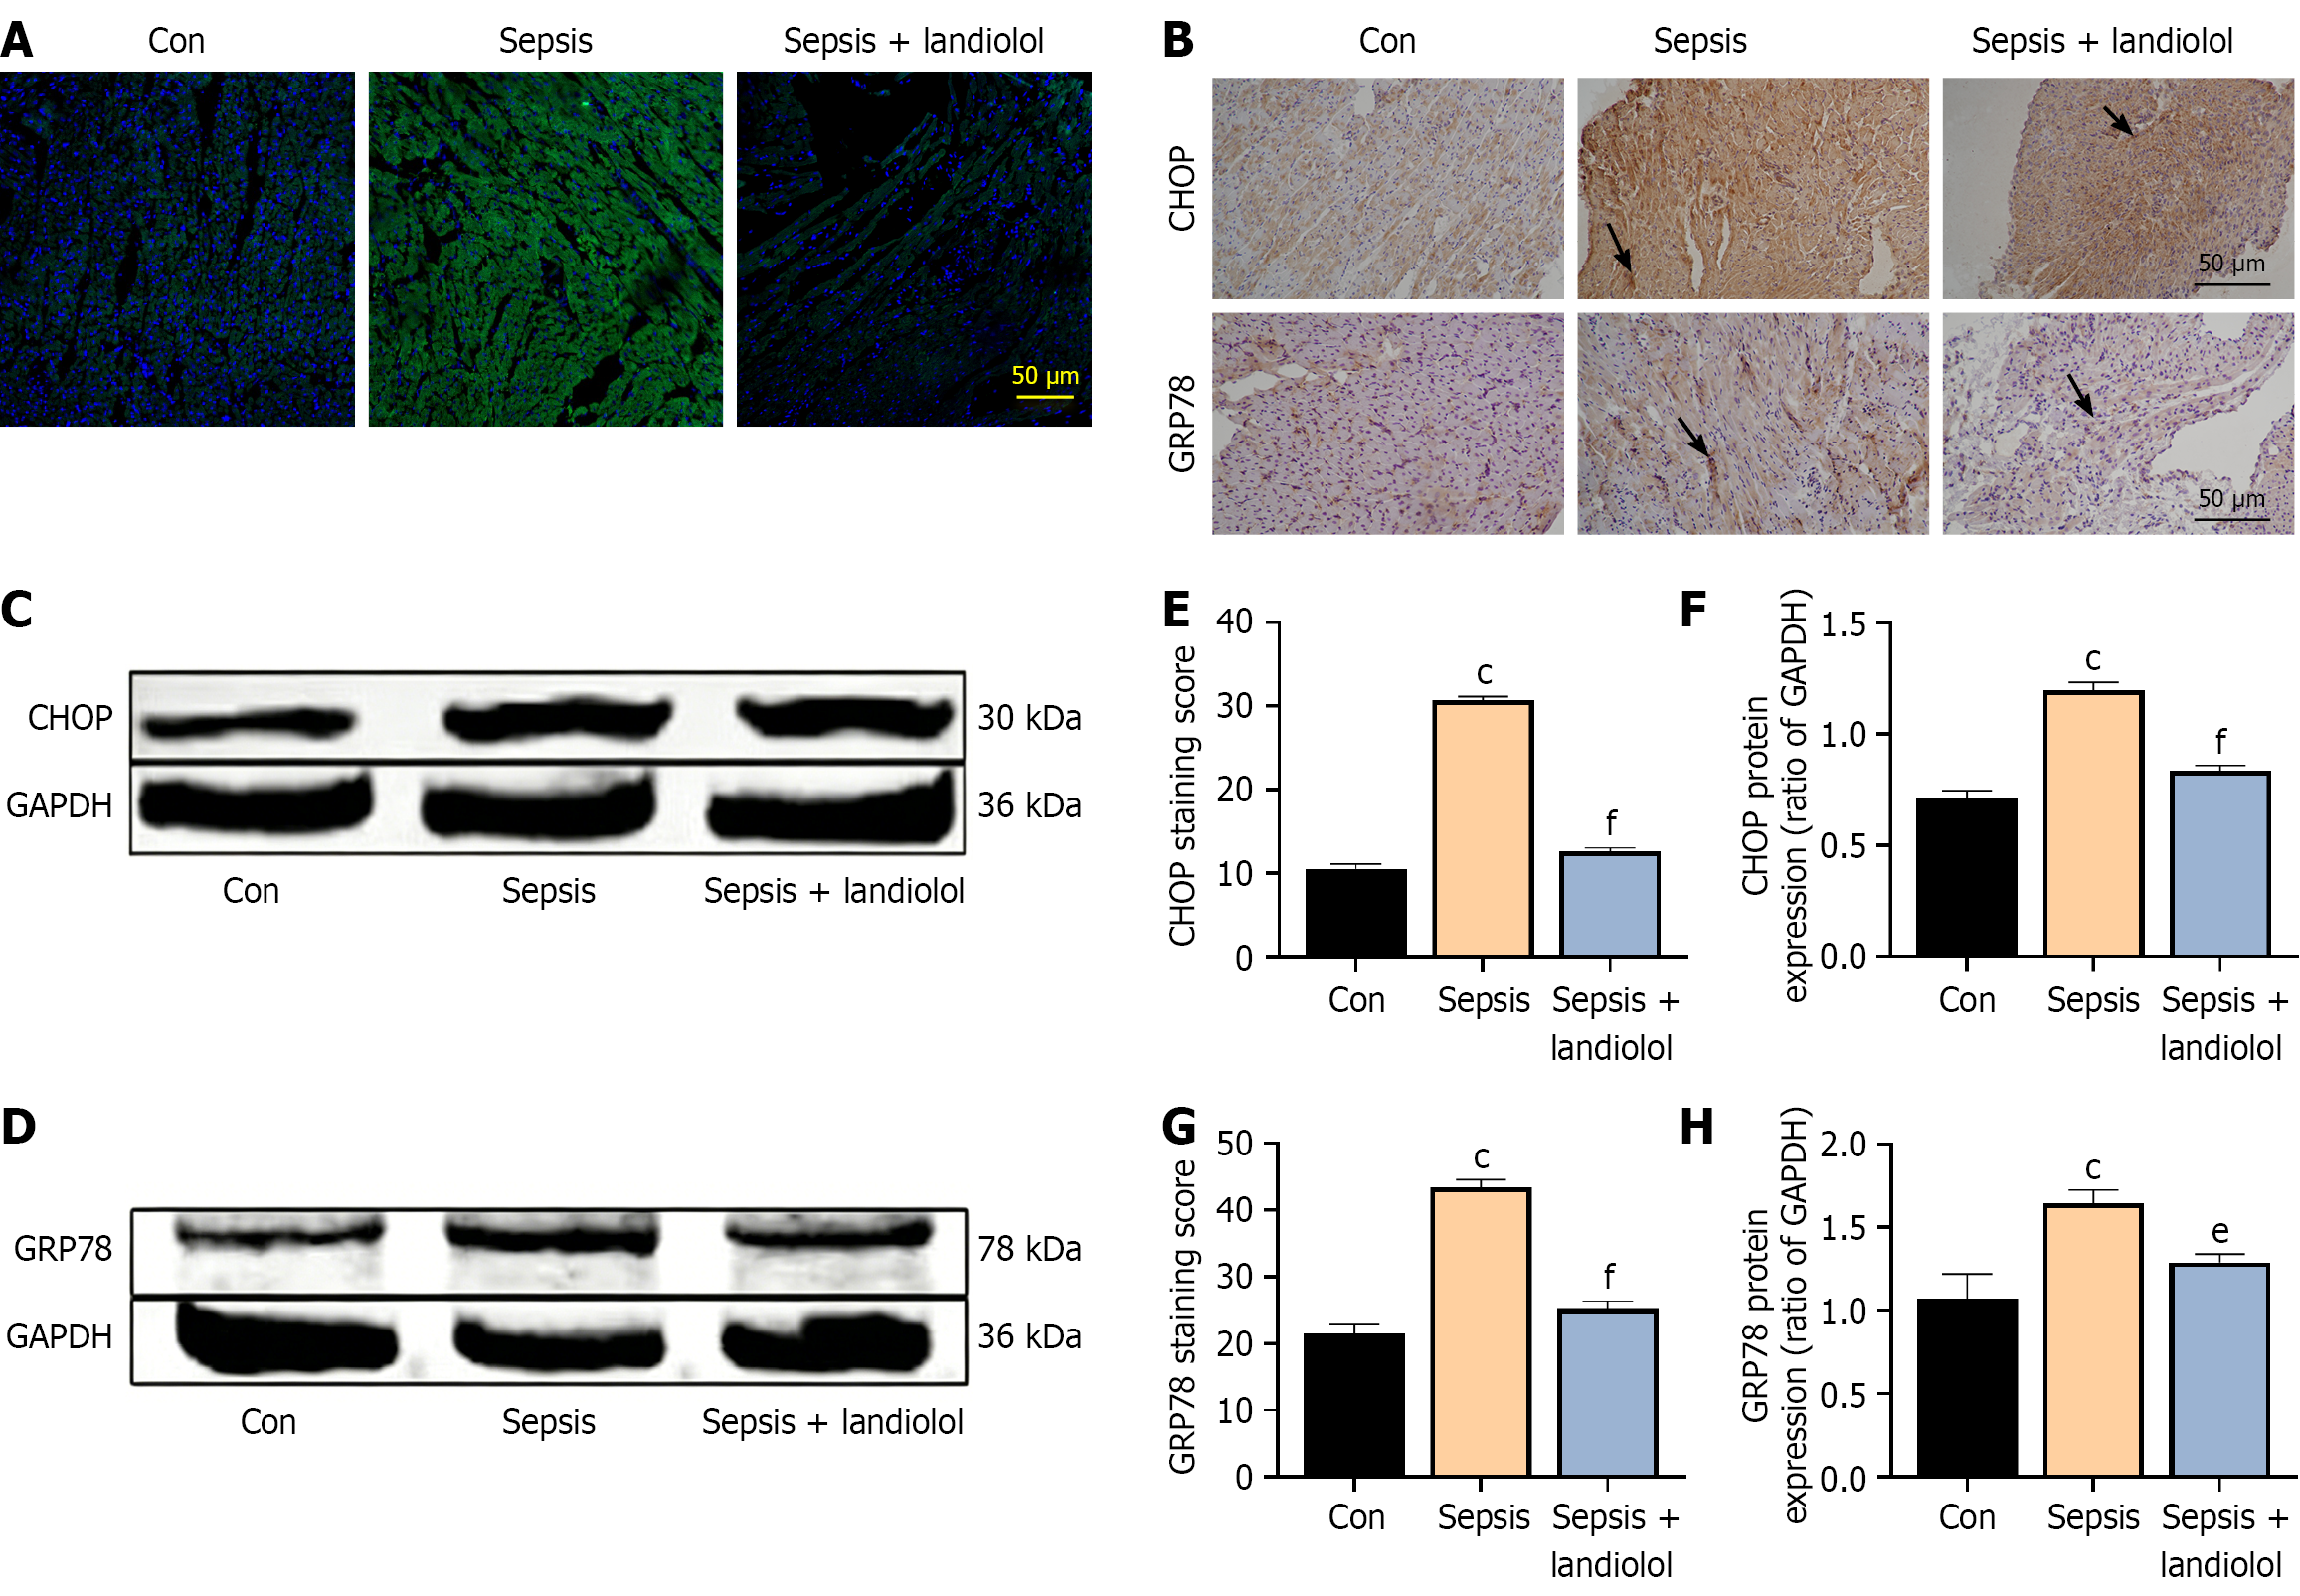
Figure 5 Landiolol reduced endoplasmic reticulum stress-induced apoptosis in sepsis rat hearts.
A: Transferase dUTP nick end labeling analysis of apoptosis in sepsis rat hearts; B: Immunohistochemistry analysis of glucose-regulated protein 78 (GRP78) and C/EBP homologous protein (CHOP) levels in rat hearts; C and D: Western blot analysis of GRP78 and CHOP levels in rat hearts; E: Quantitative analysis in immunohistochemistry analysis of CHOP; F: Quantitative analysis of CHOP; G: Quantitative analysis in immunohistochemistry analysis of GRP78; H: Quantitative analysis of GRP78. Results are shown as mean ± SD. cP < 0.001 vs control, eP < 0.01 vs sepsis; fP < 0.001 vs sepsis. Con: Control; CHOP: C/EBP homologous protein; GRP78: Glucose-regulated protein 78.
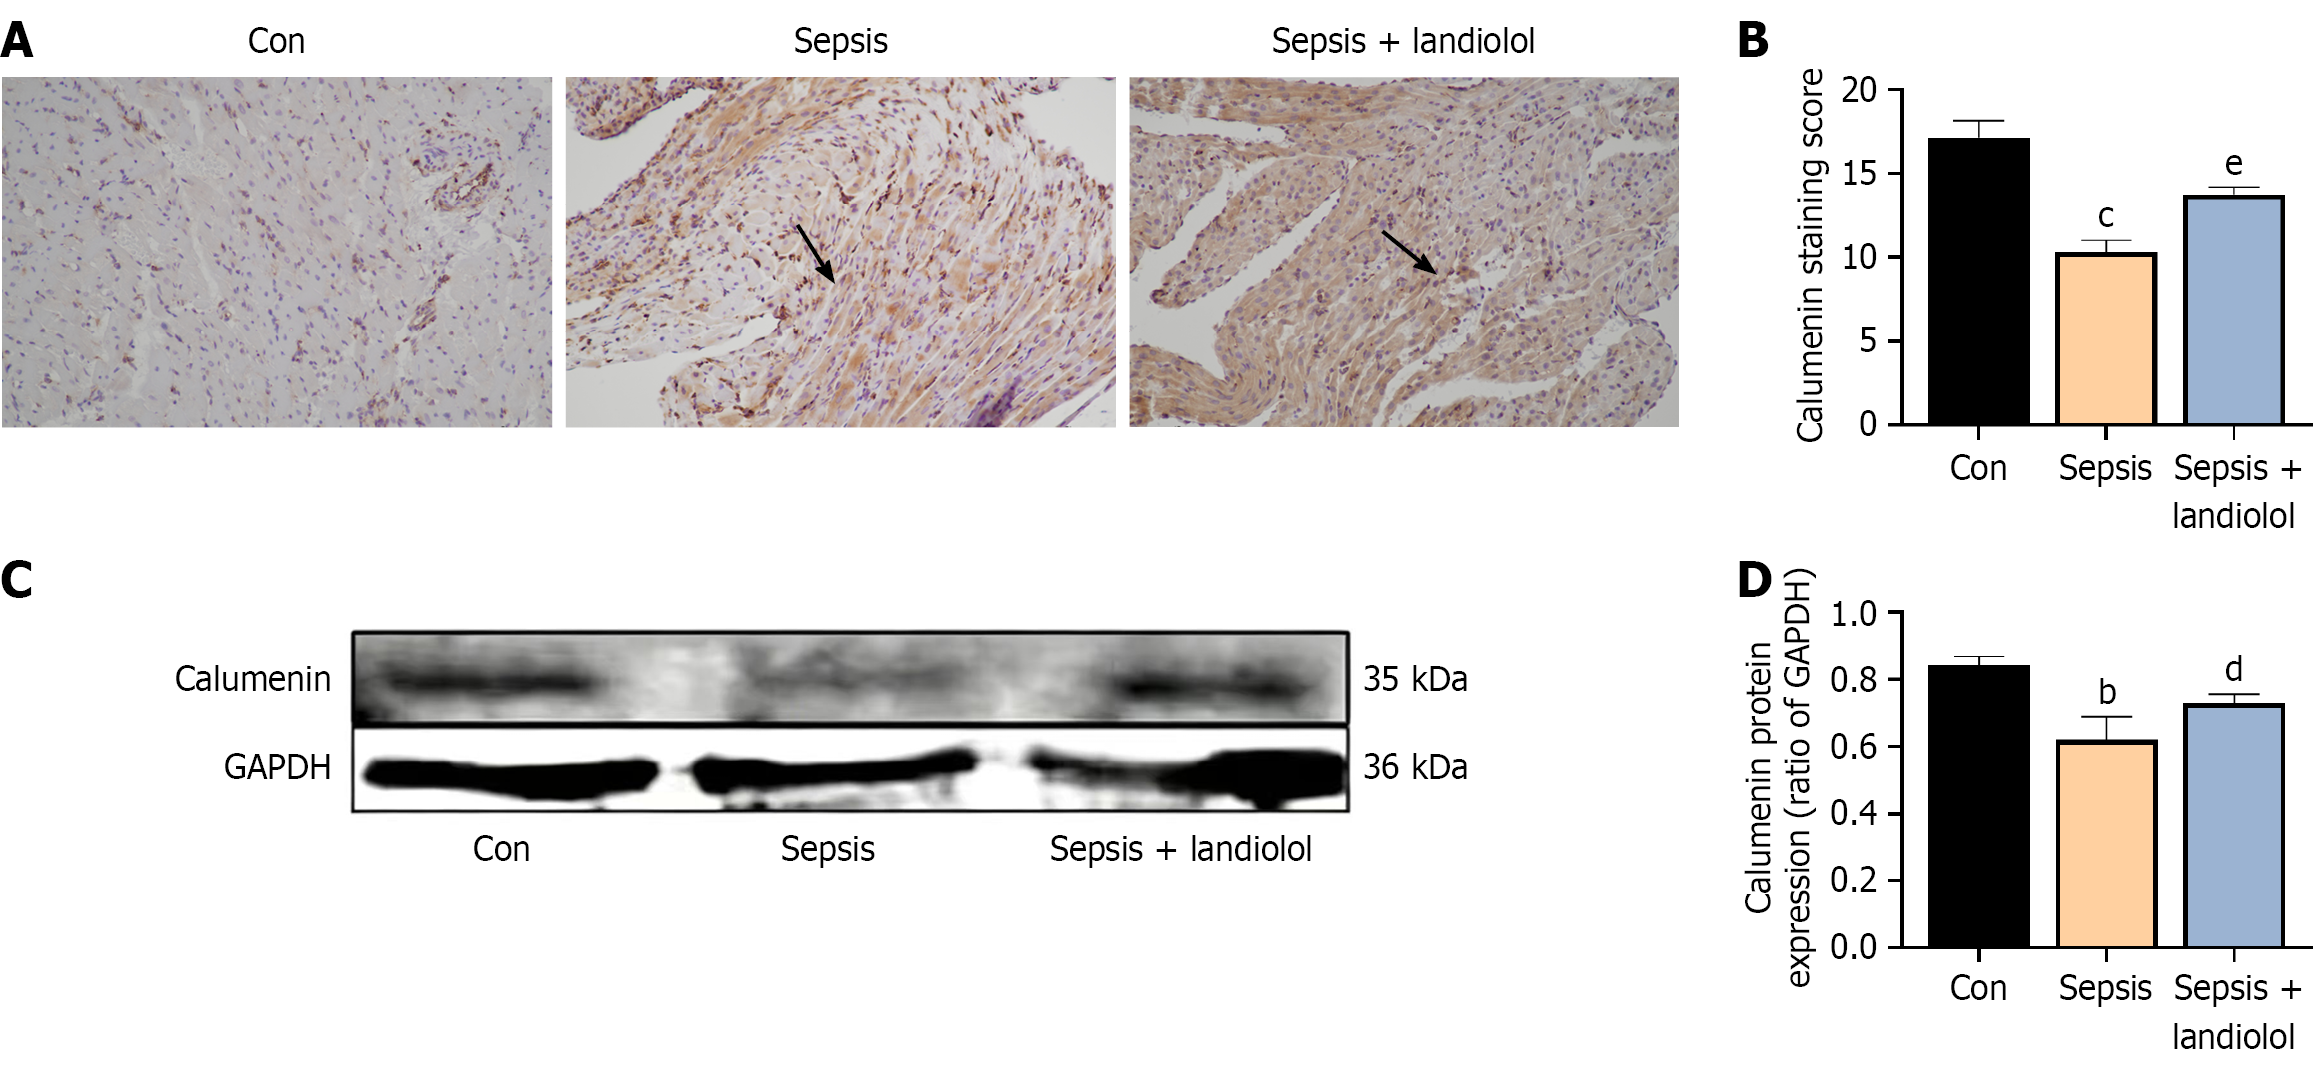
Figure 6 Landiolol up-regulated calumenin expression.
A and B: Immunohistochemistry analysis of calumenin levels in rat hearts; C and D: Western blot analysis of calumenin levels in rat hearts. Results are shown as mean ± SD. bP < 0.01 vs control, cP < 0.001 vs control, dP < 0.05 vs sepsis, eP < 0.01 vs sepsis. Con: Control.
- Citation: He ZH, Wu LK, Liu H, Bai LY, Du JJ, Ma KY, Wang Y, Zhao M. Landiolol attenuates atrial remodeling in septic rats by upregulating calumenin. World J Cardiol 2026; 18(7): 120097
- URL: https://www.wjgnet.com/1949-8462/full/v18/i7/120097.htm
- DOI: https://dx.doi.org/10.4330/wjc.v18.i7.120097