Copyright
©The Author(s) 2025.
World J Cardiol. Nov 26, 2025; 17(11): 112018
Published online Nov 26, 2025. doi: 10.4330/wjc.v17.i11.112018
Published online Nov 26, 2025. doi: 10.4330/wjc.v17.i11.112018
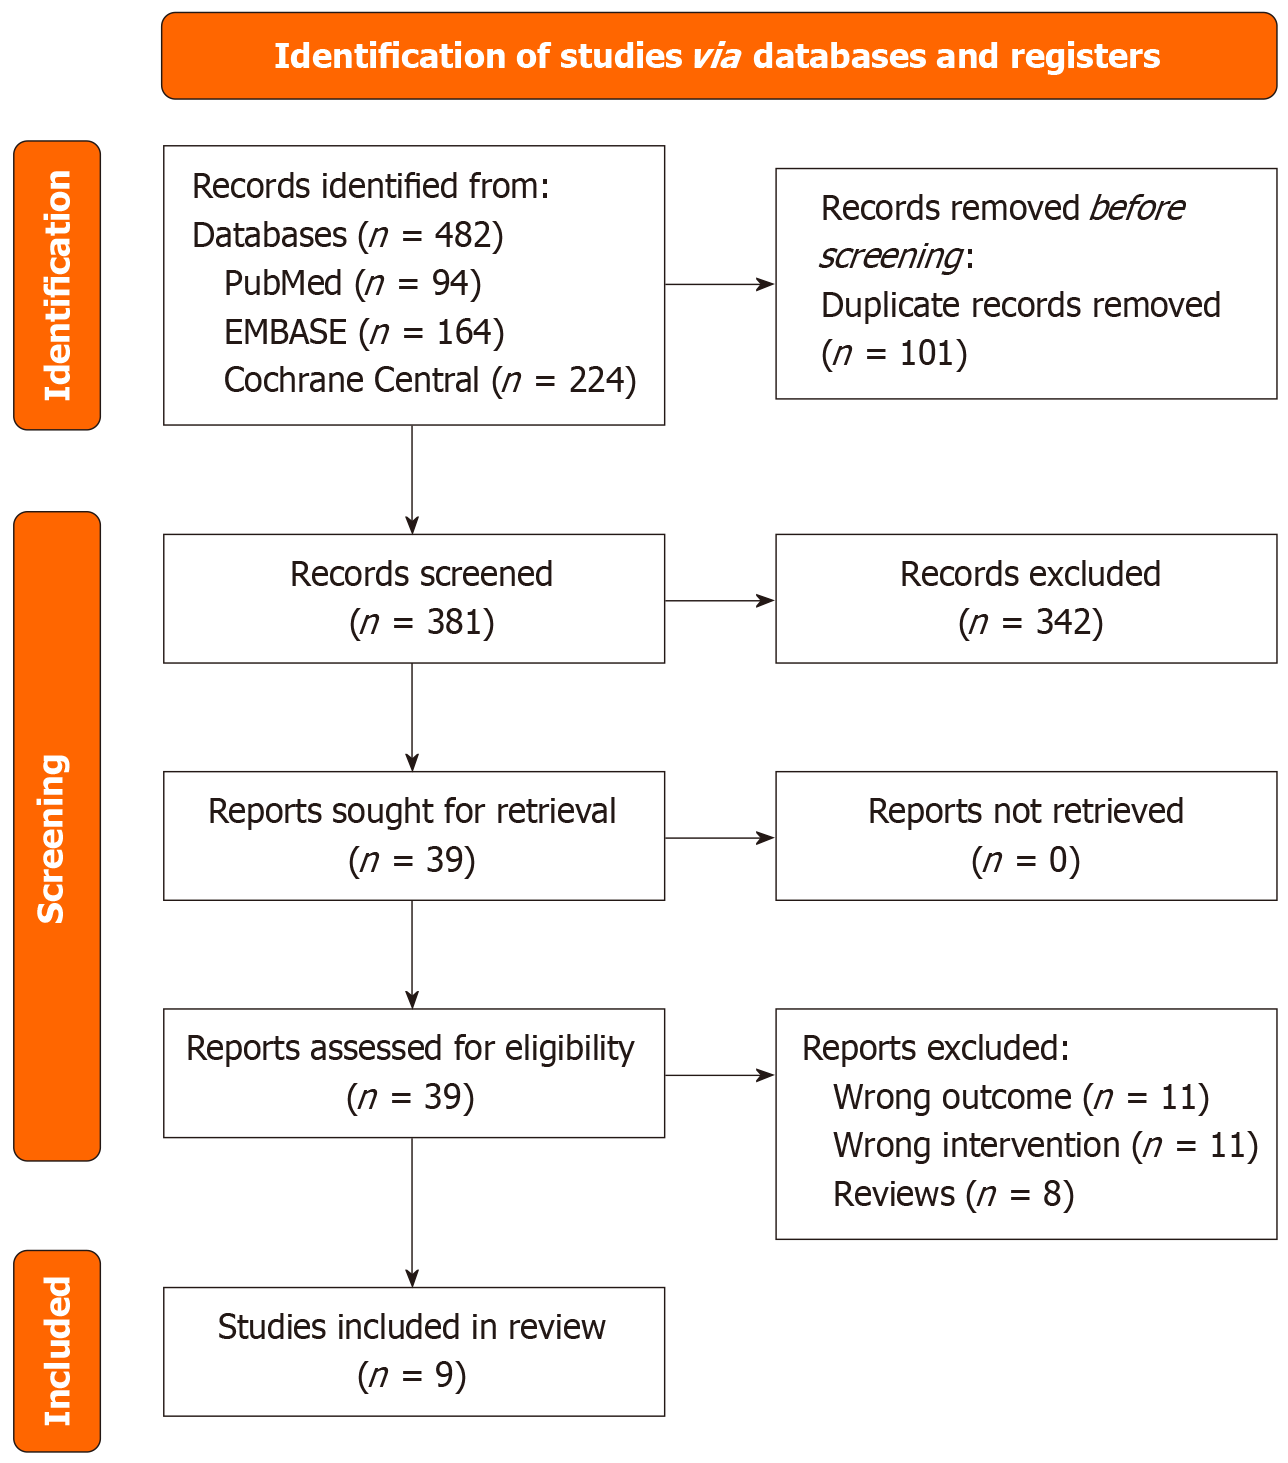
Figure 1
PRISMA chart of included studies.
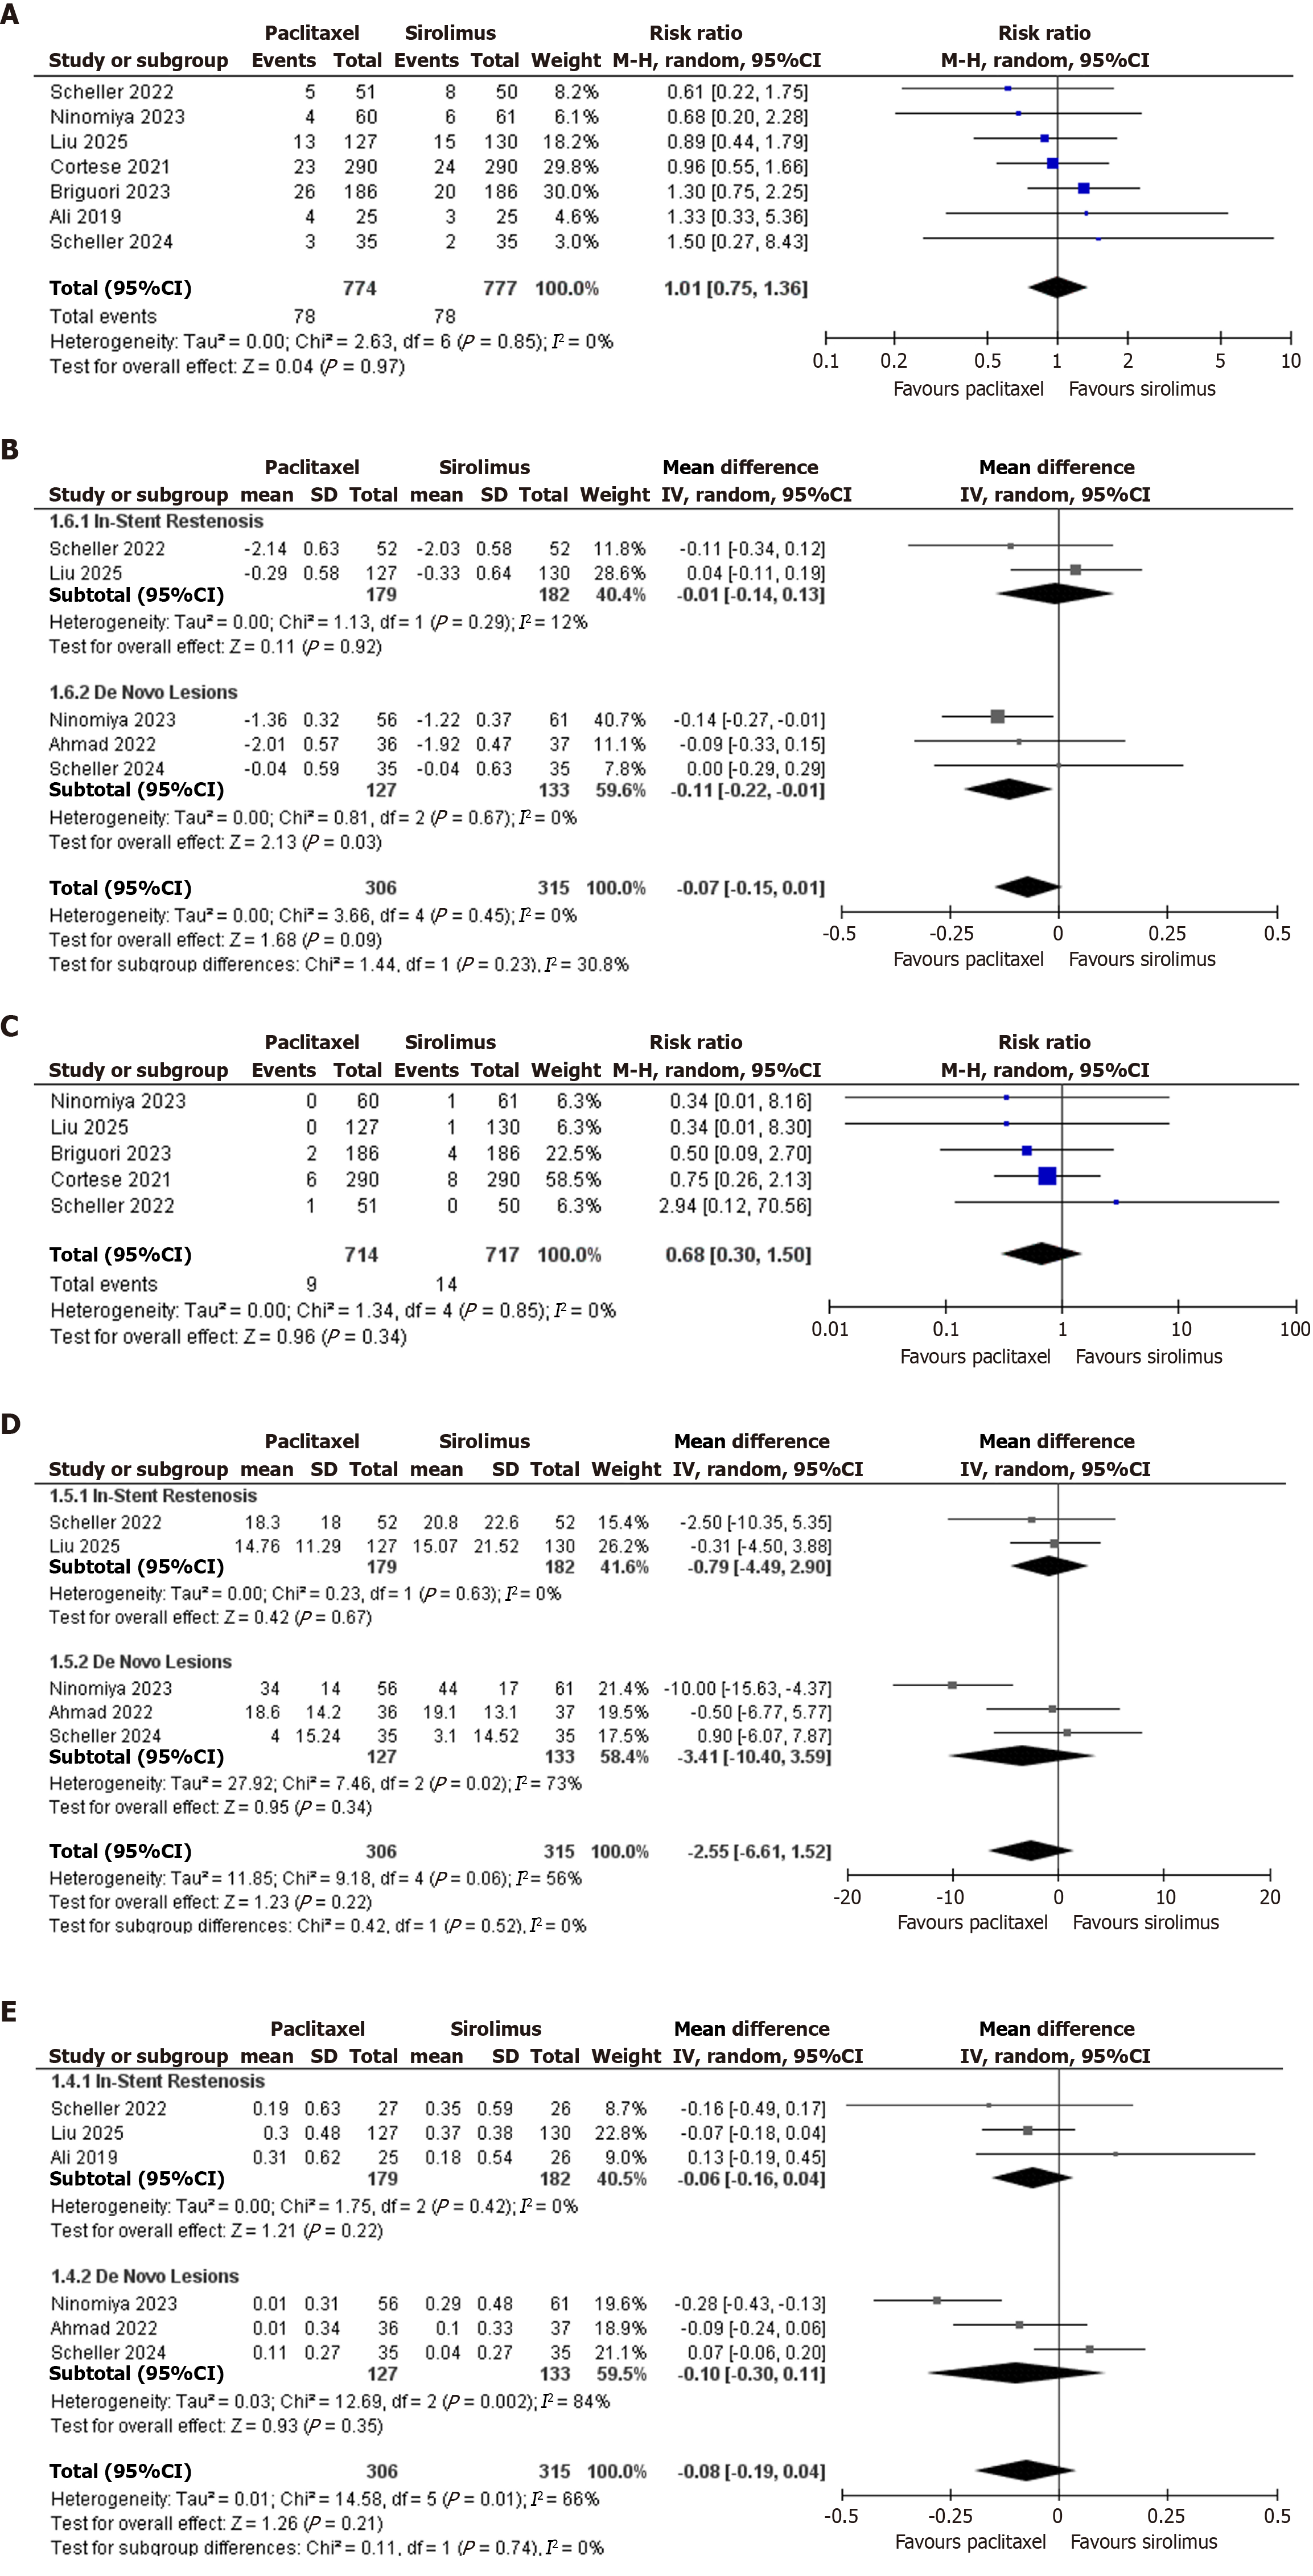
Figure 2 Synthesizing the insights from multiple forest plots.
A: Forest plot of target vessel revascularization; B: Forest plot of minimal lesion diameter; C: Forest plot of myocardial infarction; D: Forest plot of diameter stenosis on follow-up angiography; E: Forest plot of in-segment late lumen loss on follow-up angiography. CI: Confidence interval.
- Citation: Rath S, Khan A, Khan H, Cheema AAA, Ud Din Z, Ullah W, Ahmed R. Assessing paclitaxel-coated vs sirolimus-coated balloon angioplasty for coronary artery diseases: A systematic review and meta-analysis. World J Cardiol 2025; 17(11): 112018
- URL: https://www.wjgnet.com/1949-8462/full/v17/i11/112018.htm
- DOI: https://dx.doi.org/10.4330/wjc.v17.i11.112018


