Copyright
©The Author(s) 2025.
World J Cardiol. Nov 26, 2025; 17(11): 110537
Published online Nov 26, 2025. doi: 10.4330/wjc.v17.i11.110537
Published online Nov 26, 2025. doi: 10.4330/wjc.v17.i11.110537
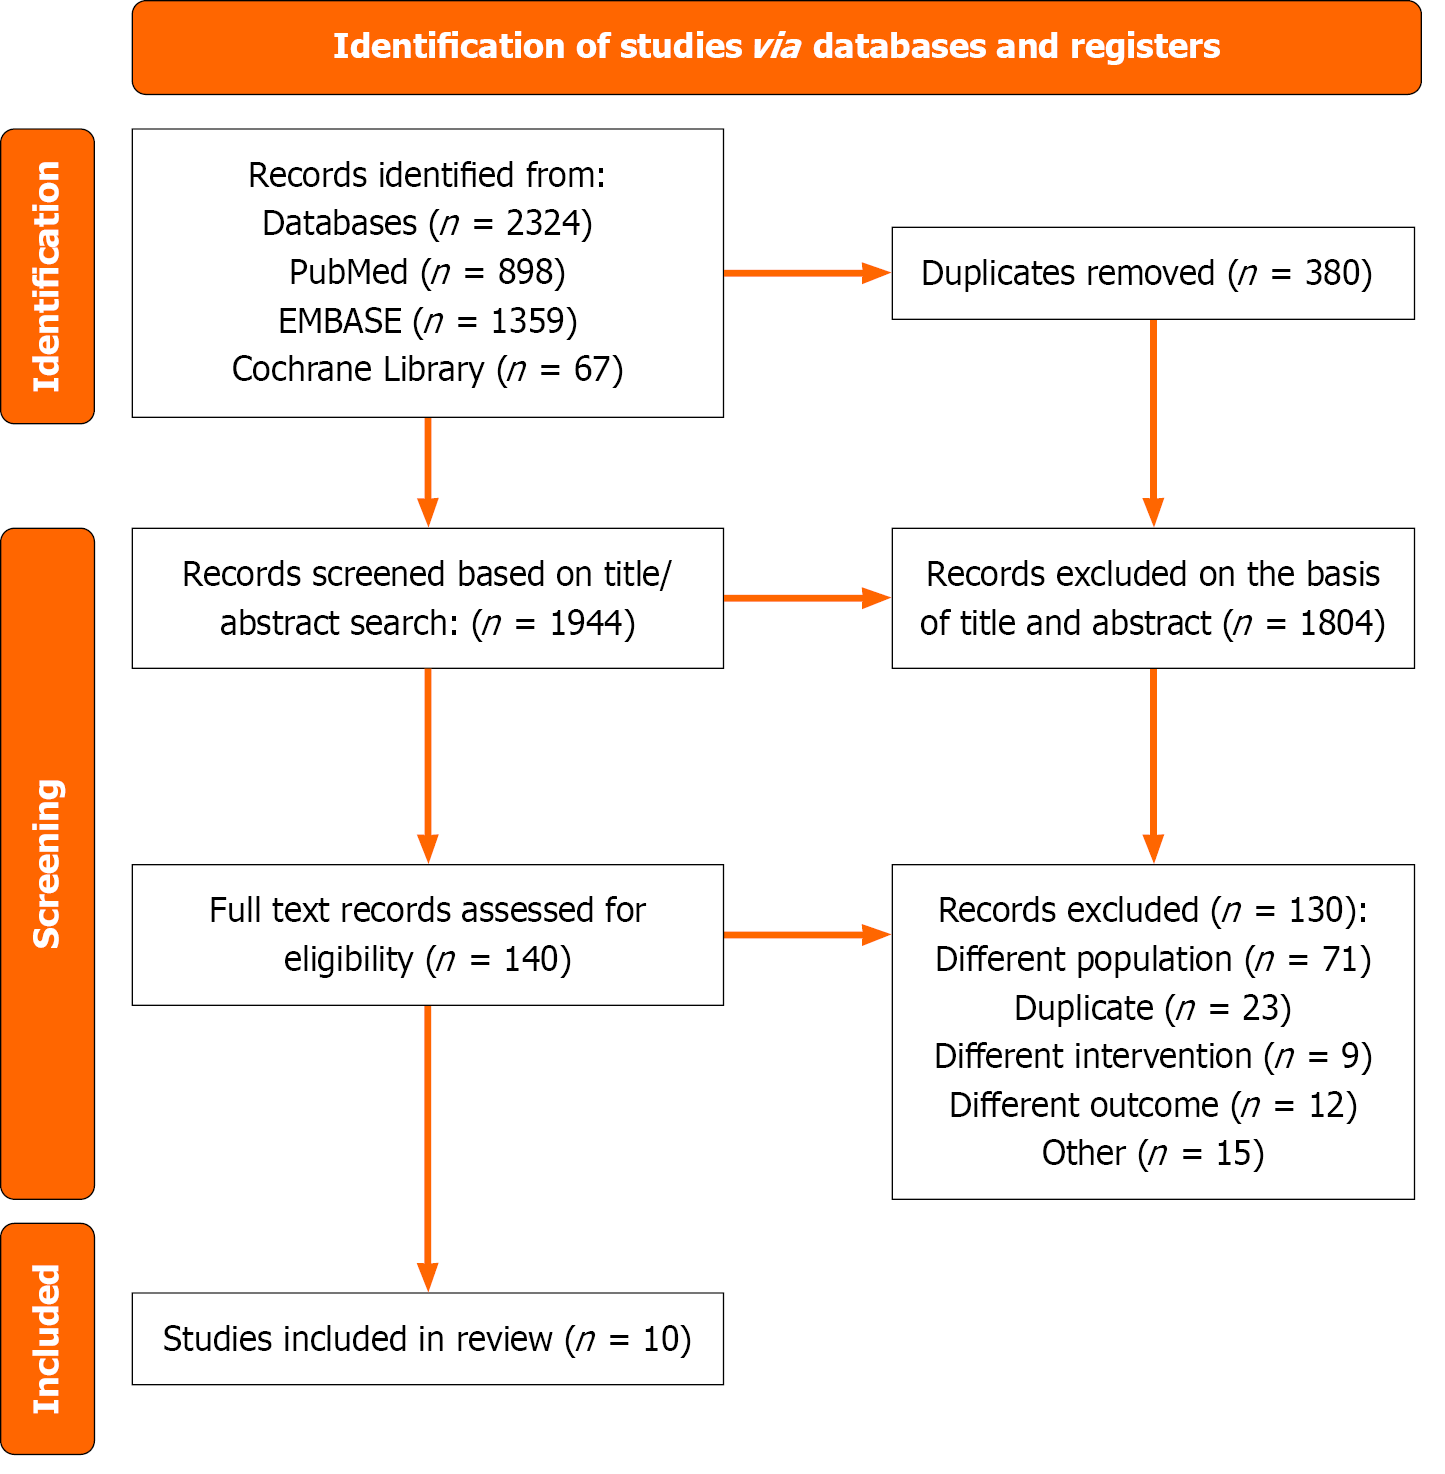
Figure 1 PRISMA flow chart of the screening process.
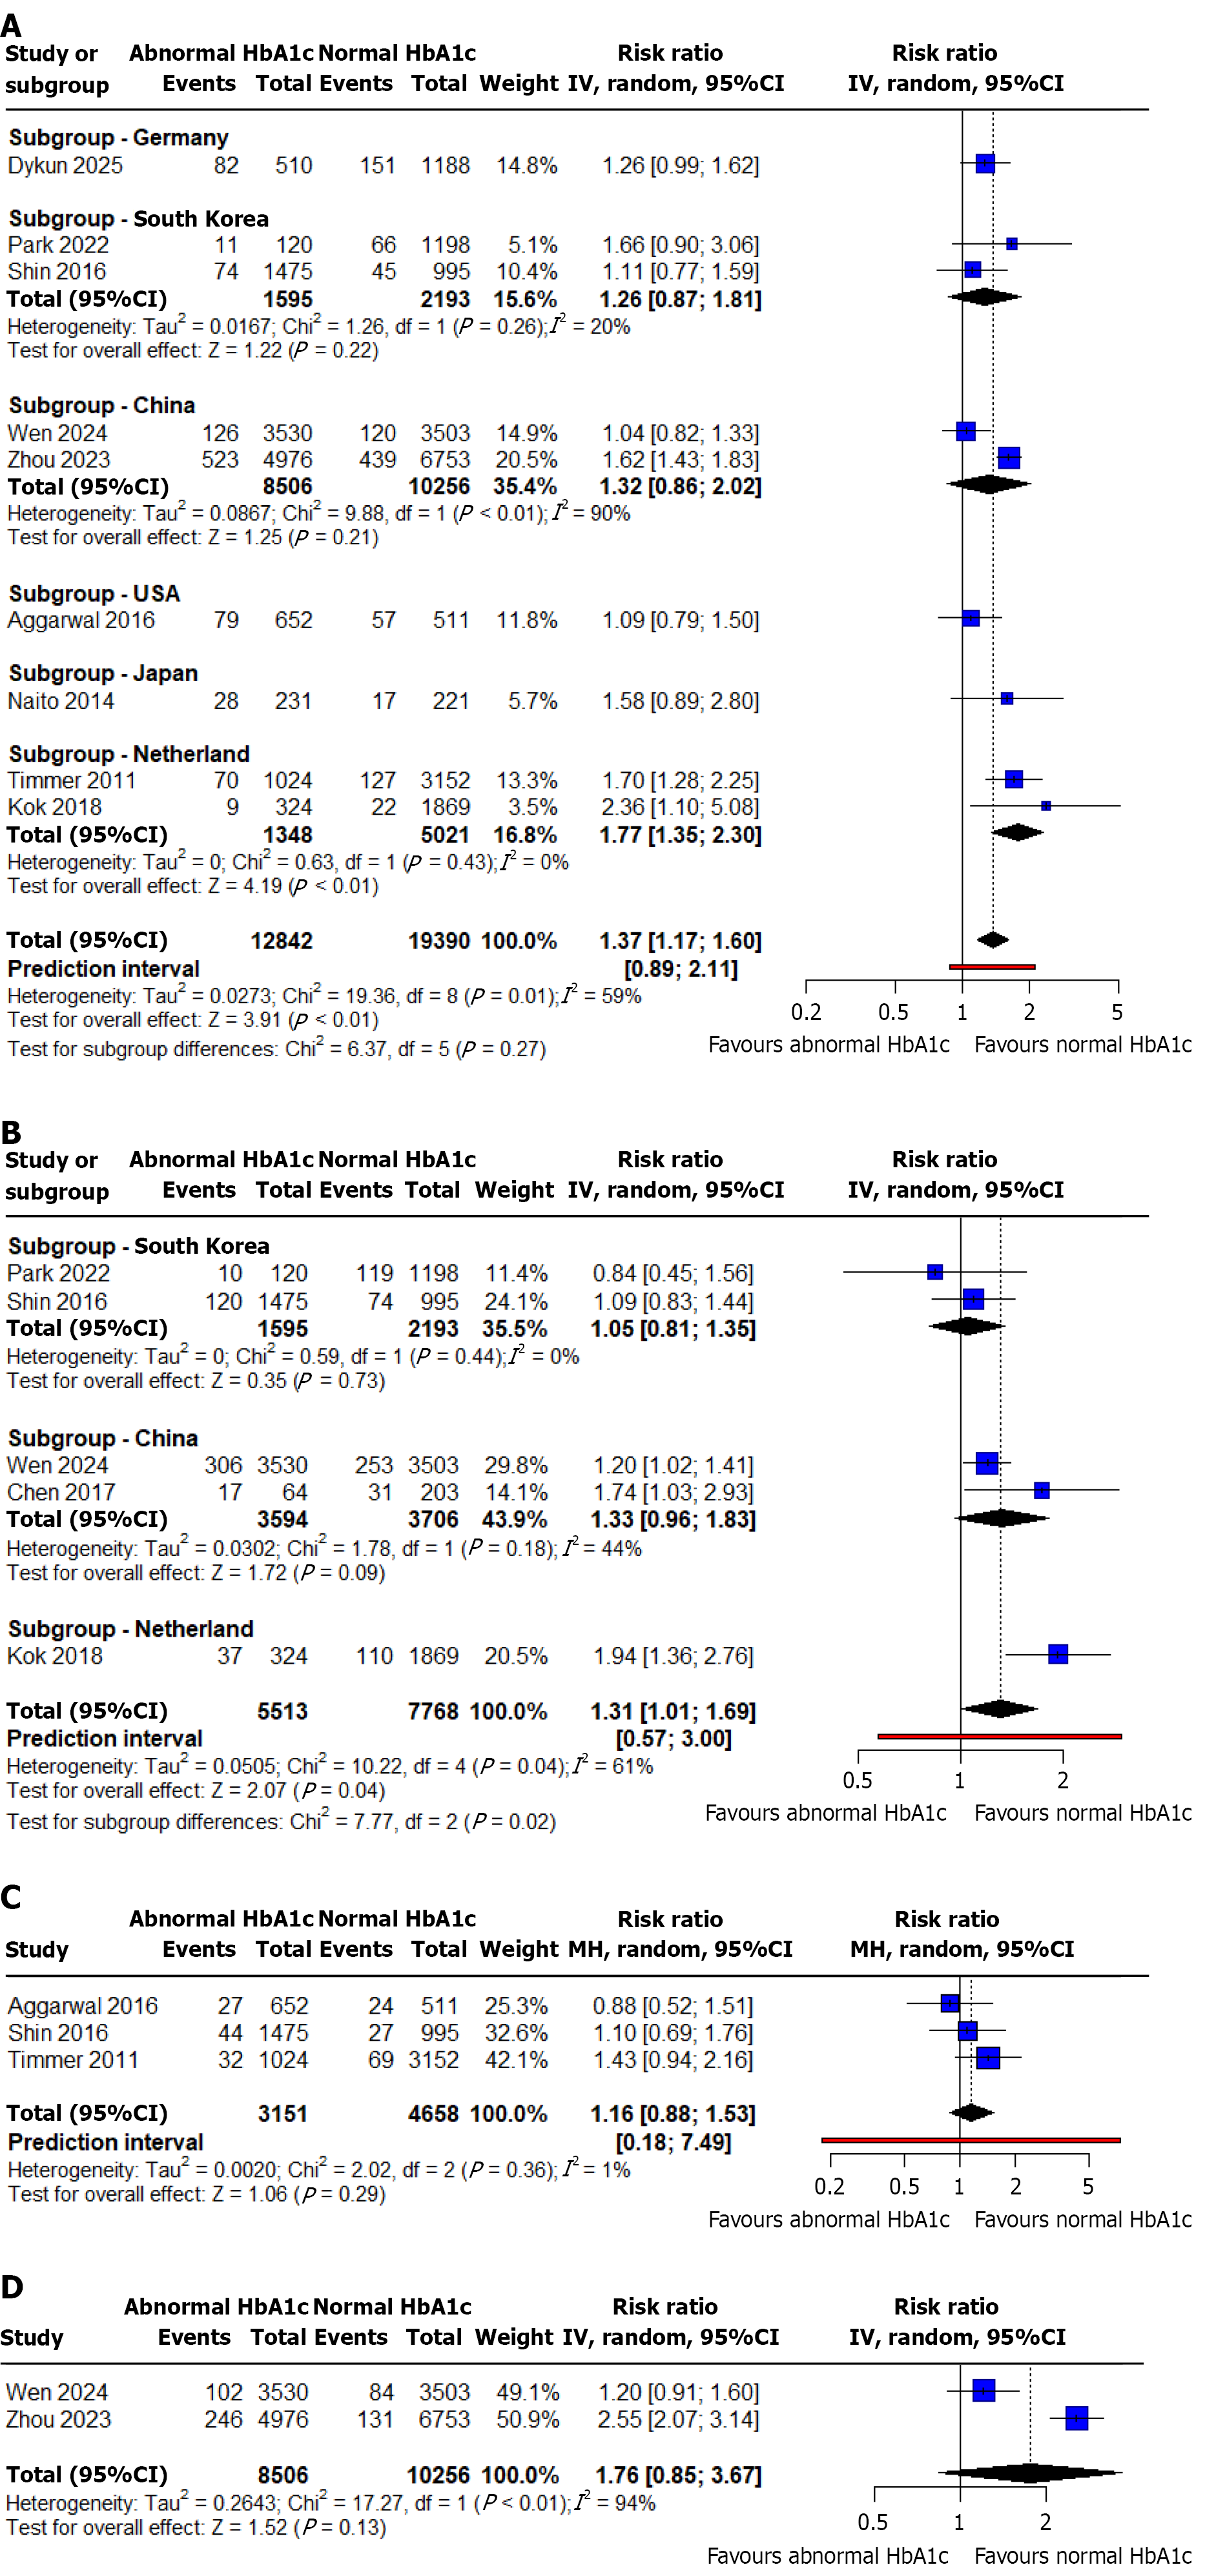
Figure 2 Forest plots comparing clinical outcomes between patients with abnormal and normal glycated hemoglobin levels.
A: Long-term all-cause mortality with subgroup analysis; B: Major adverse cardiovascular events with subgroup analysis; C: Short-term all-cause mortality; D: Cardiac mortality.
- Citation: Shahid S, Sethi FA, Ahmed S, Kumar A, Shahid MH, Raja HAA, Usama M, Mughal HMF. Prognostic impact of prediabetic glycated hemoglobin levels in nondiabetic patients undergoing percutaneous coronary intervention: A systematic review and meta-analysis. World J Cardiol 2025; 17(11): 110537
- URL: https://www.wjgnet.com/1949-8462/full/v17/i11/110537.htm
- DOI: https://dx.doi.org/10.4330/wjc.v17.i11.110537


