Copyright
©The Author(s) 2025.
World J Cardiol. Oct 26, 2025; 17(10): 110962
Published online Oct 26, 2025. doi: 10.4330/wjc.v17.i10.110962
Published online Oct 26, 2025. doi: 10.4330/wjc.v17.i10.110962
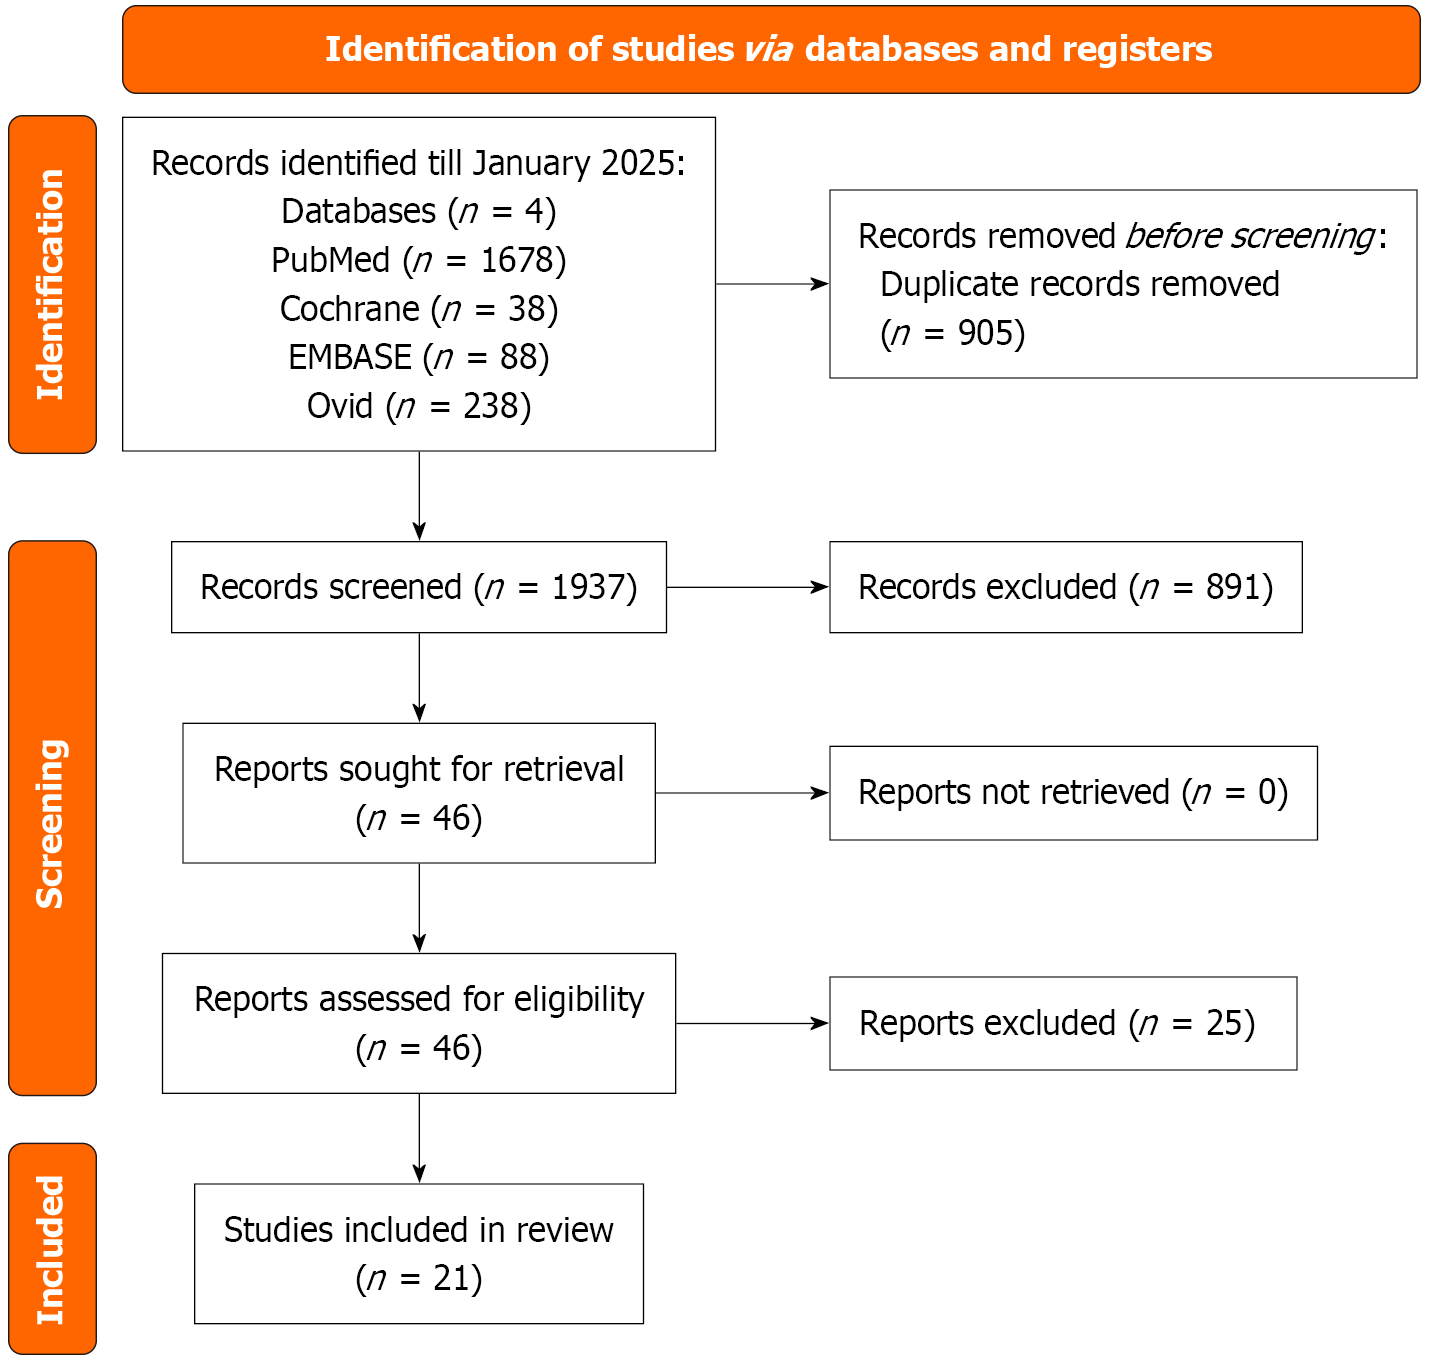
Figure 1
PRISMA flowchart outlining the literature screening process, study selection, and exclusion criteria.
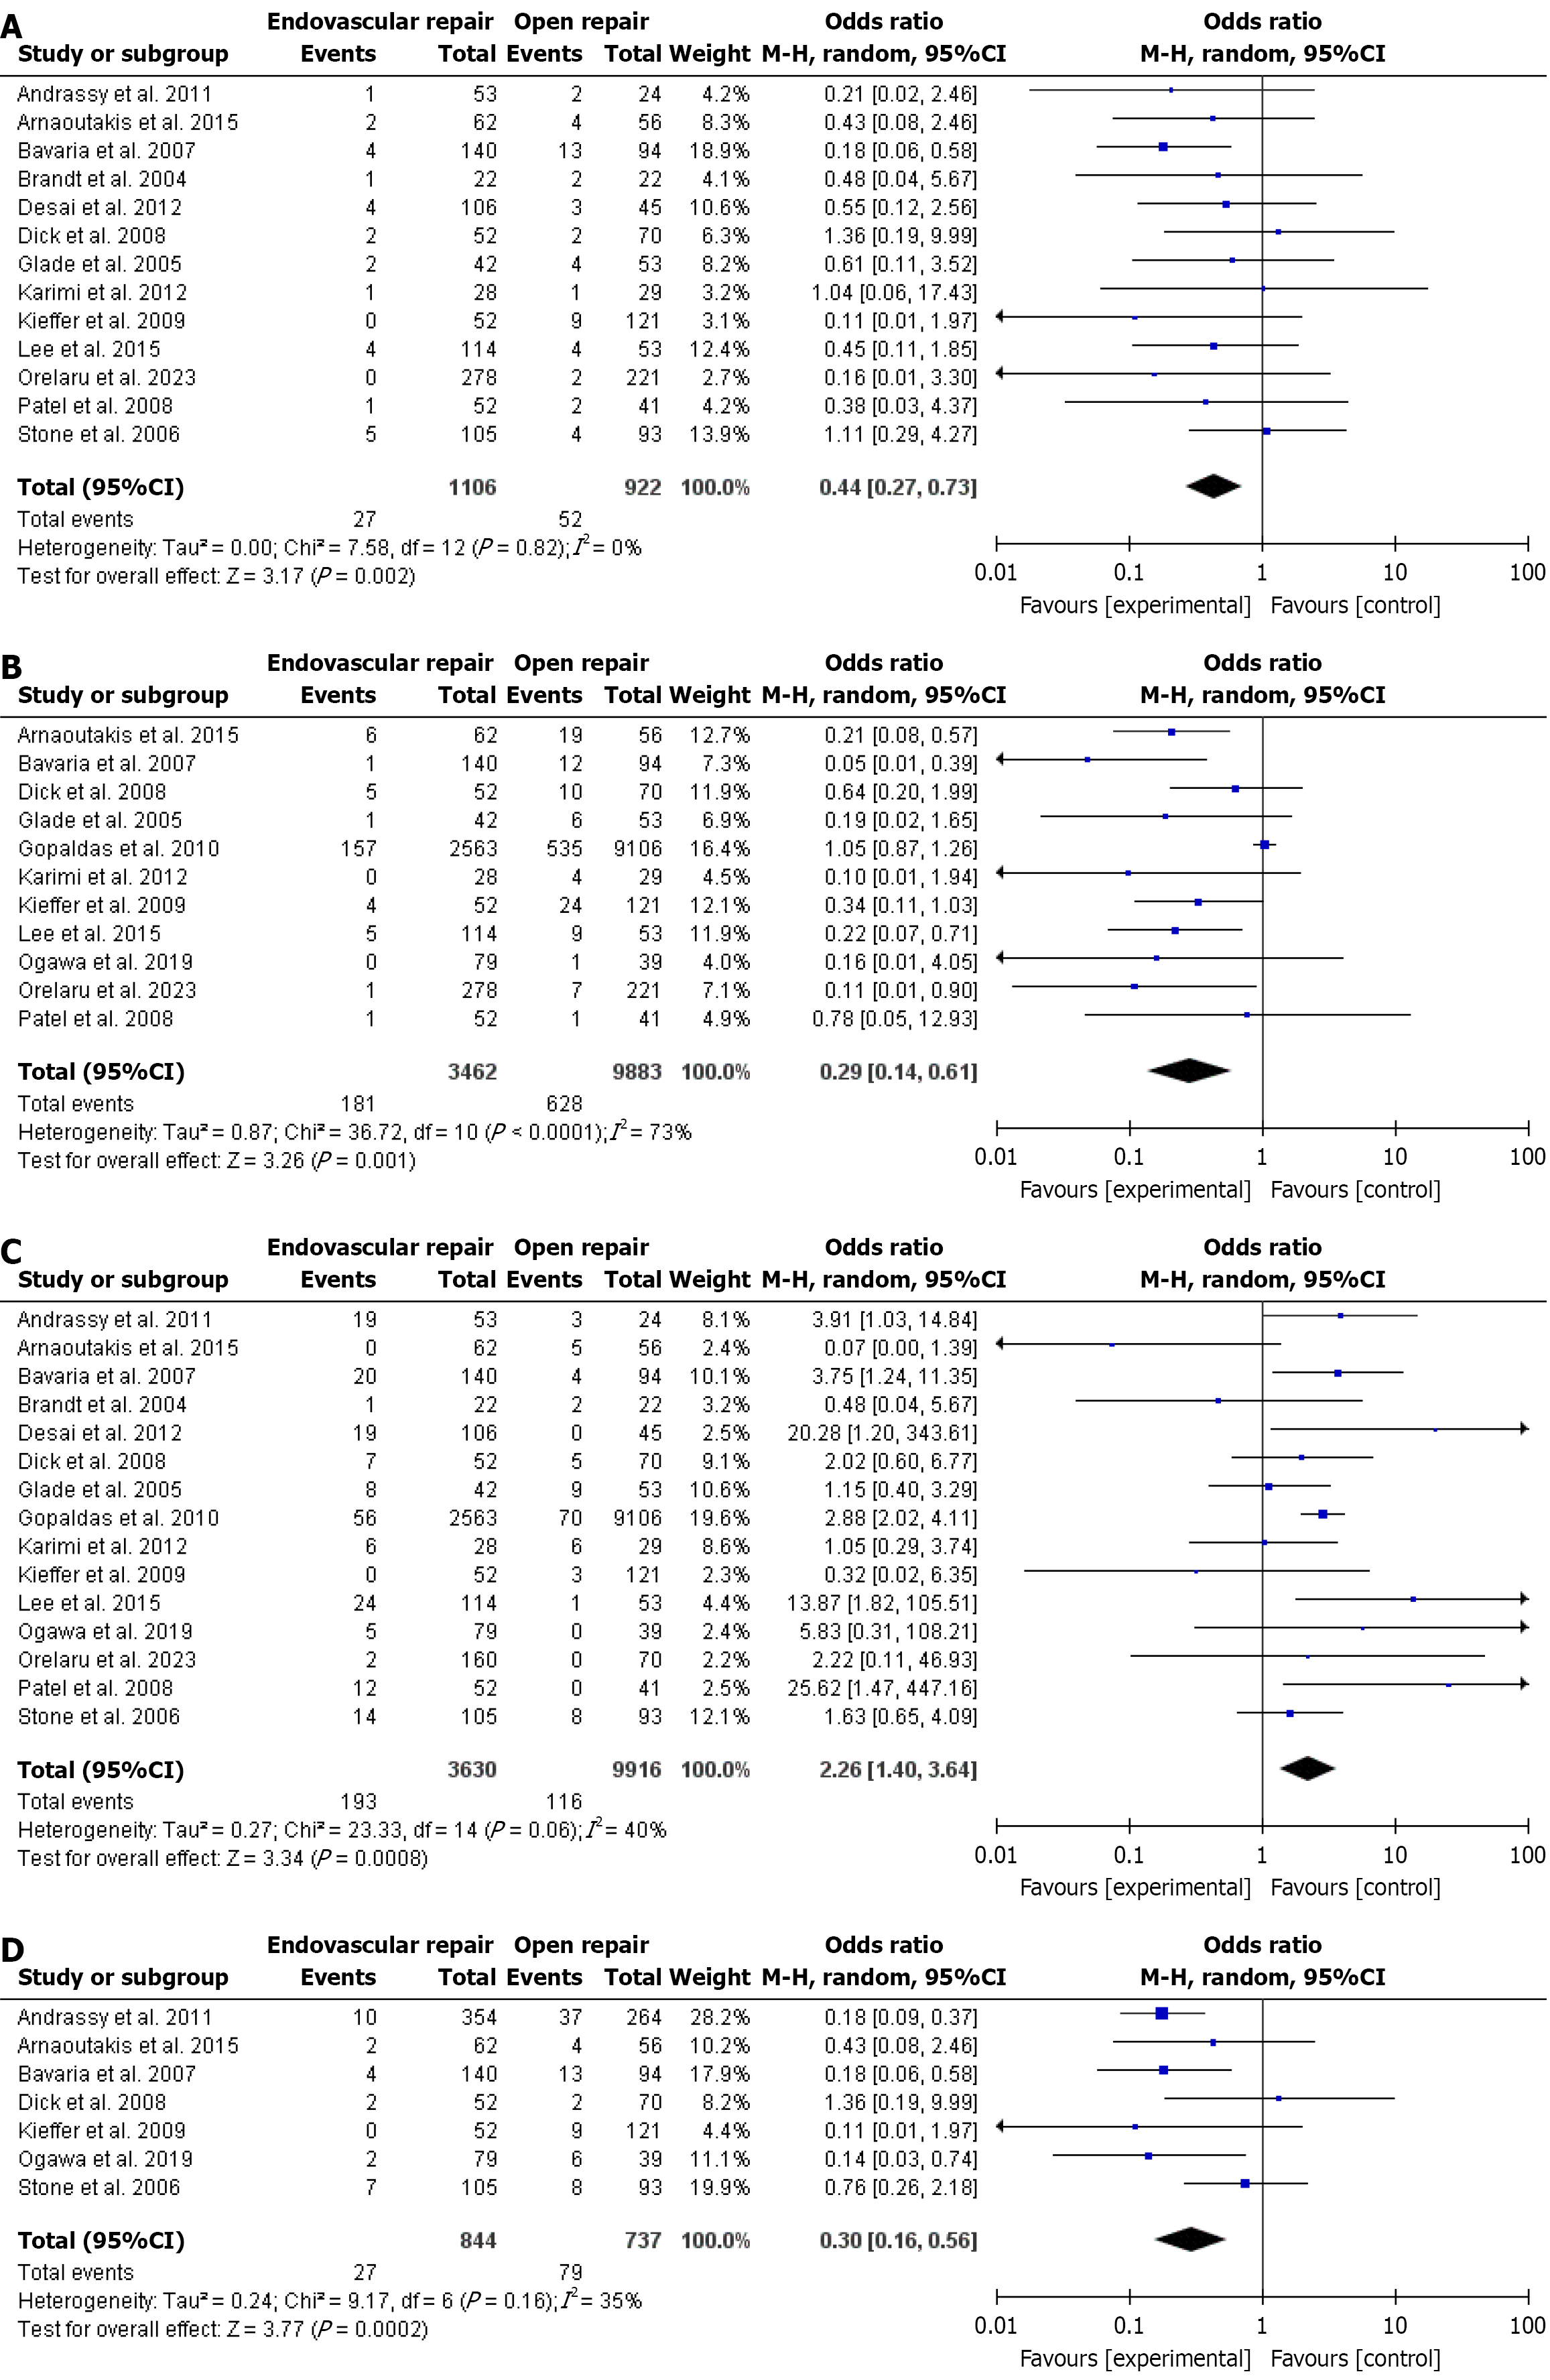
Figure 2 Forest plot.
A: Forest plot comparing the rate of paraplegia between thoracic endovascular aortic repair (TEVAR) and open surgical repair (OSR) groups; B: Forest plot comparing the rate of renal failure between TEVAR and OSR groups; C: Forest plot comparing the rate of vascular complications between TEVAR and OSR groups; D: Forest plot comparing the incidence of spinal ischemia between TEVAR and OSR groups. CI: Confidence interval.
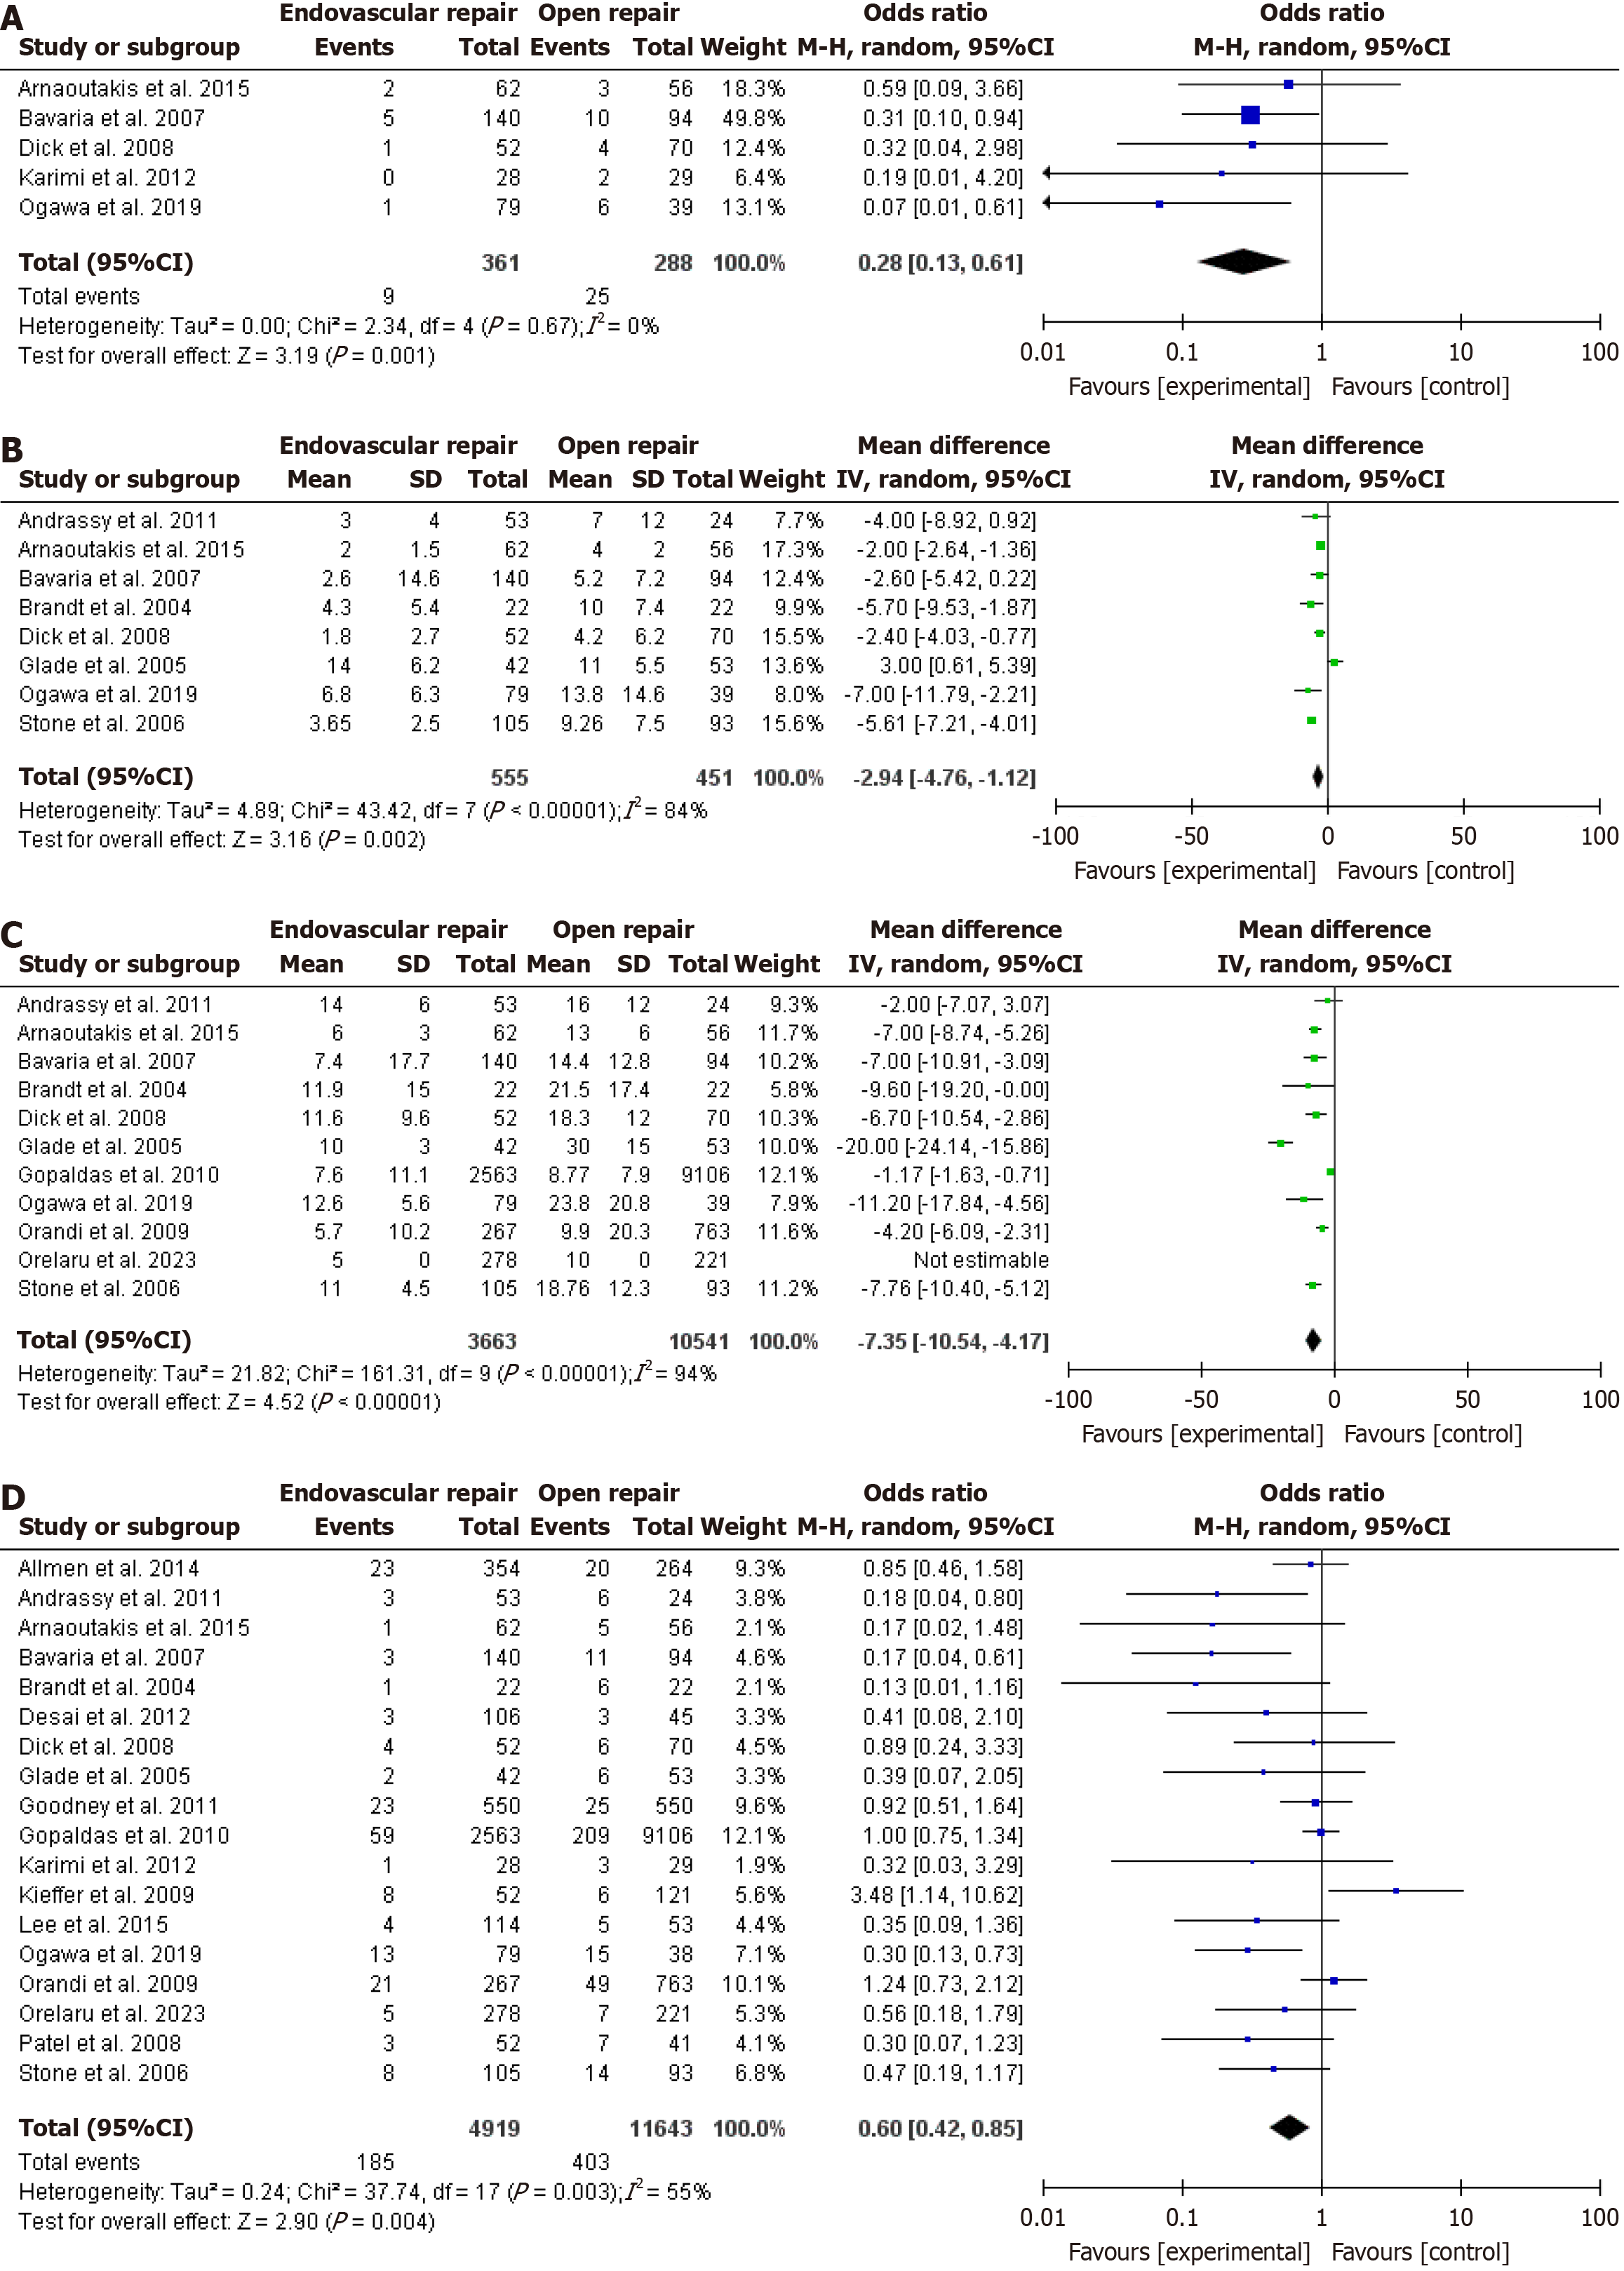
Figure 3 Forest plot.
A: Forest plot comparing wound infection between thoracic endovascular aortic repair (TEVAR) and open surgical repair (OSR) groups; B: Forest plot comparing the length of intensive care unit between TEVAR and OSR groups; C: Forest plot comparing the length of hospital stay between TEVAR and OSR groups; D: Forest plot comparing operative mortality between TEVAR and OSR groups. CI: Confidence interval.
- Citation: Khawar M, Ali U, Rasheed MA, Rasheed AB, Shah SA, Zain S, Saifullah M, Mubarika M, Hadeed Khawar MM, Iqbal T, Ghuman SI, Rana I, Pathak P. Thoracic endovascular vs open surgical repair in descending thoracic aortic aneurysms: A systematic review and meta-analysis. World J Cardiol 2025; 17(10): 110962
- URL: https://www.wjgnet.com/1949-8462/full/v17/i10/110962.htm
- DOI: https://dx.doi.org/10.4330/wjc.v17.i10.110962


