Copyright
©The Author(s) 2025.
World J Gastrointest Surg. Sep 27, 2025; 17(9): 109980
Published online Sep 27, 2025. doi: 10.4240/wjgs.v17.i9.109980
Published online Sep 27, 2025. doi: 10.4240/wjgs.v17.i9.109980
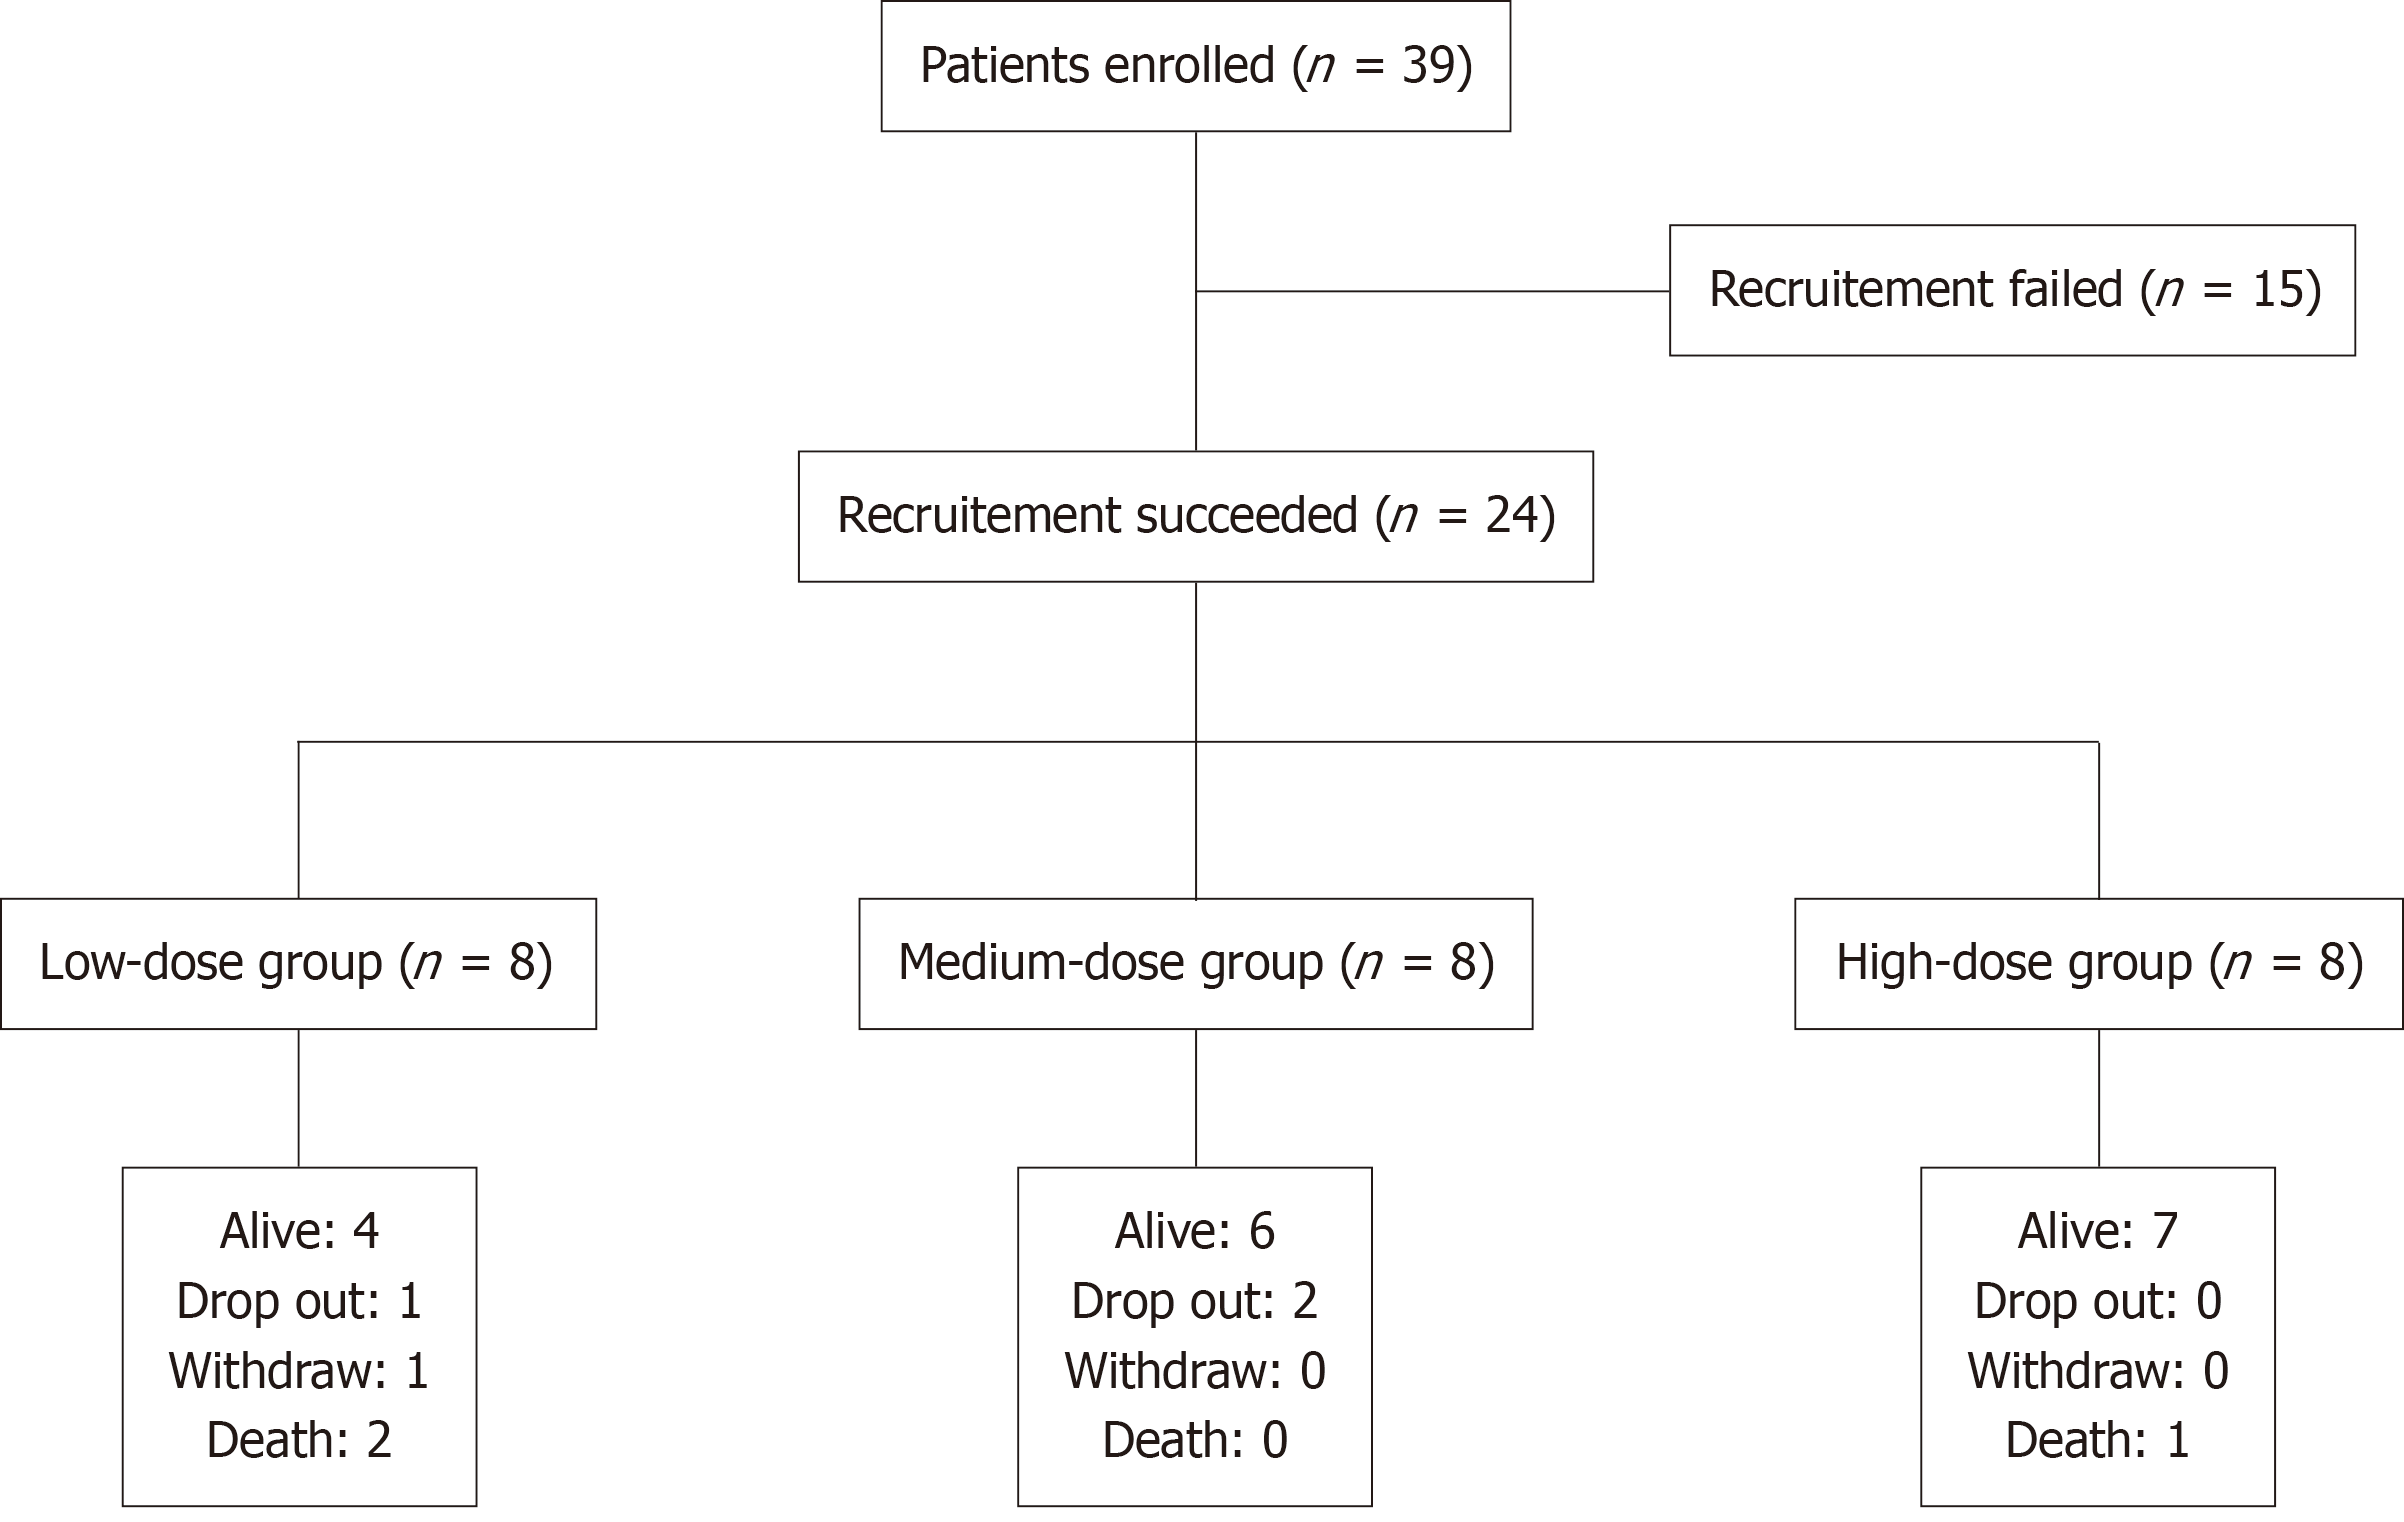
Figure 1 Study flow chart: 39 participants were enrolled and 24 were recruited.
Each group includes 8 participants.
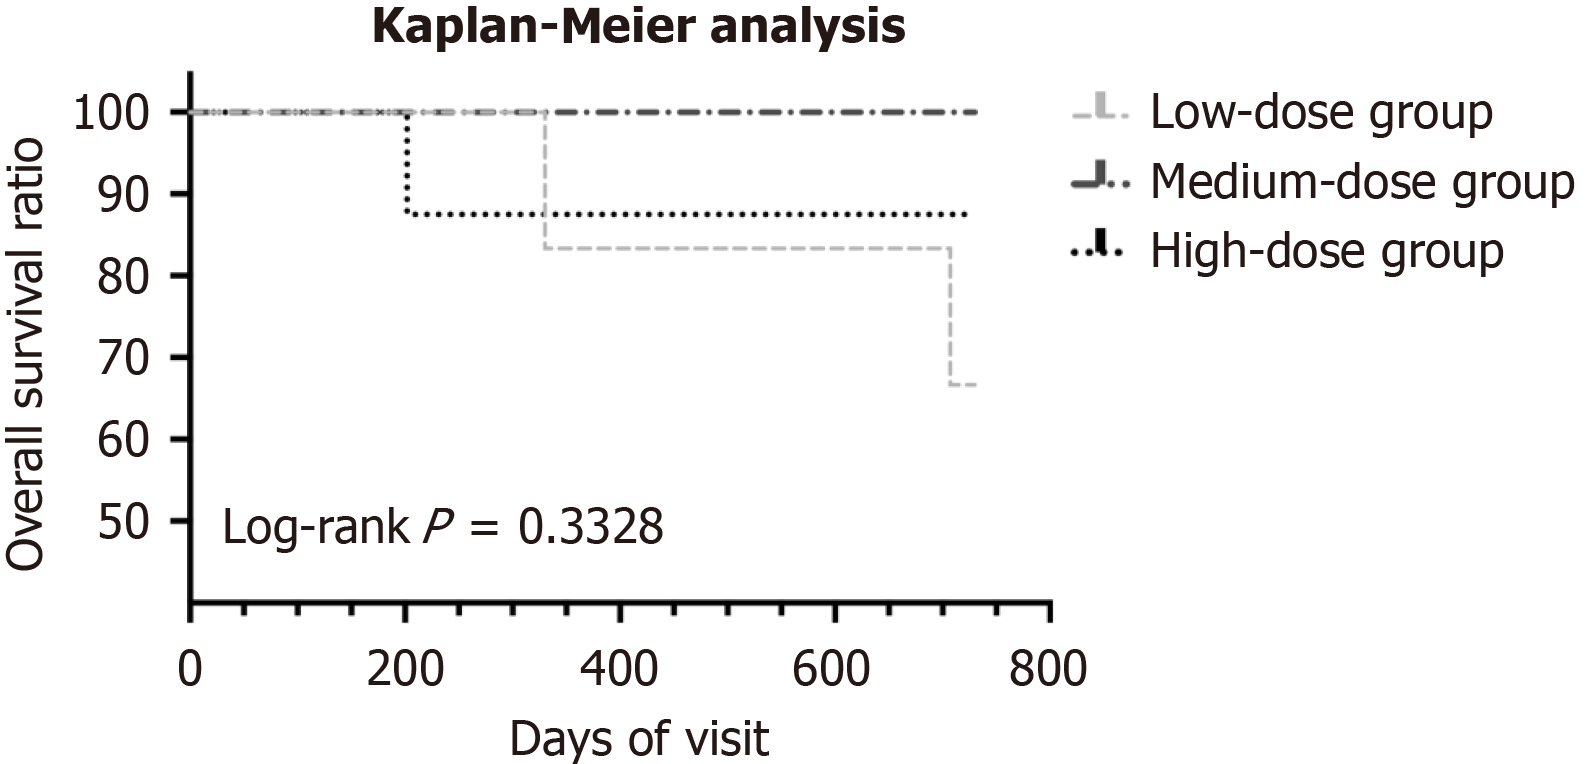
Figure 2 Kaplan-Meier analysis of 3 groups.
There is no statistical difference among 3 groups (log-rank P = 0.3328).
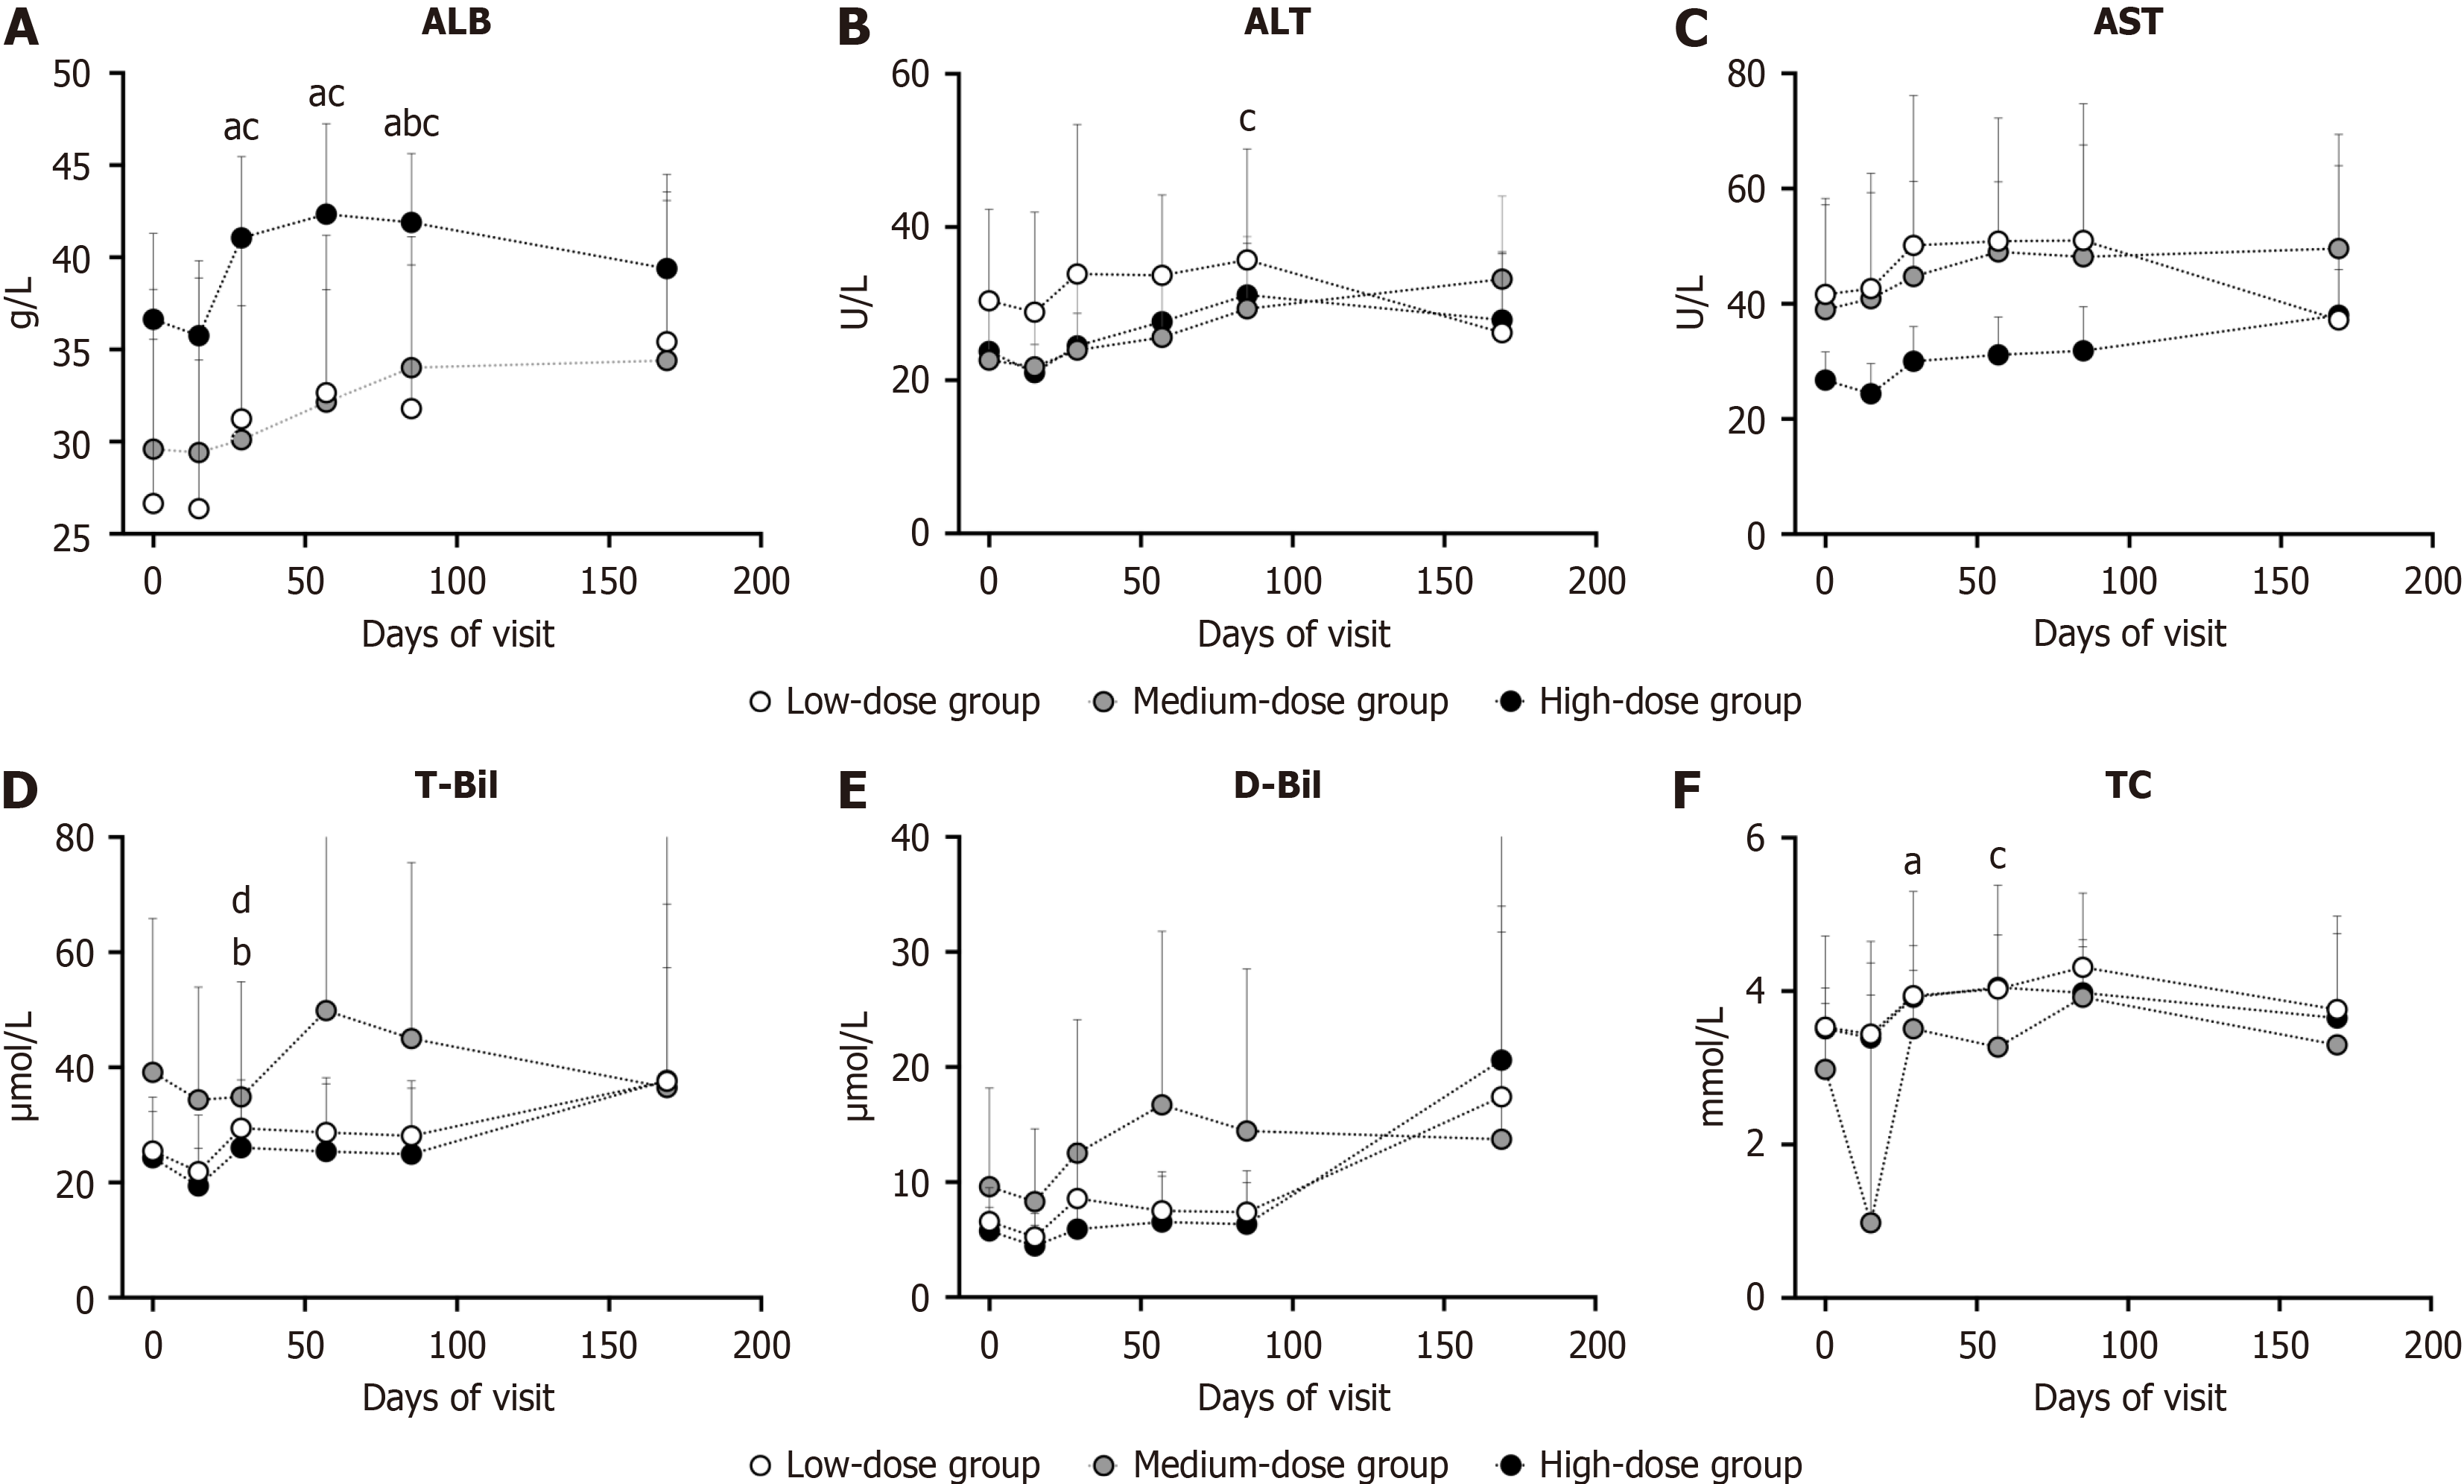
Figure 3 Variation of liver function.
aP < 0.05 compared with baseline values in low-dose group; bP < 0.05 compared with baseline values in medium-dose group; cP < 0.05 compared with baseline values in high-dose group; dP < 0.05 compared among three group in the same visit. A: Serum albumin; B: Alanine aminotransferase; C: Aspartate aminotransferase; D: Serum total bilirubin; E: Serum direct bilirubin; F: Total cholesterol. ALB: Albumin; ALT: Alanine aminotransferase; AST: Aspartate aminotransferase; T-Bil: Total bilirubin; D-Bil: Direct bilirubin; TC: Total cholesterol.
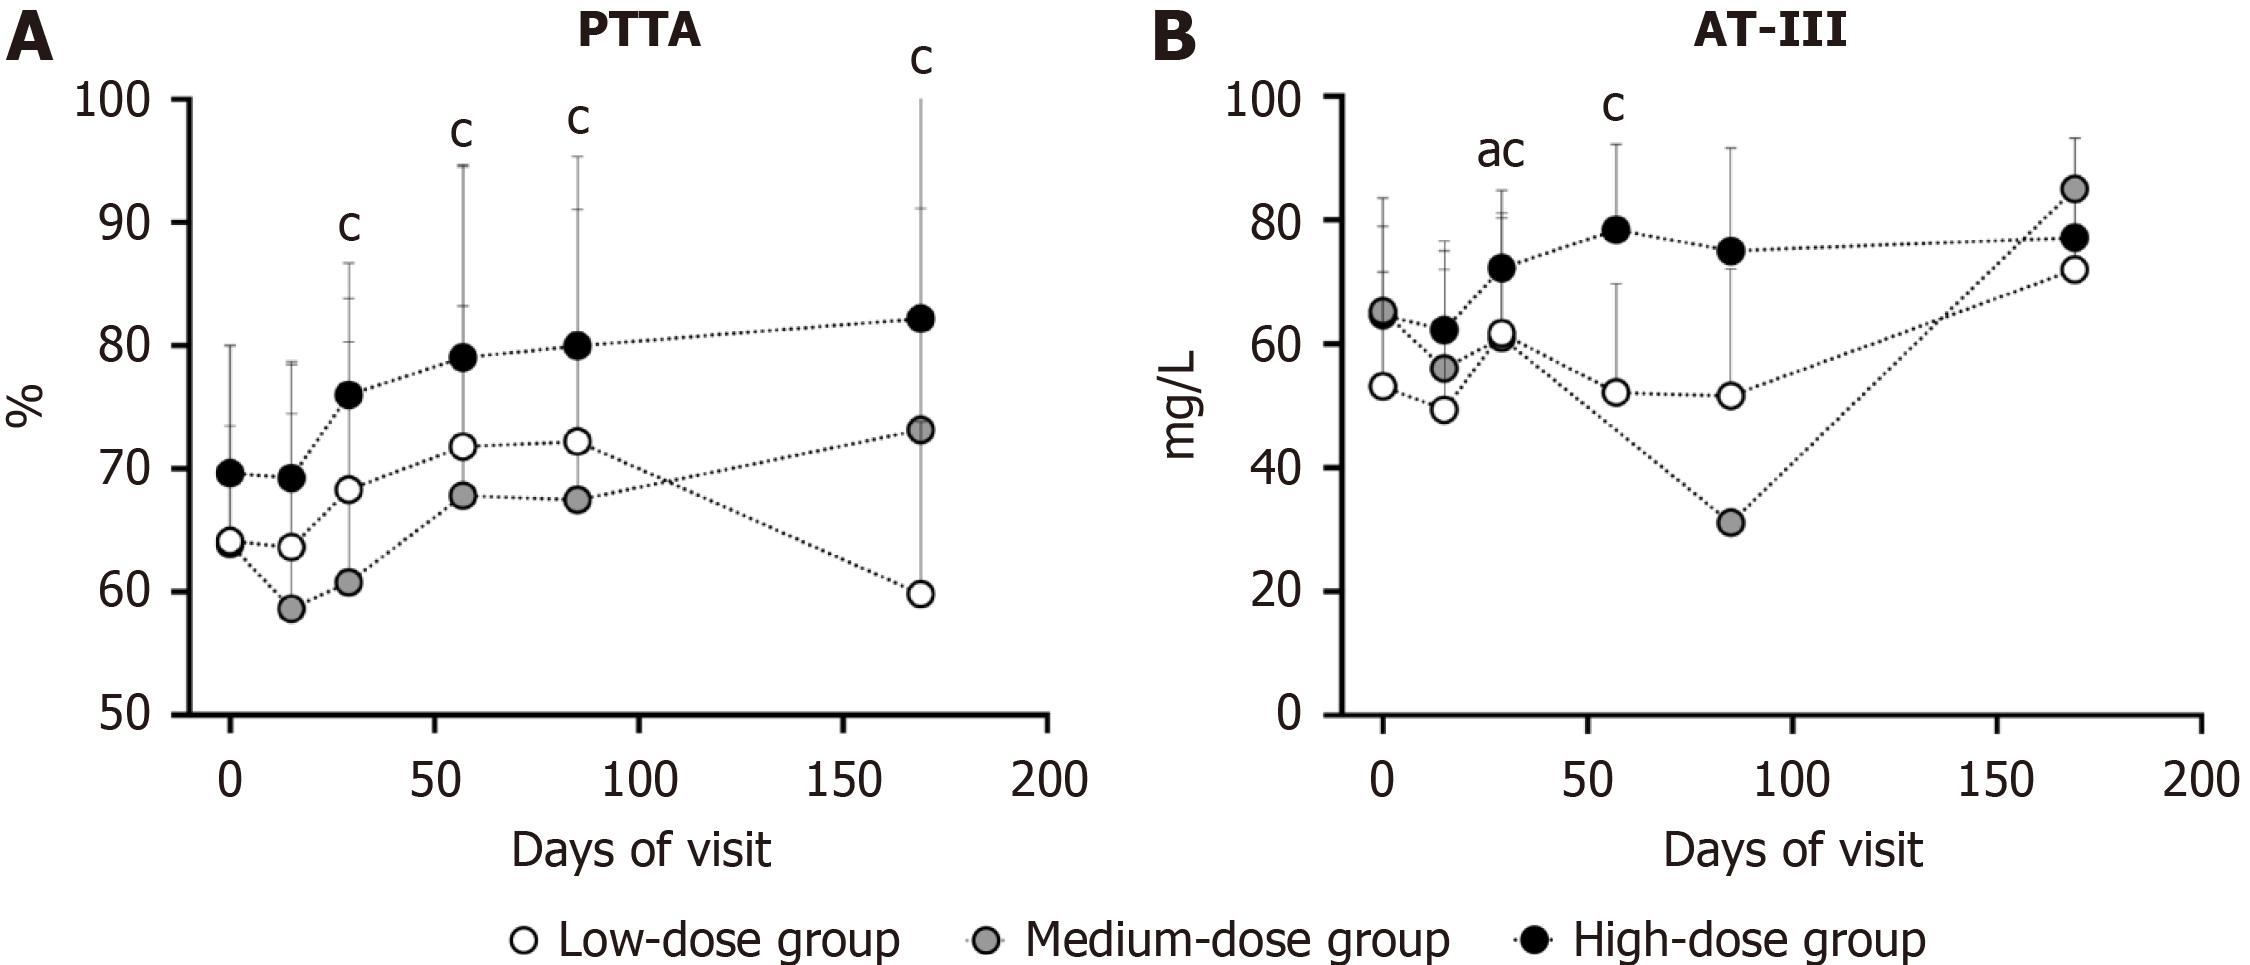
Figure 4 Variation of coagulation function.
aP < 0.05 compared with baseline values in low-dose group; cP < 0.05 compared with baseline values in high-dose group. A: Prothrombin time activity; B: Antithrombin-III. PTTA: Prothrombin time activity; AT-III: Antithrombin-III.
Figure 5 Variation of general condition.
aP < 0.05 compared with baseline values, representing low-dose group. A: Weight of participant; B: Child-Pugh score; C: Model for End-Stage Liver Disease score. MELD: Model for End-Stage Liver Disease.
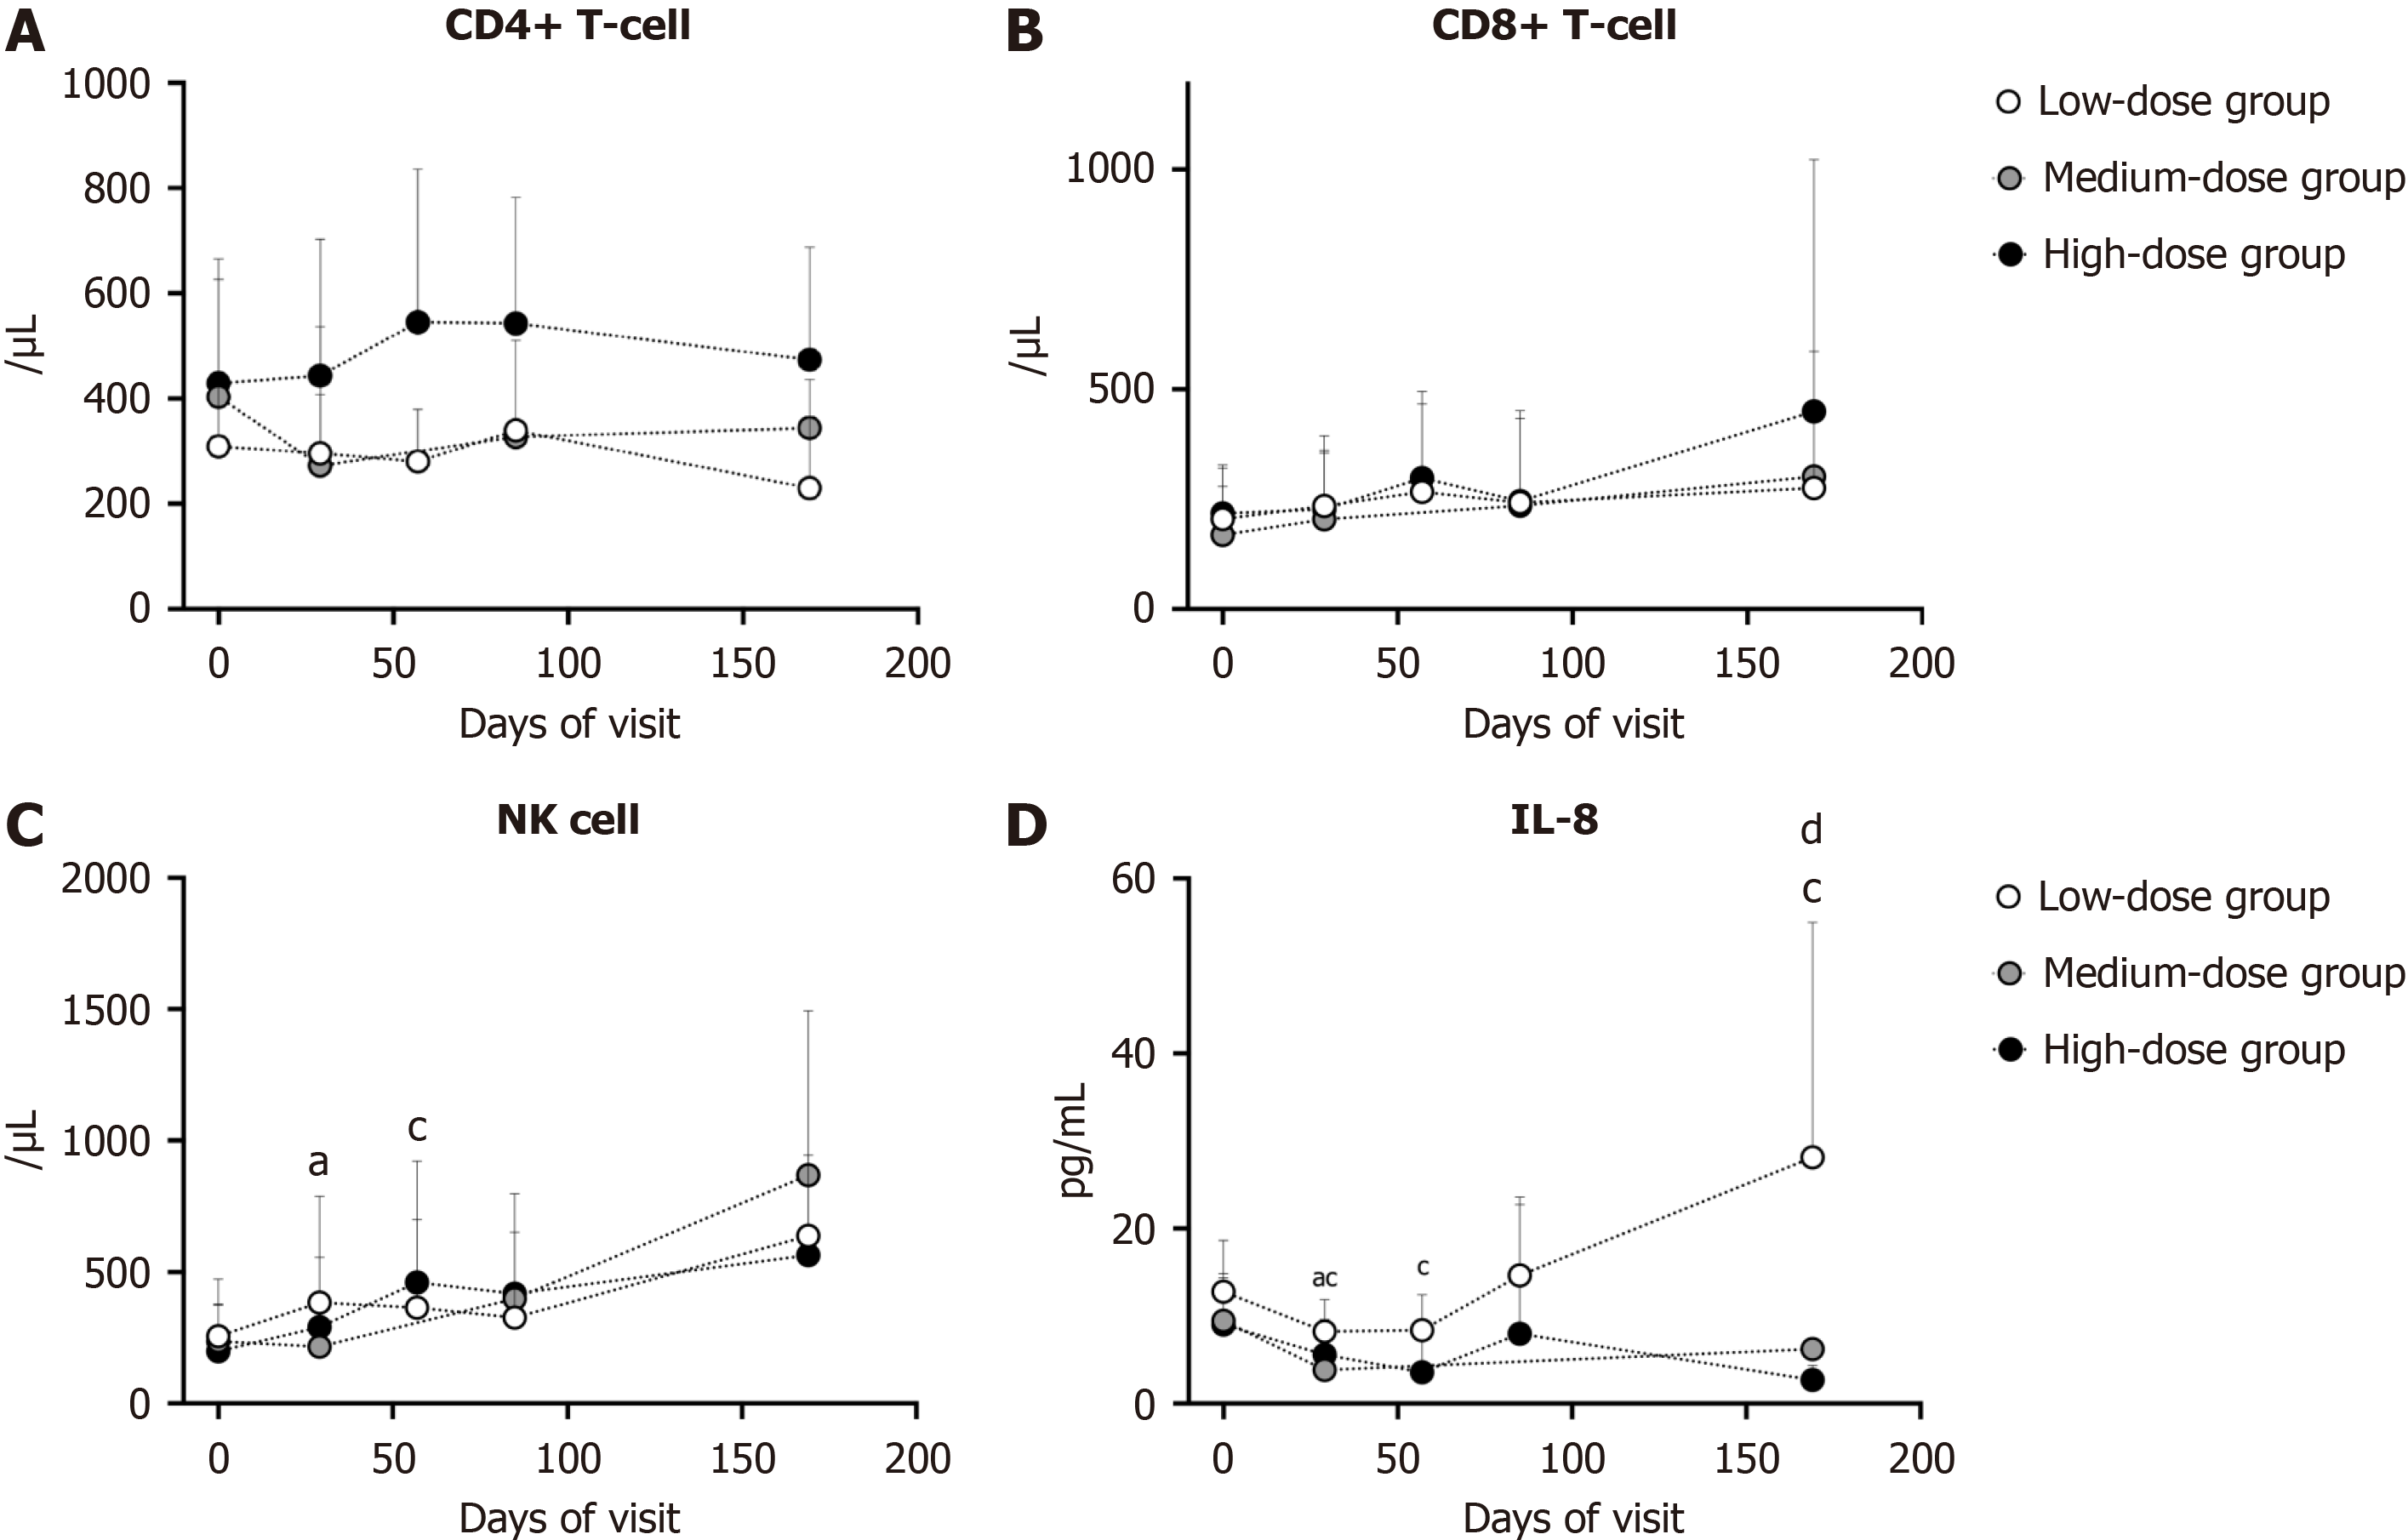
Figure 6 Variation of immune system.
aP < 0.05 compared with baseline values in low-dose group; cP < 0.05 compared with baseline values in high-dose group; dP < 0.05 compared among three group in the same visit. A: CD4+ T cell; B: CD8+ cell; C: Natural killer cell; D: Interleukin-8. NK cell: Natural killer cell; IL-8: Interleukin-8.
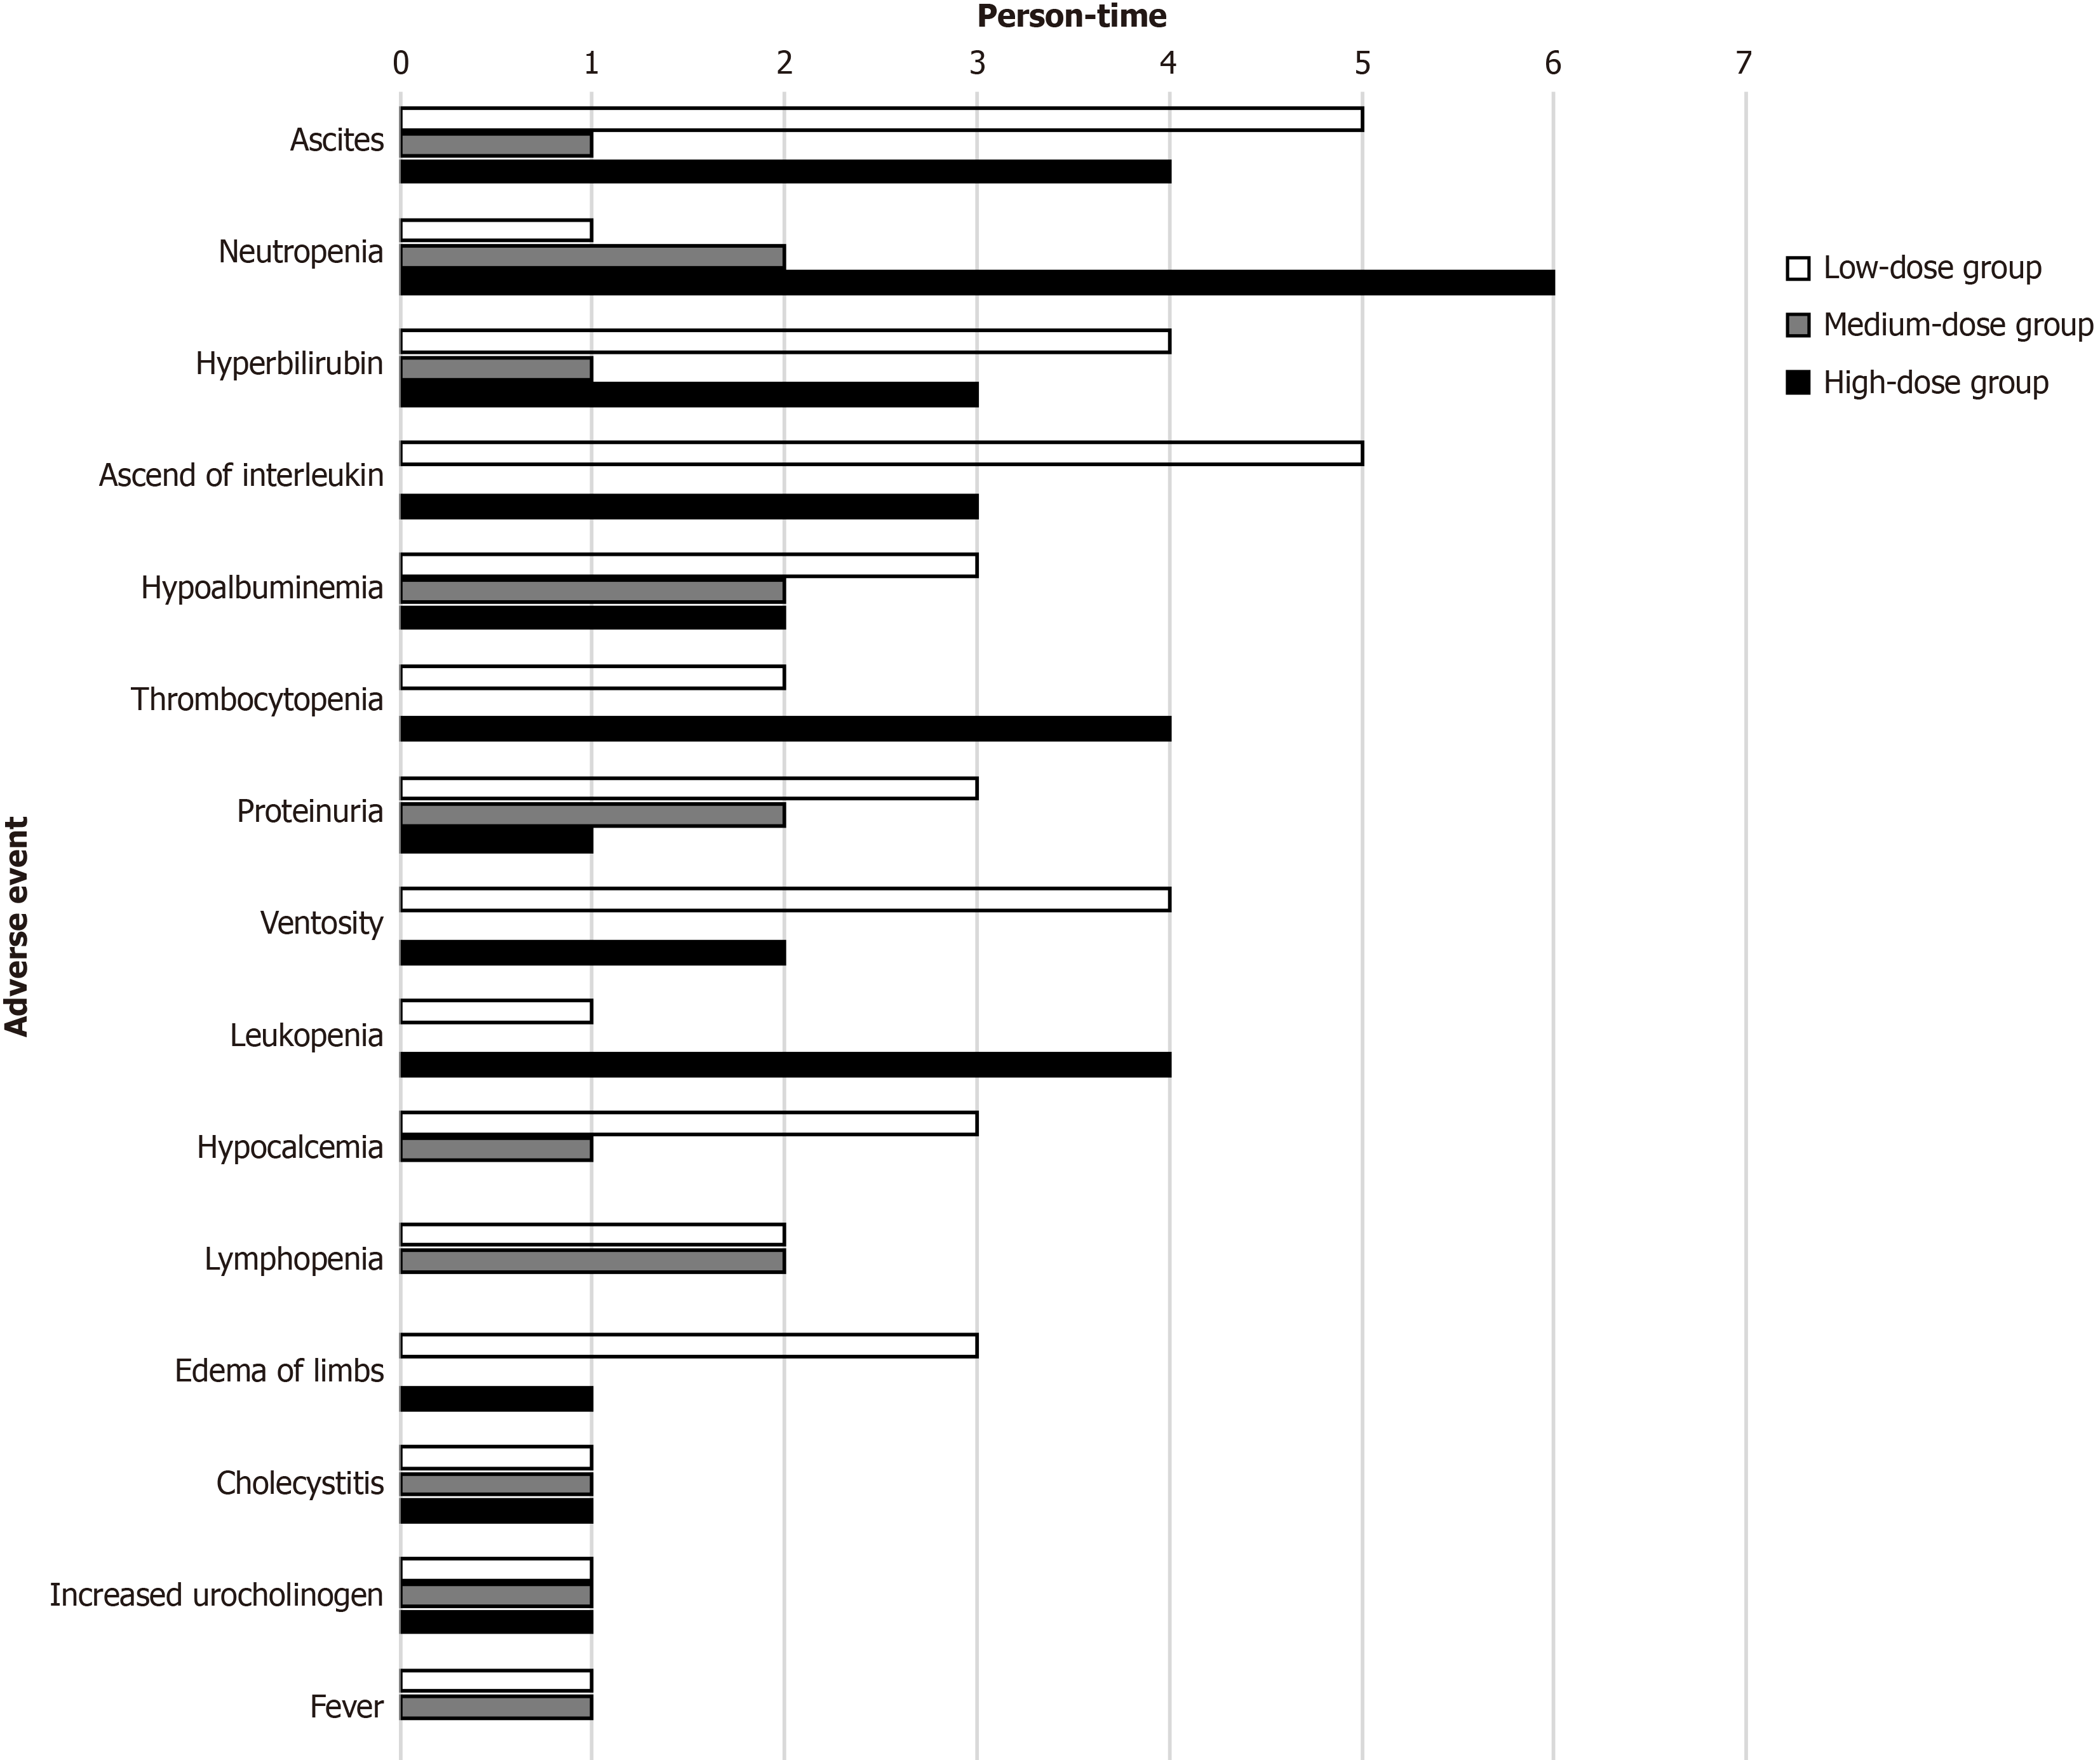
Figure 7 Most common adverse event.
The most common 15 adverse event were displayed and the horizontal axis represents person-time, which display the frequency in each group.
- Citation: Qin X, Chen J, Zhang HN, Du L, Ma Y, Li Y, Lu Y, Wang YT, Wu LF, Yu ZH, Hu MJ, Li LJ, Liao B, Li Z, Yang ZY, Li K, Yuan YF. Treatment of human umbilical cord-derived mesenchymal stem cells for hepatitis B virus-associated decompensated liver cirrhosis: A clinical trial. World J Gastrointest Surg 2025; 17(9): 109980
- URL: https://www.wjgnet.com/1948-9366/full/v17/i9/109980.htm
- DOI: https://dx.doi.org/10.4240/wjgs.v17.i9.109980


