Copyright
©The Author(s) 2025.
World J Gastrointest Surg. Apr 27, 2025; 17(4): 102862
Published online Apr 27, 2025. doi: 10.4240/wjgs.v17.i4.102862
Published online Apr 27, 2025. doi: 10.4240/wjgs.v17.i4.102862
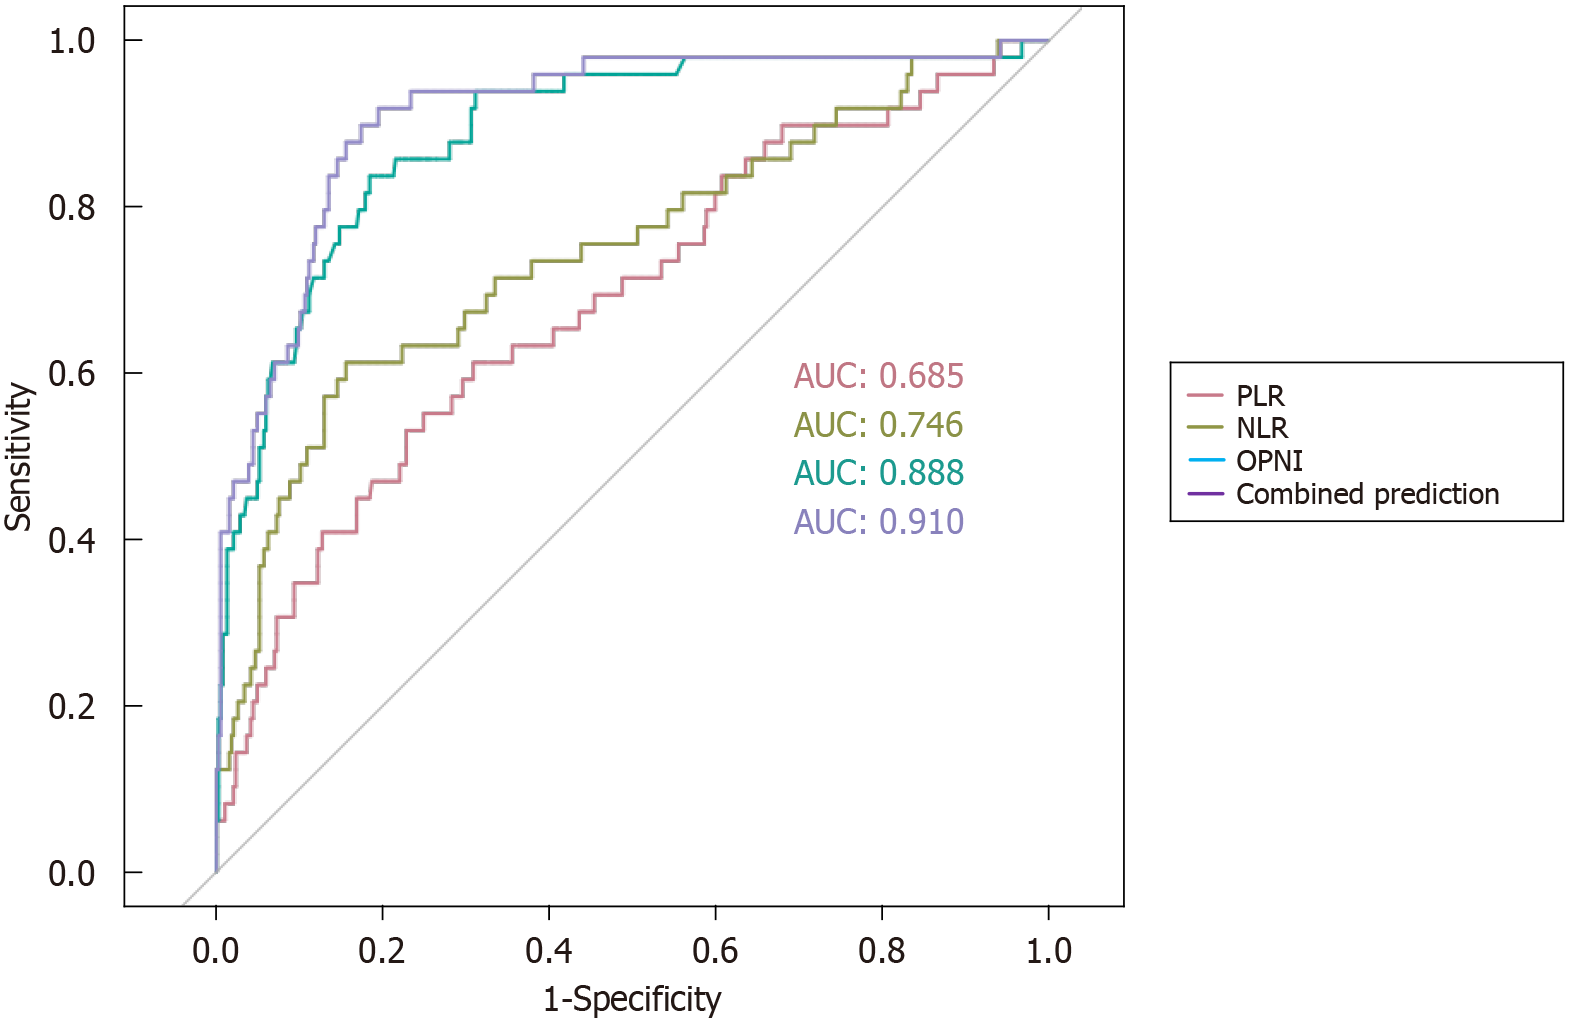
Figure 1 Area under the curve of the Onodera prognostic nutritional index, neutrophil-to-lymphocyte ratio, platelet-to-lymphocyte ratio and combined prediction.
OPNI: Onodera prognostic nutritional index; NLR: Neutrophil-to-lymphocyte ratio; PLR: Platelet-to-lymphocyte ratio; AUC: Area under the curve.
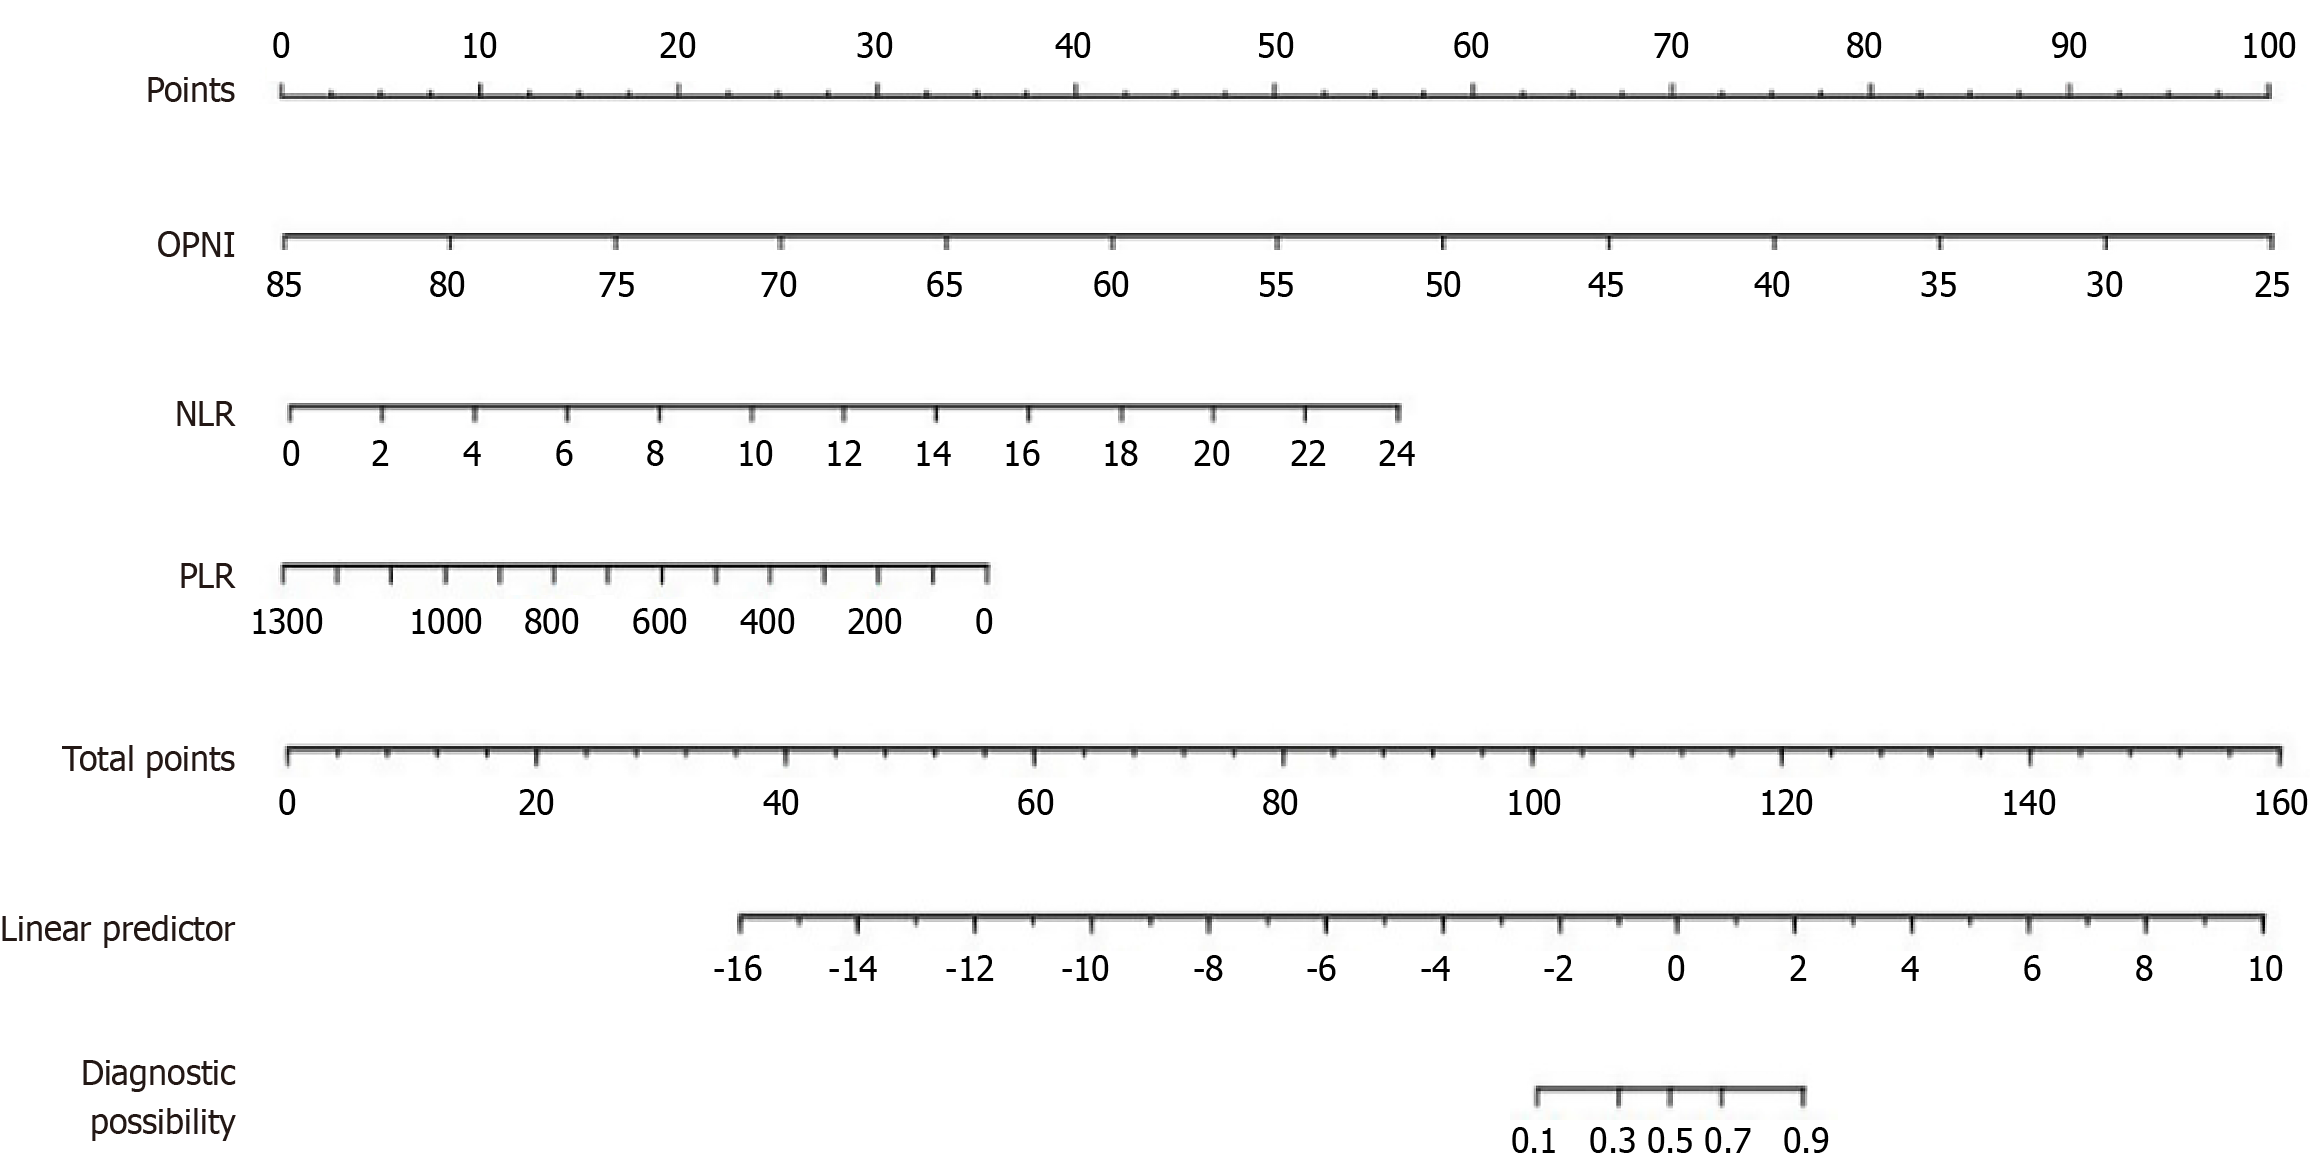
Figure 2 Nomogram for predicting postoperative anastomotic leakage in patients with rectal cancer.
OPNI: Onodera prognostic nutritional index; NLR: Neutrophil-to-lymphocyte ratio; PLR: Platelet-to-lymphocyte ratio.
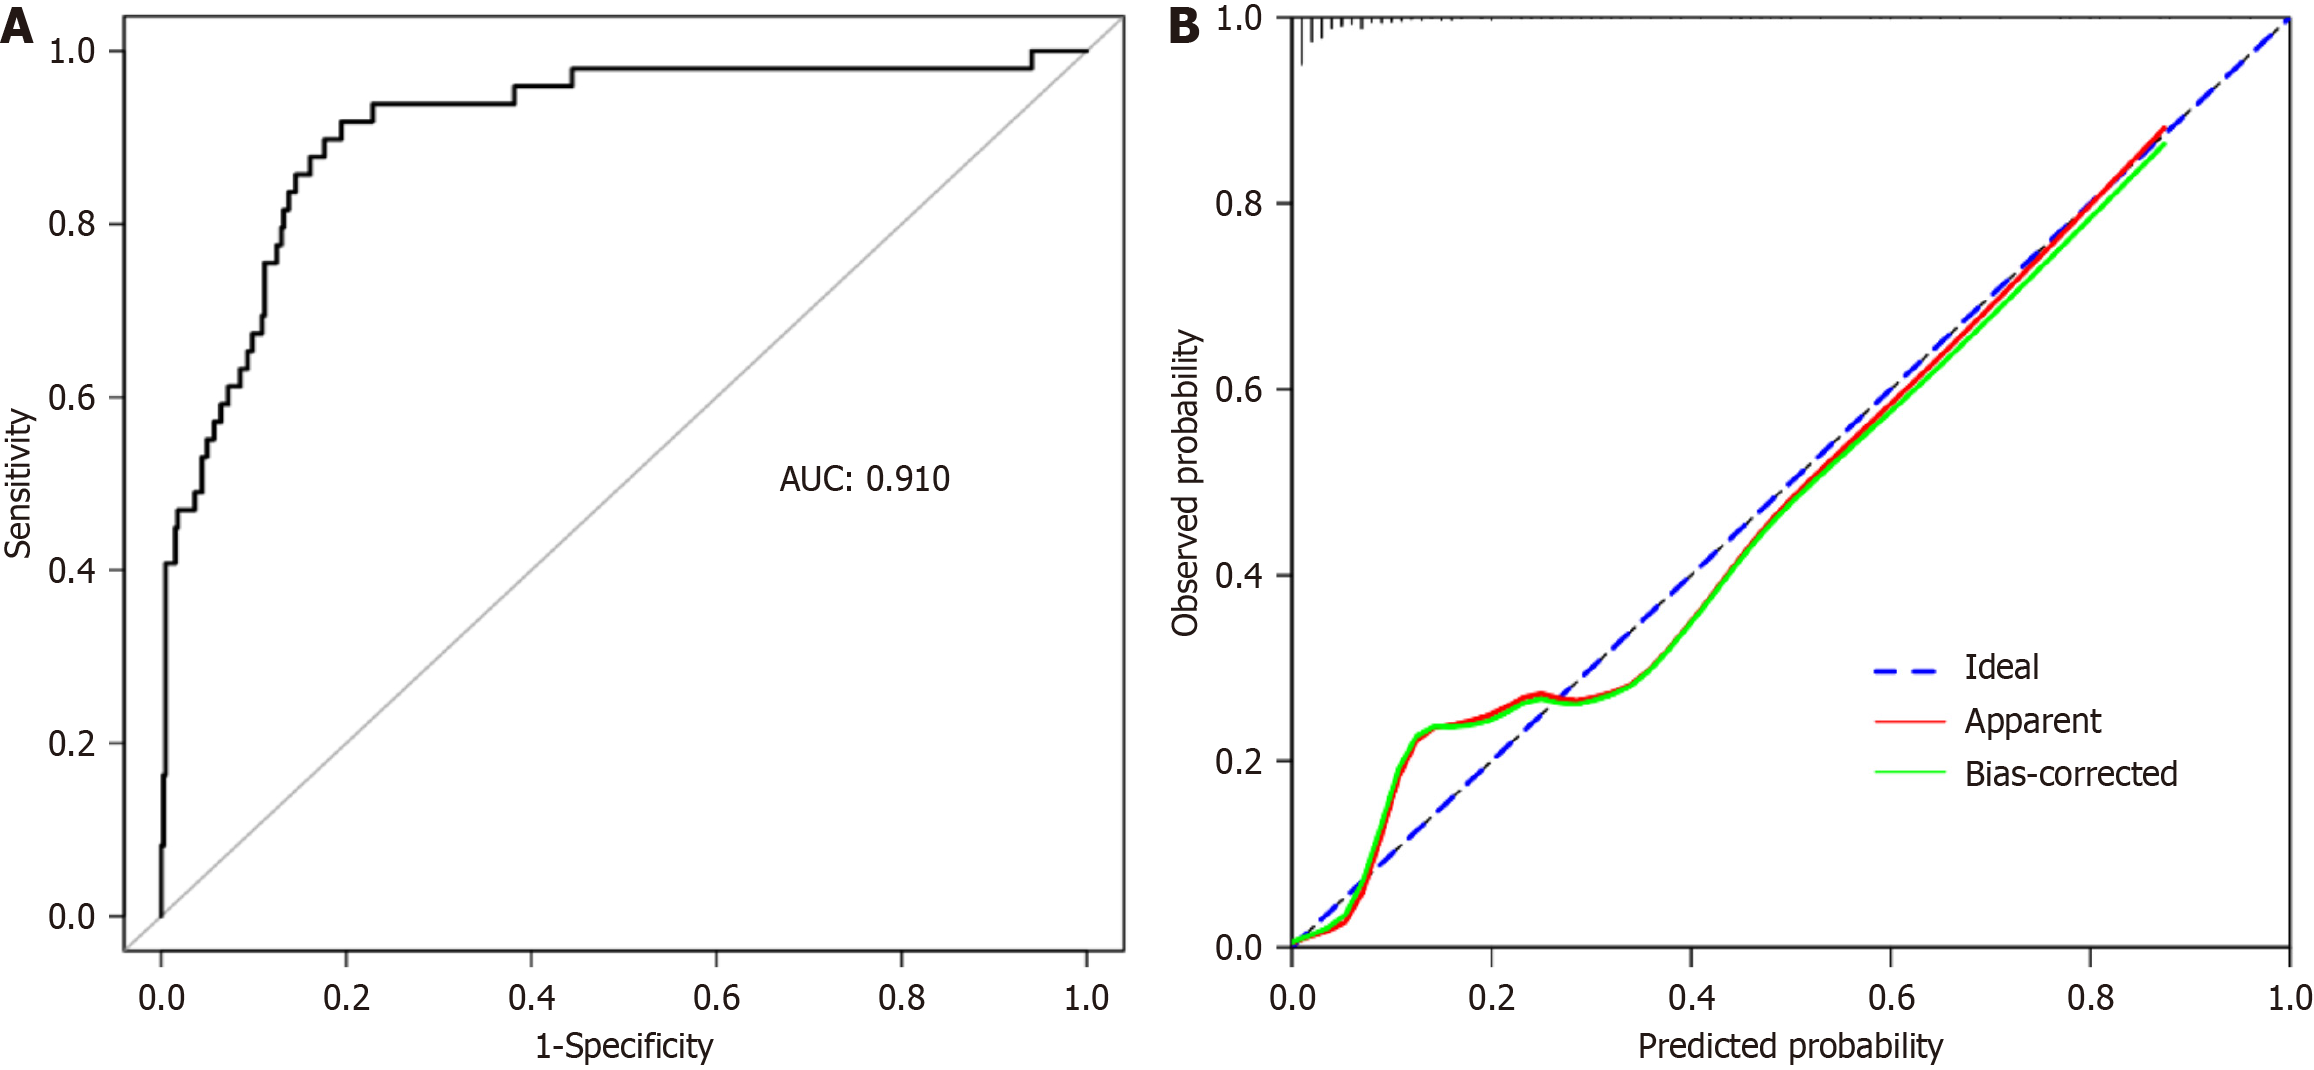
Figure 3 Receiver operating characteristic curves and calibration curves of the nomogram for predicting postoperative anastomotic leakage in patients with rectal cancer.
A: Receiver operating characteristic curve of the nomogram; B: Calibration curve of the nomogram. AUC: Area under the curve. AUC: Area under the curve.
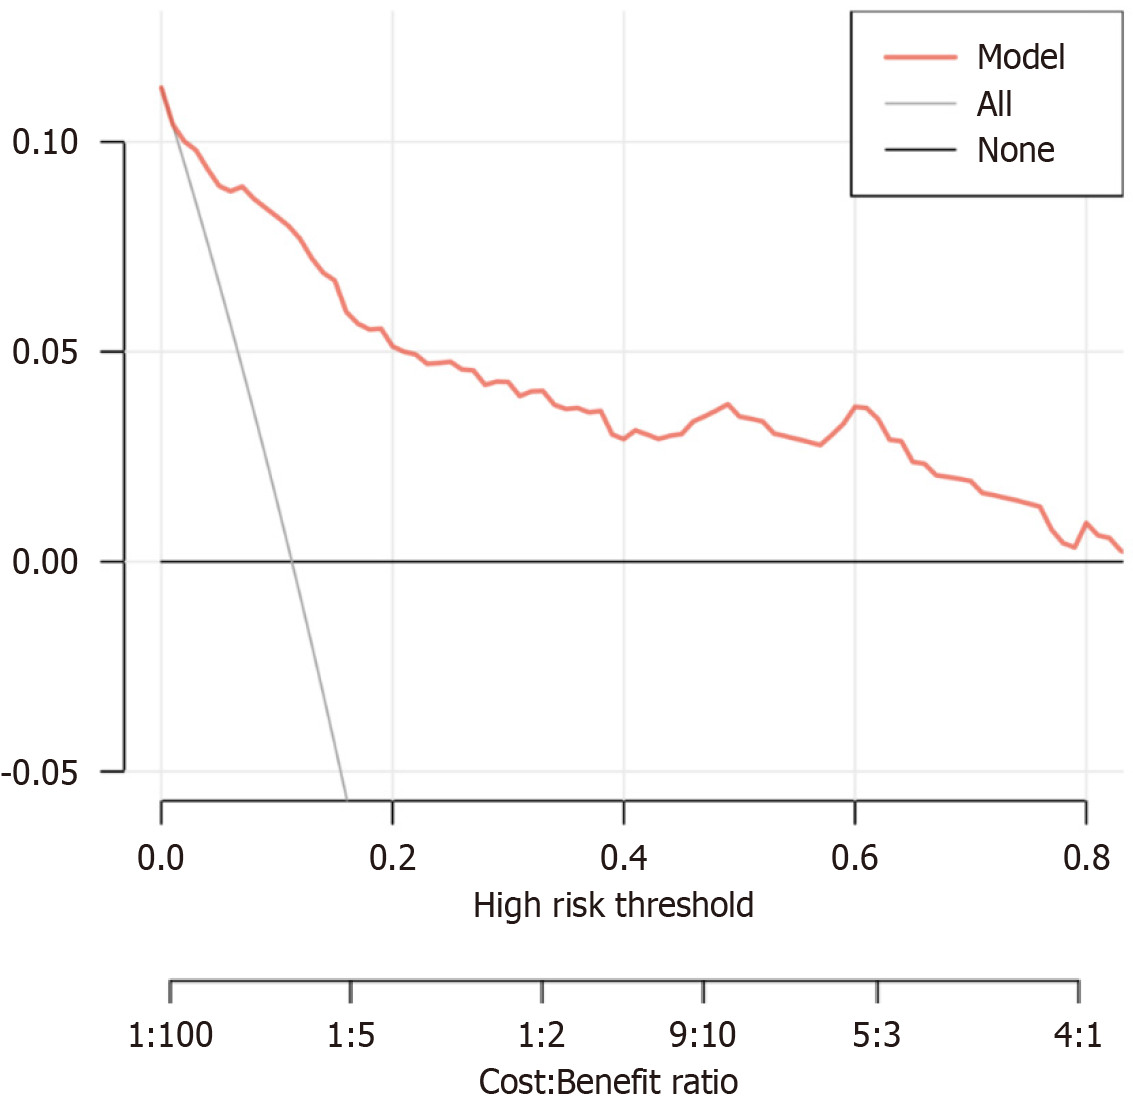
Figure 4
Decision curve analysis of the nomogram for the predicting postoperative anastomotic leakage in patients with rectal cancer.
- Citation: Zhang ZY, Li KJ, Zeng XY, Wang K, Sulayman S, Chen Y, Zhao ZL. Early prediction of anastomotic leakage after rectal cancer surgery: Onodera prognostic nutritional index combined with inflammation-related biomarkers. World J Gastrointest Surg 2025; 17(4): 102862
- URL: https://www.wjgnet.com/1948-9366/full/v17/i4/102862.htm
- DOI: https://dx.doi.org/10.4240/wjgs.v17.i4.102862


