Copyright
©The Author(s) 2025.
World J Gastrointest Surg. Oct 27, 2025; 17(10): 110836
Published online Oct 27, 2025. doi: 10.4240/wjgs.v17.i10.110836
Published online Oct 27, 2025. doi: 10.4240/wjgs.v17.i10.110836
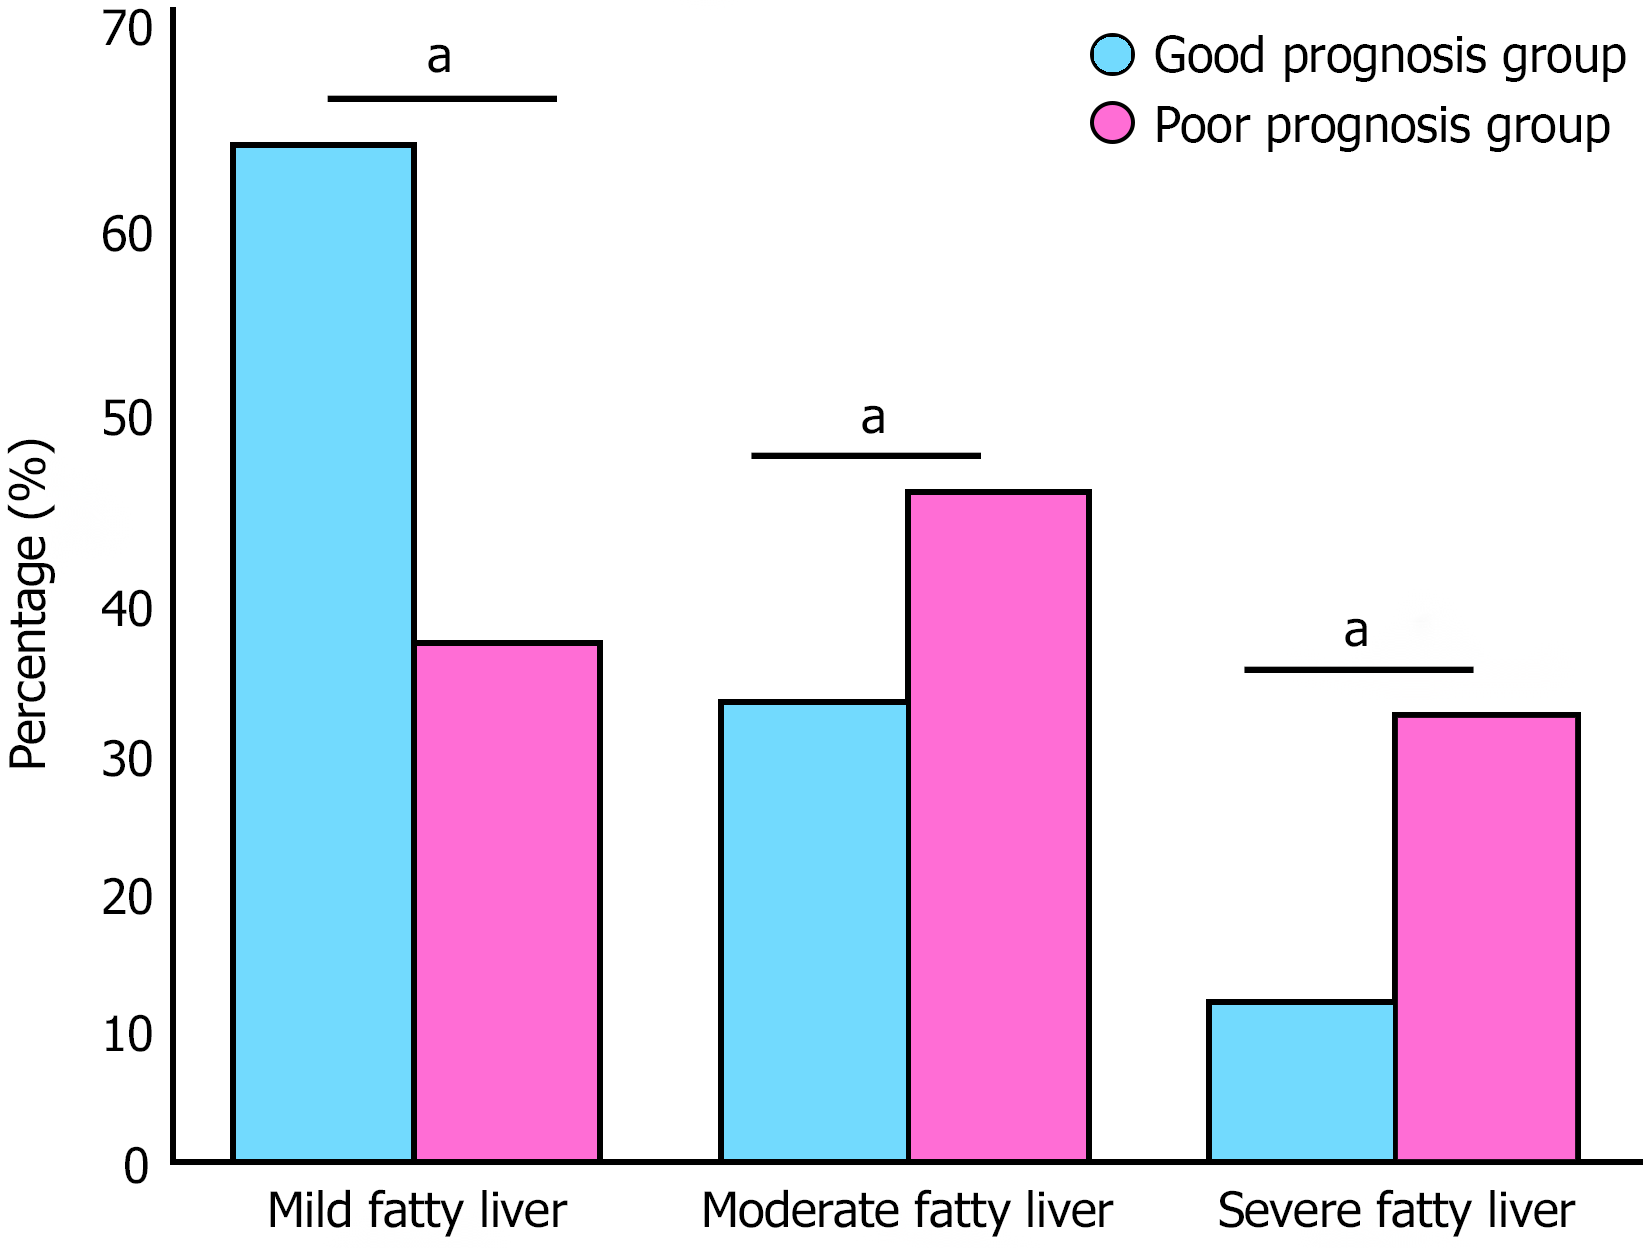
Figure 1 Distribution of fatty liver severity between good and poor prognosis groups.
Distribution of fatty liver severity among 165 patients based on liver-spleen density difference on non-contrast computed tomography imaging. Mild fatty liver was most common (54.6%), followed by moderate (30.9%) and severe (14.5%) fatty liver. Moderate to severe fatty liver was significantly more prevalent in the poor prognosis group compared to the good prognosis group. aP < 0.05.
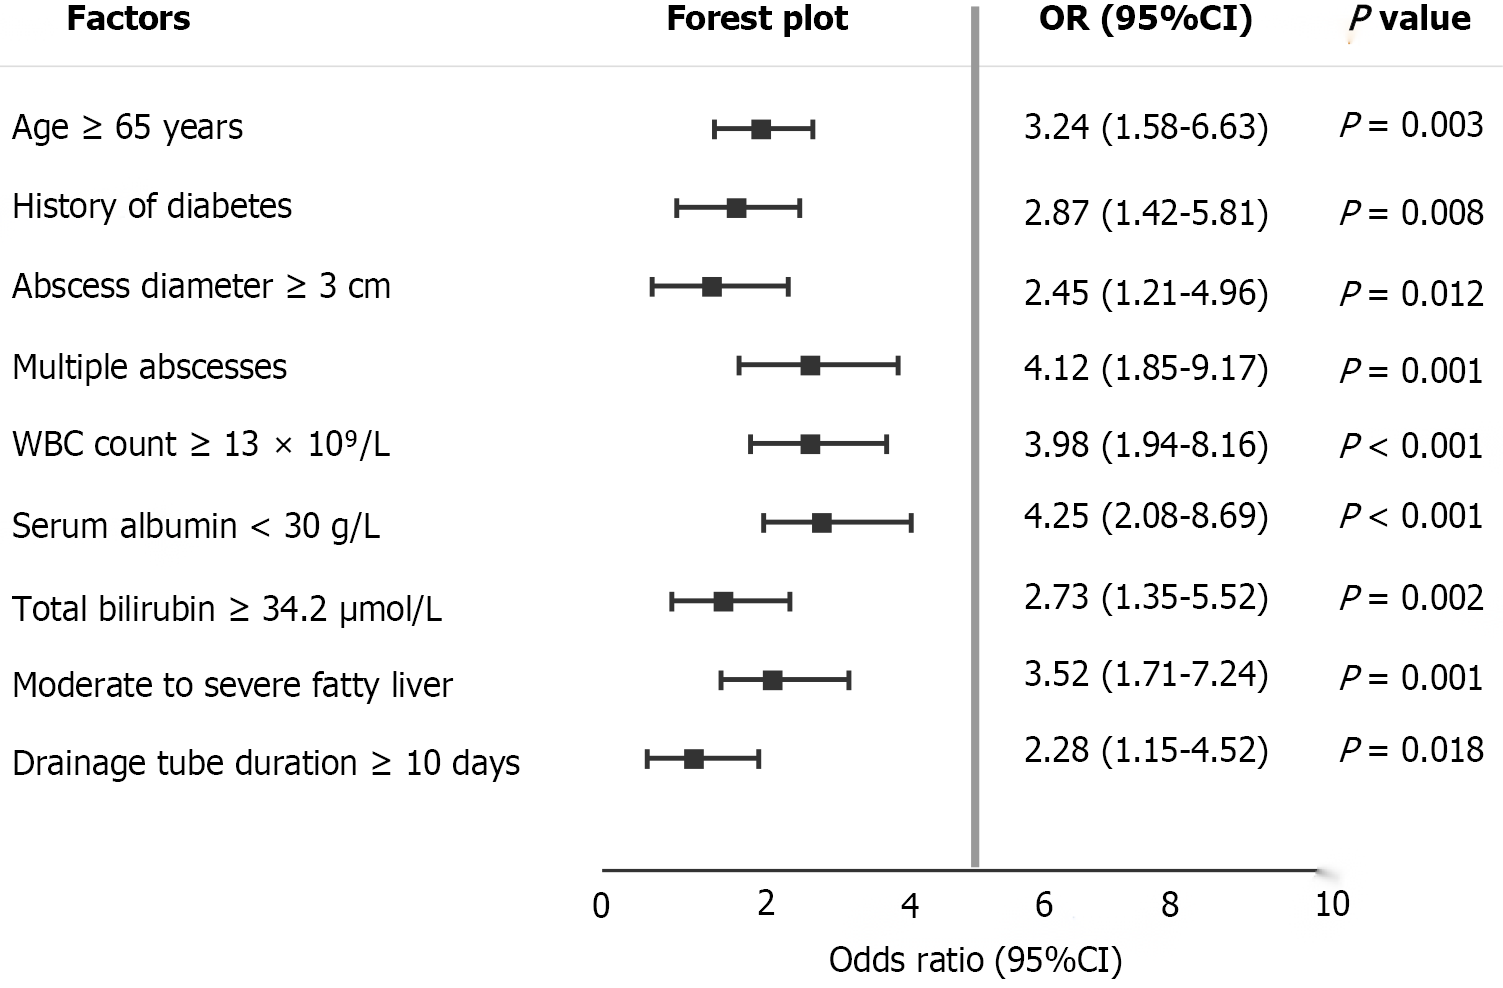
Figure 2 Risk factors for poor prognosis after percutaneous drainage in hepatic abscess patients with fatty liver.
This forest plot presents the univariate analysis results identifying nine significant risk factors associated with poor prognosis following percutaneous drainage in hepatic abscess patients with concurrent fatty liver disease. The most significant predictors include hypoalbuminemia (< 30 g/L, OR = 4.25), multiple abscesses (OR = 4.12), elevated white blood cell count (≥ 15 × 109/L, OR = 3.98), and moderate to severe fatty liver (OR = 3.52), with all factors demonstrating statistical significance (P < 0.05).
- Citation: Zhang L, Yang WF, Wu HD, Zhu HH. Risk factors analysis for poor prognosis after percutaneous drainage in liver abscess patients with fatty liver. World J Gastrointest Surg 2025; 17(10): 110836
- URL: https://www.wjgnet.com/1948-9366/full/v17/i10/110836.htm
- DOI: https://dx.doi.org/10.4240/wjgs.v17.i10.110836


