Copyright
©The Author(s) 2025.
World J Gastrointest Surg. Oct 27, 2025; 17(10): 110543
Published online Oct 27, 2025. doi: 10.4240/wjgs.v17.i10.110543
Published online Oct 27, 2025. doi: 10.4240/wjgs.v17.i10.110543
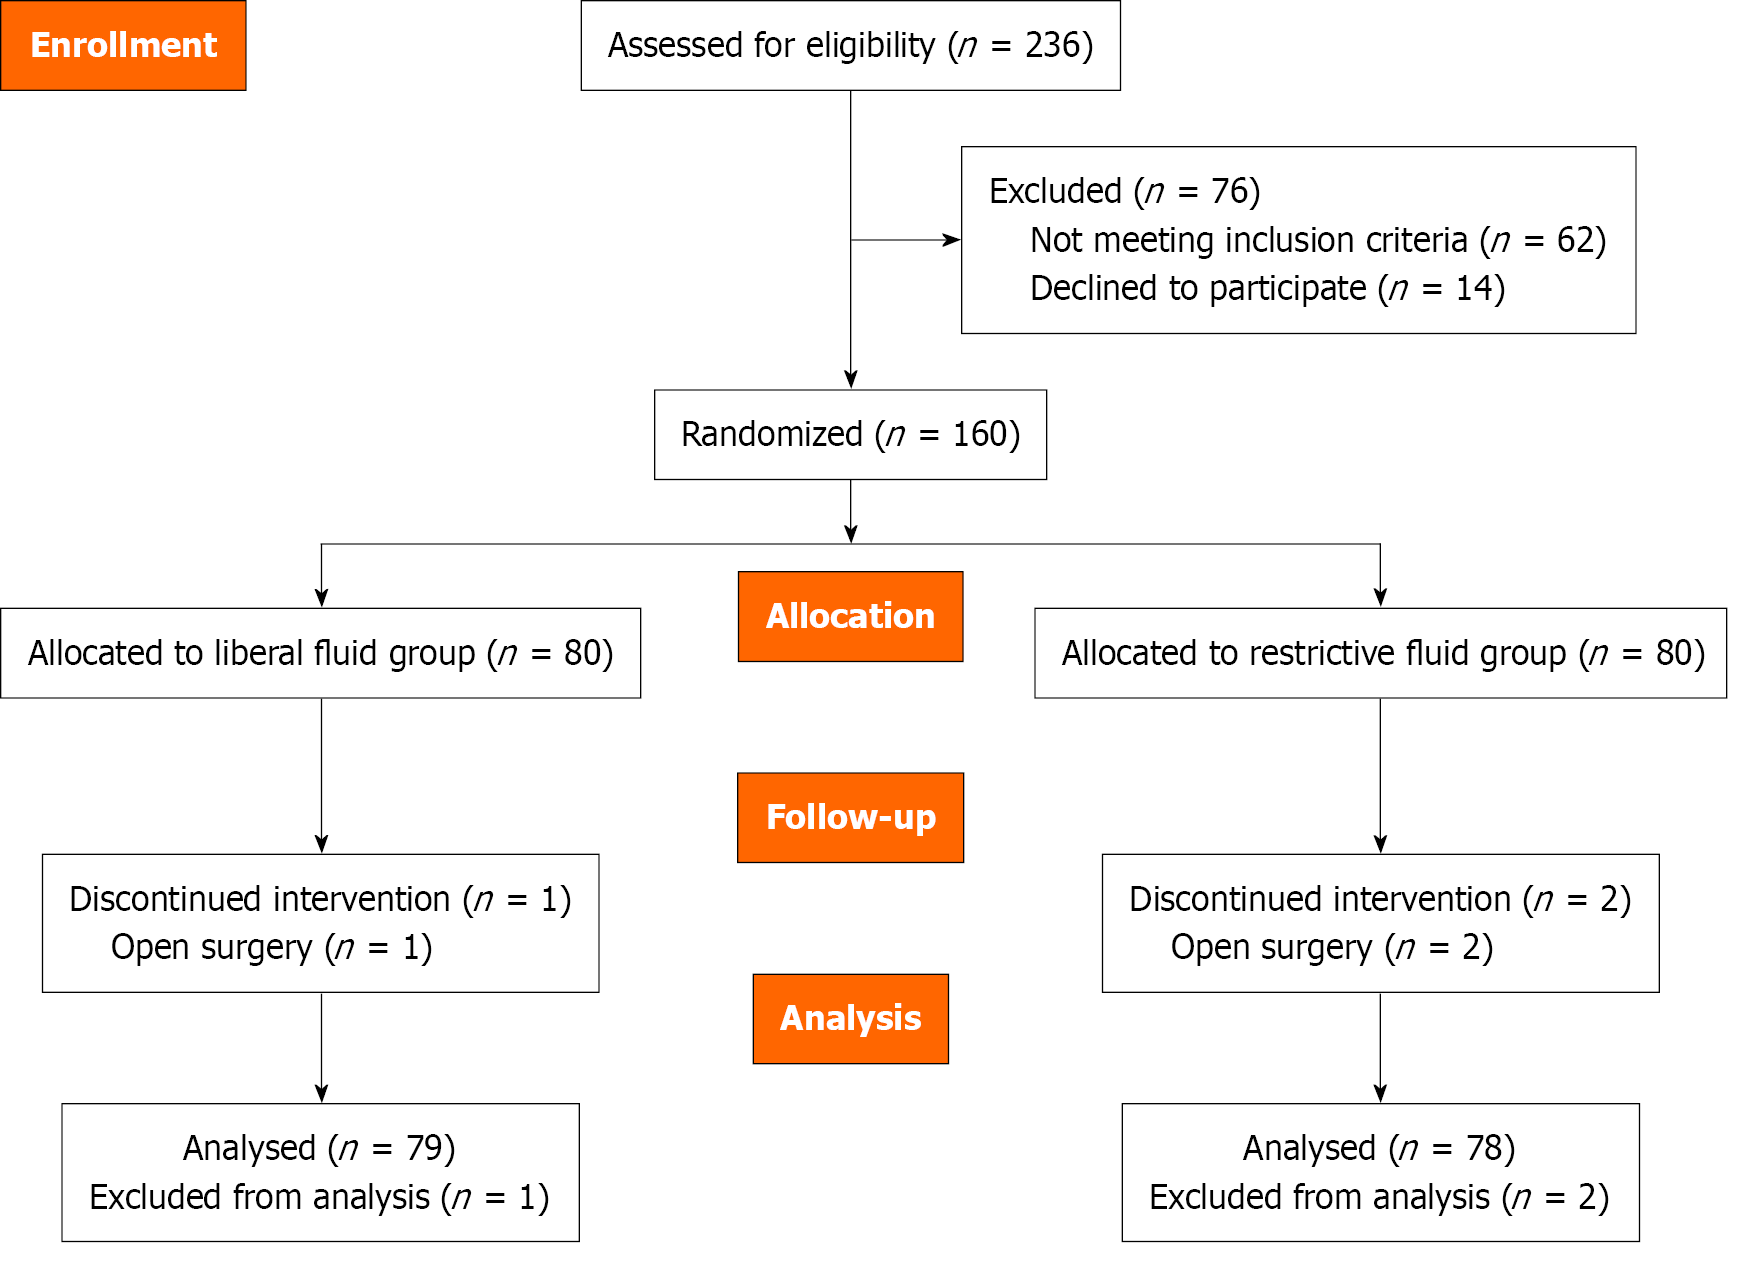
Figure 1 CONSORT flow diagram of patient enrollment.
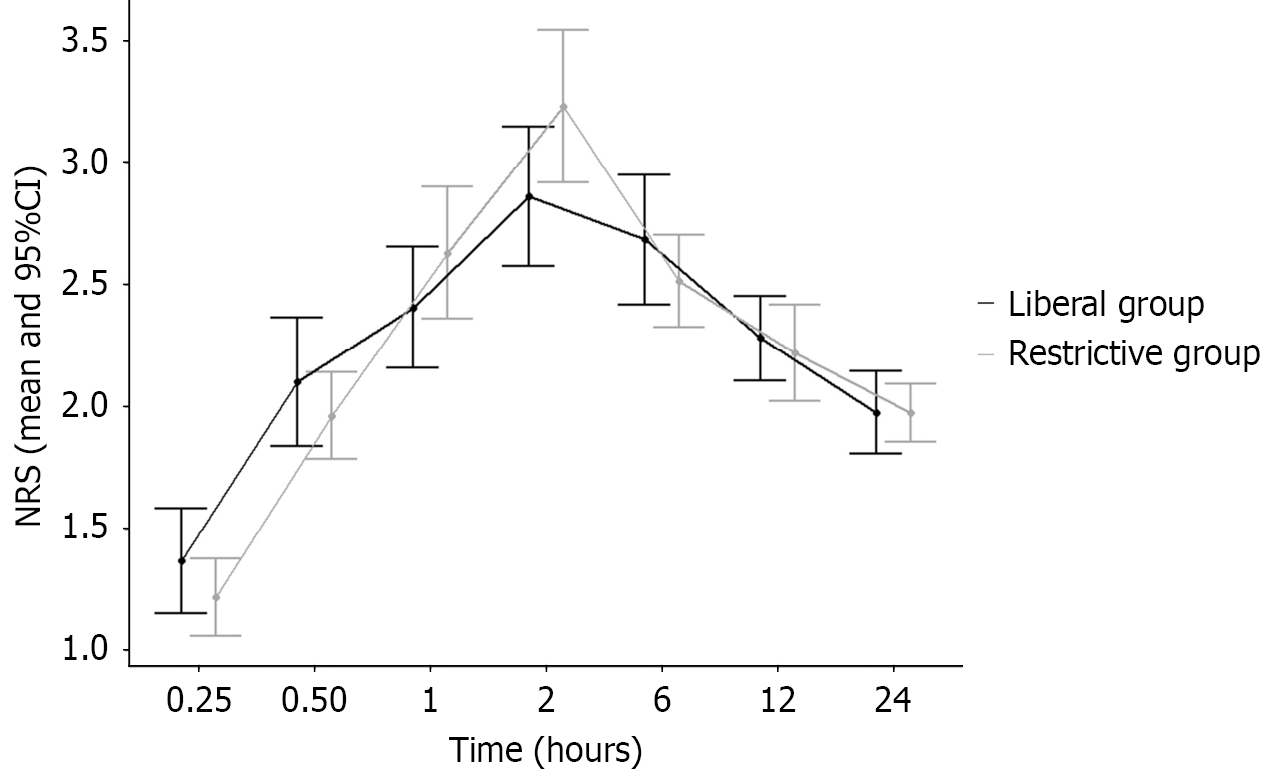
Figure 2 Comparison of time-dependent changes of Numerical Rating Scale values between groups.
The X-axis represents the mean Numerical Rating Scale pain scores at different time points, and the Y-axis represents the average score values. The error bars indicate 95% confidence intervals. CI: Confidence interval; NRS: Numerical Rating Scale.
- Citation: Korkusuz M, Et T. Effect of perioperative restrictive and liberal fluid regimens on postoperative nausea-vomiting and quality of recovery in laparoscopic cholecystectomy. World J Gastrointest Surg 2025; 17(10): 110543
- URL: https://www.wjgnet.com/1948-9366/full/v17/i10/110543.htm
- DOI: https://dx.doi.org/10.4240/wjgs.v17.i10.110543


