Copyright
©The Author(s) 2025.
World J Gastrointest Surg. Oct 27, 2025; 17(10): 108859
Published online Oct 27, 2025. doi: 10.4240/wjgs.v17.i10.108859
Published online Oct 27, 2025. doi: 10.4240/wjgs.v17.i10.108859
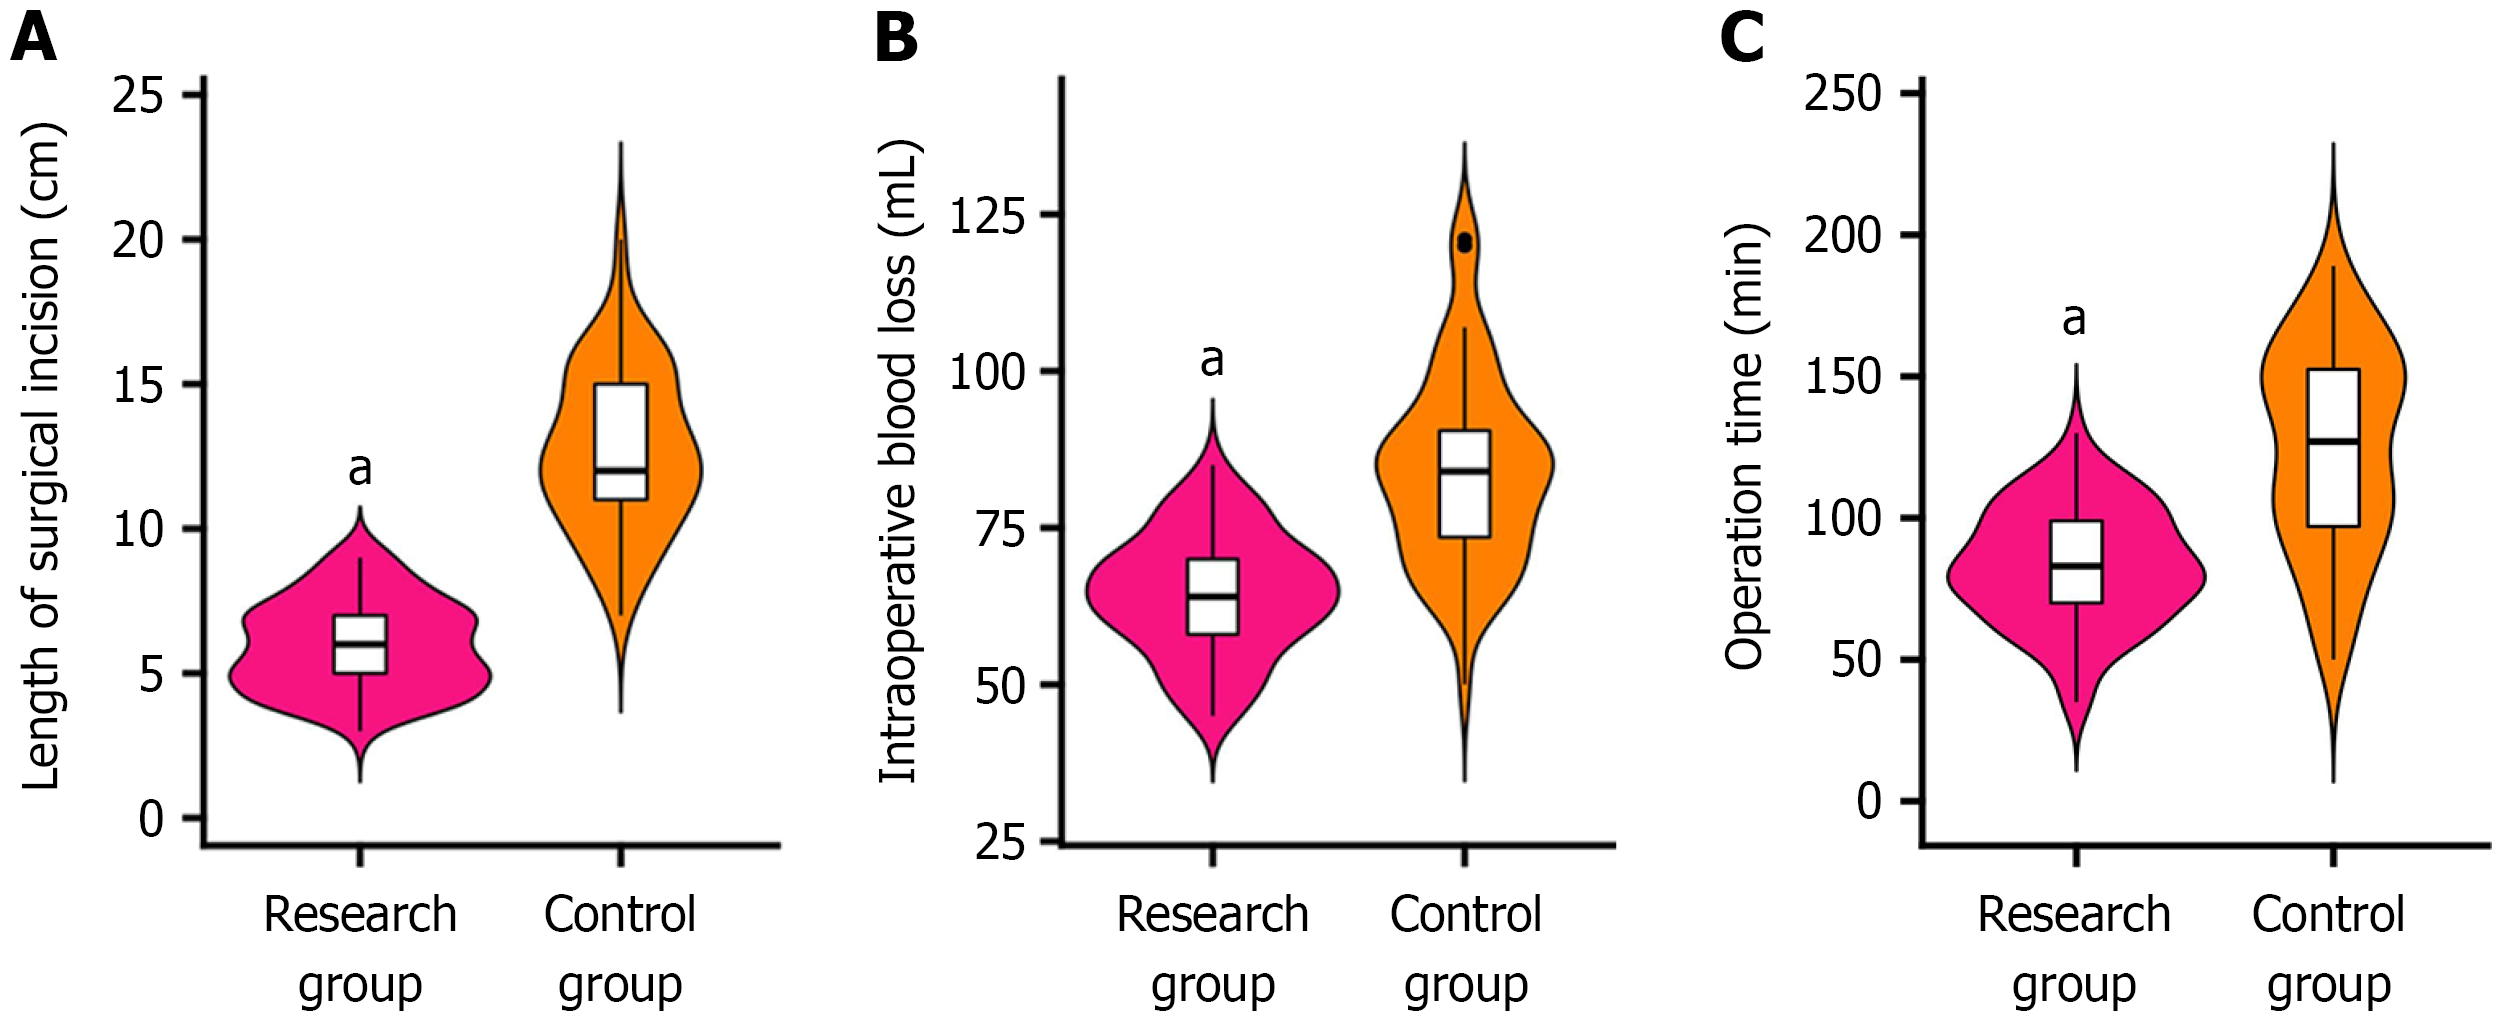
Figure 1 Comparative analysis of surgical incision length, intraoperative blood loss, and operation duration between groups.
A: Comparison of surgical incision length; B: Comparison of intraoperative blood loss; C: Comparison of operation duration. aP < 0.001, indicating a significant difference from the control group.
Figure 2 Postoperative recovery metrics between research and control groups.
A: Time to first ambulation in research and control groups; B: Time to first flatus in research and control groups; C: Time to first oral intake in research and control groups; D: Length of hospital stay in research and control groups. aP < 0.01, highlighting significant differences from the control group.
Figure 3 Carcinoembryonic antigen, carbohydrate antigen 125, and carbohydrate antigen 19-9 levels pre- and post-surgery in research and control groups.
A: Carcinoembryonic antigen levels in research and control groups; B: Carbohydrate antigen (CA)125 levels in research and control groups; C: CA19-9 levels in research and control groups. CEA: Carcinoembryonic antigen; CA: Carbohydrate antigen. aP < 0.01, bP < 0.001, reflecting significant changes from preoperative levels; cP < 0.05, denoting significant differences from the control group.
- Citation: Fang M, Jiang JH, Zhu DD, Yu FX. Endoscopic submucosal dissection for early gastric cancer and precancerous lesions enhances postoperative recovery and mitigates complication risks. World J Gastrointest Surg 2025; 17(10): 108859
- URL: https://www.wjgnet.com/1948-9366/full/v17/i10/108859.htm
- DOI: https://dx.doi.org/10.4240/wjgs.v17.i10.108859


