Published online Nov 15, 2025. doi: 10.4239/wjd.v16.i11.111223
Revised: August 18, 2025
Accepted: September 24, 2025
Published online: November 15, 2025
Processing time: 142 Days and 2 Hours
Type 2 diabetes mellitus (T2DM) is associated with significant metabolic and renal complications, including diabetic nephropathy (DN).
To investigate the role of ribonucleotide reductase regulatory subunit M2 (RRM2) in T2DM and its potential involvement in renal injury through oxidative stress, apoptosis, and ferroptosis.
A cross-sectional study was conducted, comprising 194 patients with T2DM and 120 healthy controls at our hospital between January 2022 and December 2023. The data were analyzed to ascertain the correlation between RRM2 levels and DN onset in patients with T2DM. The apoptosis rate, reactive oxygen species (ROS) levels, oxidative stress, cystine uptake, and ferrous ion (Fe2+) levels were quan
Serum RRM2 levels were significantly higher in T2DM patients than in controls
These findings suggest that RRM2 plays a crucial protective role against diabetic renal injury by mitigating oxidative stress, apoptosis, and ferroptosis via PI3K/Akt activation. Serum RRM2 may serve as a novel biomarker for early DN detection, and therapeutic strategies targeting RRM2 may offer potential benefits in preventing diabetic kidney disease progression.
Core Tip: Ribonucleotide reductase regulatory subunit M2 (RRM2) mitigates diabetic kidney disease (DKD) by inhibiting renal tubular ferroptosis via the PI3K/Akt/Nrf2 pathway. Elevated RRM2 levels in patients with type 2 diabetes mellitus are correlated with disease progression. Overexpression reduced oxidative stress, enhanced antioxidant markers [superoxide dismutase, glutathione (GSH), and GSH peroxidase 4], and suppressed ferroptosis (lower malondialdehyde and Fe2+ levels). RRM2 also activates PI3K/Akt signaling and promotes cell survival. Targeting RRM2 may offer therapeutic potential for preventing DKD progression.
- Citation: Gao CC, Ding FF, Jiang X. RRM2 attenuates the renal tubular ferroptosis in diabetic kidney disease through PI3K/Akt/Nrf2 pathway. World J Diabetes 2025; 16(11): 111223
- URL: https://www.wjgnet.com/1948-9358/full/v16/i11/111223.htm
- DOI: https://dx.doi.org/10.4239/wjd.v16.i11.111223
Diabetic kidney disease (DKD) is a major microvascular complication of diabetes mellitus and a leading cause of end-stage renal disease worldwide[1]. Renal tubular injury plays a crucial role in the progression of DKD and contributes to inflammation, fibrosis, and functional decline[2]. Emerging evidence suggests that ferroptosis, an iron-dependent form of regulated cell death characterized by lipid peroxidation, is a key pathogenic mechanism in DKD[3]. The dysregulation of cellular antioxidant defenses, including the Nrf2 pathway, exacerbates oxidative stress and ferroptosis in renal tubular cells[4].
The PI3K/Akt/Nrf2 pathway plays a pivotal role in cellular defense against oxidative stress and inflammation, both of which are central to the pathogenesis of DKD[5]. Emerging evidence suggests that dysregulation of this pathway may exacerbate ferroptosis in renal tubular cells, thereby accelerating kidney damage in patients with diabetes[6]. Understanding the interplay between ferroptosis and the PI3K/Akt/Nrf2 axis may provide critical insights into potential therapeutic interventions for DKD[7].
Ribonucleotide reductase (RNR) regulatory subunit M2 (RRM2), a critical enzyme in DNA synthesis, has recently been implicated in cellular stress responses beyond its canonical role in nucleotide metabolism[8]. Studies have indicated that RRM2 may exert cytoprotective effects by modulating oxidative stress and apoptosis[9]. However, its role in ferroptosis, particularly in DKD, remains unexplored. The PI3K/Akt pathway, a well-known regulator of cell survival, activates Nrf2, thereby enhancing antioxidant defenses[6]. Given the interplay between oxidative stress and ferroptosis in DKD, we hypothesized that RRM2 attenuates renal tubular ferroptosis via the PI3K/Akt/Nrf2 signaling axis.
This study aimed to investigate the protective role of RRM2 in renal tubular ferroptosis in DKD and to elucidate the underlying mechanisms involving the PI3K/Akt/Nrf2 pathway. Our findings may provide novel therapeutic insights into mitigating tubular injury in DKD by targeting RRM2-mediated suppression of ferroptosis.
This cross-sectional study included 194 patients with type 2 diabetes mellitus (T2DM) admitted to the Department of Endocrinology of our hospital between January 2022 and December 2023. T2DM was diagnosed according to the following criteria: A fasting glucose ≥ 7.0 mmol/L or 2 hours postprandial glucose level ≥ 11.1 mmol/L. The 194 T2DM patients were divided into three subgroups: Normoalbuminuria [urine albumin-to-creatinine ratio (ACR) < 30 mg/g;
Upon admission, general clinical data were recorded for all participants, including age, sex, body mass index (BMI), duration of T2DM, and systolic blood pressure (SBP). Following an overnight fast of at least 8 h, approximately 5 mL of venous blood was collected from each participant into ethylenediaminetetraacetic acid tubes for plasma preparation and serum separator tubes for biochemical assays. Samples were centrifuged at 3000 rpm for 10 minutes at 4 °C, and the resulting plasma and serum were aliquoted and stored at -80 °C until analysis. Fasting blood glucose (FBG) levels were measured using the glucose oxidase method, and glycosylated hemoglobin (HbA1c) levels were determined using high-performance liquid chromatography. Blood triglyceride (TG), total cholesterol (TC), and serum creatinine (Scr) levels were quantified using an automatic biochemistry analyzer (Hitachi 7170; Tokyo, Japan). The estimated glomerular filtration rate (eGFR) was calculated using the following simplified equation: EGFR (mL/minute/1.73 m²) = 175 × [Scr (μmol/L)/88.4]-1.154 × (age)-0.203 × (0.742 if female).
Serum was collected from 194 patients with T2DM and 120 healthy controls. Serum RRM2 (ml058017, Shanghai Enzyme-linked Biotechnology, China), neutrophil gelatinase-associated lipocalin (NGAL; QK1757, R&D Systems, China), kidney injury molecule-1 (KIM-1; DSKM100, R&D Systems, China), malondialdehyde (MDA; EU2577, FineTest, China), glutathione (GSH; E-EL-0026, Elabscience, China), solute carrier family 7 member 11 (SLC7A11; ml105355, Shanghai Enzyme-linked Biotechnology, China), and GSH peroxidase 4 (GPX4; ml060706, Shanghai Enzyme-linked Biotechnology, China)were measured using assay with commercially available kits. The assays were performed according to the manufacturer’s instructions.
The human renal tubular cell line (HK-2) was obtained from the Cell Bank of the Chinese Academy of Sciences (Shanghai, China) and authenticated by short tandem repeat profiling. It was tested negative for mycoplasma contamination prior to use. HK-2 cells were cultured in DMEM supplemented with 10% fetal bovine serum in a 37 °C, 5% CO2 incubator. For the pathway inhibition experiments, HK-2 cells were pretreated with the PI3K/Akt pathway inhibitor, LY294002 (10 μM, HY-10108, MedChemExpress).
HK-2 cells were grouped according to three methods. Method 1: HK-2 cells were treated with 5.5, 10, 20, 30, and 50 mmol/L D-glucose for 48 hours. Method 2: HK-2 cells were divided into: (1) Control group: Conventional culture; (2) High glucose (HG) group (D-glucose: 30 mmol/L) for 48 hours; (3) HG + vector group: Cells were transfected with empty vector of lentiviral vector pCDH-CMV for 48 hours and stimulated with 30 mmol/L D-glucose for 48 hours; and (4) HG + overexpressing RRM2 (OE-RRM2) group: Cells were transfected with a pCDH-CMV vector overexpressing RRM2 for 48 hours and stimulated with 30 mmol/L D-glucose for 48 hours. Method 3: HK-2 cells were divided into: (1) Control group; (2) HG group: HG + vector; (3) HG + OE-RRM2 group; and (4) HG + OE-RRM2 + LY group: Cells were transfected with pCDH-CMV vector overexpressing RRM2 for 48 hours and then incubated with a PI3K/Akt pathway inhibitor, LY294002 (10 μM), and 30 mmol/L D-glucose for 48 hours.
Human RRM2-cDNA sequences were cloned into the lentiviral vector pCDH-CMV (LM-8070, LMAI Bio) and packaged in 293T cells. Vectors OE-RRM2 and empty vectors were transfected into HK-2 cells using Lipo2000. Transfection efficiency was tested using reverse transcription quantitative PCR (RT-qPCR) and Western blotting, 48 hours after transfection.
HK-2 cells were cultured in 96-well plates at a density of 1 × 10⁴ cells/well. MTT solution (1 mg/mL, M1020, Solarbio, Beijing, China) was subsequently added to the cells and incubated for 4 hours at 37 °C. The resultant formazan crystals were dissolved in 100 μL DMSO in each well. Finally, the absorbance was measured at 570 nm using a microplate reader.
An Annexin V-FITC assay kit (CA1020, Solarbio, Beijing, China) was used to evaluate apoptotic cells. HK-2 cells were cultured in 24-well plates at a density of 5 × 10⁴ cells/well and treated for 48 hours. Subsequently, trypsin was used to digest the cells, which were incubated with Annexin FITC and propidium iodide for 15 minutes at room temperature. Flow cytometry was performed to determine the rate of apoptosis.
Immunofluorescence analysis was performed as previously described[11]. After three washes with phosphate-buffered saline (PBS), dihydroergotamine (DHE; S0063, Beyotime) was added. Subsequently, the cellular samples were stained with DAPI and examined under an inverted microscope (IX51 Olympus, Tokyo, Japan). DHE was performed according to the manufacturer's instructions.
Hk-2 cells were homogenized at a concentration of 10% (w/v) in ice-cold PBS to assess oxidative stress biomarkers. The resultant cell lysate was stored at -80 °C. The activities of MDA (S0131S, Beyotime, Shanghai, China), superoxide dismutase (SOD; S0109, Beyotime), catalase (CAT; S0051, Beyotime), and GSH (S0051, Beyotime) were evaluated using commercial kits, and the level of oxidative stress was determined using a previously established method[11].
The cystine uptake was measured using a cystine uptake assay kit (E-BC-F066; Elabscience). HK-2 cells were washed with PBS and incubated with the working solution of the Cystine Uptake Fluorometric Assay Kit. After incubation for
Cellular ferrous ion (Fe2+) levels in HK-2 cell lysates were analyzed using a Ferrous Iron Colorimetric Assay Kit (E-BC-K773-M, Elabscience) and determined at an OD of 590 nm[13].
A PrimeScript RT Reagent Kit (TaKaRa Bio Inc., Dalian, China) was used to synthesize cDNA from 1 μg of total RNA extracted from HK-2 cells. RNA extraction was conducted using TRIzol, a dependable product from Invitrogen. For RT-qPCR, a Takara SYBR Green kit, which is recognized for its precision, was used in conjunction with an Applied Biosystems 7500 real-time PCR machine (CA, United States). The primer sequences used in this study are listed in Supplementary Table 1, with GAPDH serving as an internal reference. All primers were designed using the NCBI Primer-BLAST Tool. The RT-qPCR protocol included an initial denaturation step of 7 minutes at 95 °C, followed by 40 cycles of 15 seconds at 95 °C, and 1 minute at 60 °C. The relative mRNA levels were quantified using the 2-ΔΔCt method[14].
Complete proteins were extracted using RIPA lysis buffer, whereas nuclear proteins were isolated using extraction reagents (Pierce Biotechnology, Inc.). Protein concentrations were quantified using a BCA protein assay kit (Beyotime Biotechnology). Protein samples (50 μg) were separated using 10% SDS-PAGE and subsequently transferred to PVDF membranes. The membranes were blocked with a 5% low-fat milk solution and incubated with primary antibodies against RRM2 (1:500, ab172476, rabbit monoclonal, Abcam), p-PI3K (p85, Tyr458) (1:400, ab278545, rabbit monoclonal, Abcam), PI3K (1:500, ab302958, rabbit monoclonal, Abcam), p-Akt (Ser473; 1:400, ab81283, rabbit monoclonal, Abcam), Akt (1:400, ab8805, rabbit polyclonal, Abcam), Nrf2 (1:500, ab313825, rabbit monoclonal, Abcam), and Histone (1:500, ab1791, rabbit polyclonal, Abcam). Subsequently, membranes were incubated with horseradish peroxidase-conjugated secondary antibodies. GAPDH (1:2000, ab8245, mouse monoclonal, Abcam) was used as the internal control. Finally, the bands were visualized using ECL (Thermo Fisher Scientific, Waltham, MA, United States) and analyzed using ImageJ software.
All statistical analyses were performed using SPSS 20.0 software. Quantitative data were expressed as mean ± SD, while categorical data were expressed as frequencies and percentages. Quantitative data were tested for normality using the Shapiro-Wilk test and homogeneity of variance using the Levene test. For quantitative data that conformed to normal distribution and homogeneity of variance, the t-test was used to analyze the differences between the two groups, one-way analysis of variance (ANOVA) was used to analyze the differences between the three groups, and the least significant difference was used to further compare the two groups. For quantitative data that did not conform to a normal distribution and/or homogeneity of variance, the Mann-Whitney U test (between two groups) or Kruskal Wallis test (between three groups) was used to analyze the differences between groups. Correlation analysis between various factors was conducted using the Spearman’s rank correlation analysis. Multivariate logistic regression was performed to evaluate the influence of serum RRM2 on the risk of T2DM. Statistical significance was set at P < 0.05.
This study employed a comprehensive methodology to compare individuals with T2DM to a cohort of healthy controls. The results of Student's t-test indicated that individuals with T2DM demonstrated significantly elevated levels of various health markers, including BMI, duration of diabetes (years), SBP, FBG, HbA1c, TG, TC, eGFR, Scr, urinary NGAL, urinary KIM-1, MDA, GSH, SLC7A11, GPX4, and RRM2 (Table 1). However, there were no significant differences in age and sex between the T2DM and healthy control groups (P > 0.05).
| Characteristics | Control (n = 120) | T2DM (n = 194) | P value |
| Age (years) | 56.80 ± 10.41 | 55.16 ± 9.67 | 0.158 |
| Sex (male), n (%) | 68 (56.7) | 101 (52.1) | 0.426 |
| BMI (kg/m2) | 24.01 ± 1.24 | 24.55 ± 1.15 | < 0.001 |
| Duration (years) | 0 | 9.14 ± 2.01 | < 0.001 |
| SBP (mmHg) | 123.44 ± 11.21 | 136.82 ± 15.18 | < 0.001 |
| FBG (mmol/L) | 4.72 ± 0.66 | 7.76 ± 1.15 | < 0.001 |
| HbA1c (%) | 4.98 ± 0.82 | 7.94 ± 1.17 | < 0.001 |
| TG (mmol/L) | 1.89 ± 0.79 | 2.11 ± 0.82 | 0.021 |
| TC (mmol/L) | 5.29 ± 0.47 | 5.50 ± 0.72 | 0.002 |
| eGFR (mL/minute/1.73 m2) | 105.24 ± 18.35 | 99.47 ± 22.12 | 0.017 |
| Scr (μmol/L) | 67.92 ± 10.40 | 82.56 ± 17.46 | < 0.001 |
| Urinary NGAL (ng/mL) | 6.57 ± 0.92 | 8.62 ± 1.51 | < 0.001 |
| Urinary KIM-1 (ng/mL) | 1.01 ± 0.24 | 1.30 ± 0.36 | < 0.001 |
| MDA (nmol/mL) | 7.30 ± 1.13 | 9.14 ± 1.51 | < 0.001 |
| GSH (nmol/mL) | 10.76 ± 1.75 | 8.31 ± 1.92 | < 0.001 |
| SLC7A11 (pg/mL) | 141.36 ± 16.28 | 125.04 ± 19.26 | < 0.001 |
| GPX4 (ng/mL) | 175.23 ± 23.89 | 139.14 ± 20.87 | < 0.001 |
| RRM2 (pg/mL) | 24.17 ± 3.83 | 37.39 ± 6.69 | < 0.001 |
We performed a comparative analysis of all T2DM subgroups using one-way ANOVA. The findings indicated that the macroalbuminuria subgroup exhibited significantly elevated age, BMI, diabetes duration (years), SBP, FBG, TC, Scr, urinary NGAL, urinary KIM-1, and MDA levels (Table 2). In contrast, eGFR, GSH, SLC7A11, GPX4, and RRM2 levels were lower in the macroalbuminuria subgroup. This comprehensive investigation establishes a robust foundation for future research and clinical application.
| Characteristics | Normoalbuminuria (n = 93) | Microalbuminuria (n = 58) | Macroalbuminuria (n = 43) | P value |
| Age (years) | 52.93 ± 9.33 | 55.93 ± 9.87 | 58.98 ± 8.96 | 0.002 |
| Sex (male), n (%) | 46 (49.5) | 31 (53.4) | 24 (55.8) | 0.764 |
| BMI (kg/m2) | 24.23 ± 1.03 | 24.74 ± 1.18 | 24.98 ± 1.18 | 0.001 |
| Duration (years) | 8.03 ± 1.37 | 9.54 ± 1.67 | 10.99 ± 2.05 | < 0.001 |
| SBP (mmHg) | 130.61 ± 13.72 | 140.40 ± 13.10 | 145.44 ± 15.32 | < 0.001 |
| FBG (mmol/L) | 7.50 ± 1.01 | 7.82 ± 0.93 | 8.25 ± 1.49 | 0.001 |
| HbA1c (%) | 7.74 ± 0.93 | 8.02 ± 1.42 | 8.23 ± 1.21 | 0.065 |
| TG (mmol/L) | 1.97 ± 0.79 | 2.21 ± 0.88 | 2.28 ± 0.78 | 0.061 |
| TC (mmol/L) | 5.34 ± 0.70 | 5.57 ± 0.74 | 5.75 ± 0.66 | 0.006 |
| eGFR (mL/min/1.73 m2) | 110.87 ± 22.75 | 97.40 ± 12.07 | 77.60 ± 11.53 | < 0.001 |
| Scr (μmol/L) | 72.07 ± 9.14 | 82.92 ± 12.70 | 104.77 ± 15.79 | < 0.001 |
| Urinary NGAL (ng/mL) | 8.17 ± 1.31 | 8.72 ± 1.56 | 9.46 ± 1.51 | < 0.001 |
| Urinary KIM-1 (ng/mL) | 1.21 ± 0.32 | 1.34 ± 0.32 | 1.43 ± 0.42 | 0.002 |
| MDA (nmol/mL) | 8.50 ± 1.13 | 9.27 ± 1.47 | 10.35 ± 1.54 | < 0.001 |
| GSH (nmol/mL) | 9.37 ± 1.66 | 7.79 ± 1.54 | 6.73 ± 1.50 | < 0.001 |
| SLC7A11 (pg/mL) | 135.23 ± 16.74 | 121.14 ± 15.64 | 108.24 ± 14.79 | < 0.001 |
| GPX4 (ng/mL) | 150.92 ± 17.42 | 135.91 ± 15.77 | 118.04 ± 14.88 | < 0.001 |
| RRM2 (pg/mL) | 40.51 ± 6.32 | 36.29 ± 5.59 | 32.12 ± 4.91 | < 0.001 |
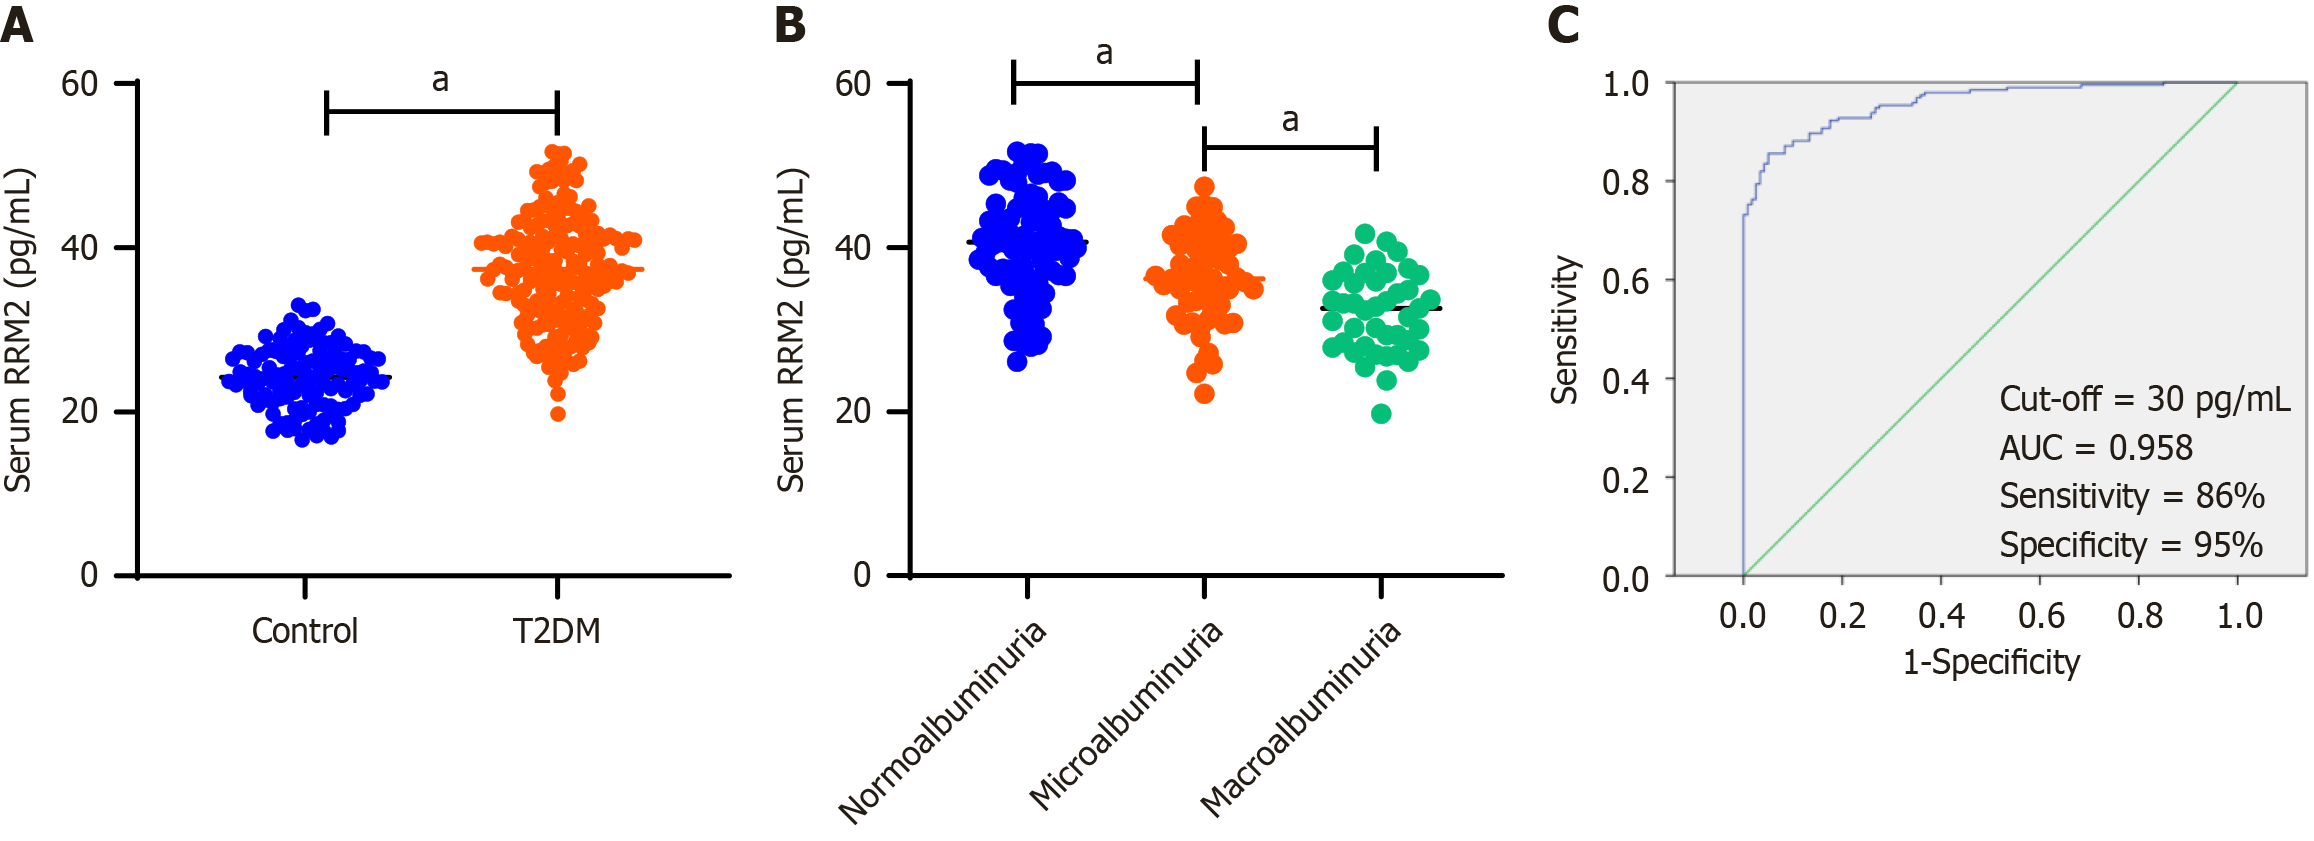
Serum RRM2 Levels were quantified using ELISA in patients with T2DM (n = 194) and healthy controls (n = 120). The findings indicated that RRM2 concentrations were significantly elevated in patients with T2DM compared with those in healthy controls (Figure 1A). Additionally, serum RRM2 levels were compared between groups stratified by albuminuria status: Normoalbuminuria (n = 93), microalbuminuria (n = 58), and macroalbuminuria (n = 43). RRM2 levels were significantly reduced in patients with macroalbuminuria compared to those with microalbuminuria and normoalbuminuria (Figure 1B). Moreover, receiver operating characteristic curve analysis revealed that the optimal cutoff value for serum RRM2 was 30 pg/mL, with a sensitivity of 86% and specificity of 95%, resulting in an area under the curve of 0.958 (Figure 1C).
In the cohort of 194 patients with T2DM, serum RRM2 levels demonstrated a negative correlation with age (r = -0.147,
| Parameters | All subjects (n = 194) | |
| r value | P value | |
| Age (years) | -0.147 | 0.041 |
| BMI (kg/m2) | -0.126 | 0.080 |
| Duration (years) | -0.390 | < 0.001 |
| SBP (mmHg) | -0.210 | 0.003 |
| FBG (mmol/L) | -0.223 | 0.002 |
| HbA1c (%) | -0.156 | 0.030 |
| TG (mmol/L) | -0.022 | 0.763 |
| TC (mmol/L) | -0.027 | 0.705 |
| eGFR (mL/min/1.73 m2) | 0.263 | < 0.001 |
| Scr (μmol/L) | -0.315 | < 0.001 |
| Urinary NGAL (ng/mL) | -0.153 | 0.034 |
| Urinary KIM-1 (ng/mL) | -0.234 | 0.001 |
| MDA (nmol/mL) | -0.326 | < 0.001 |
| GSH (nmol/mL) | 0.275 | < 0.001 |
| SLC7A11 (pg/mL) | 0.269 | < 0.001 |
| GPX4 (ng/mL) | 0.305 | < 0.001 |
Multivariate logistic regression analyses were performed to identify independent risk factors associated with DN. The findings indicated several significant variables, including the duration of diabetes [odds ratio (OR) = 1.854, 95% confidence interval (95%CI) = 1.191-2.884; P = 0.006], SBP (OR = 1.091, 95%CI = 11.026-1.160; P = 0.005), eGFR (OR = 0.946, 95%CI = 0.909-0.986; P = 0.008), Scr (OR = 1.136, 95%CI = 1.058-1.219; P < 0.001), GSH (OR = 0.438, 95%CI = 0.272-0.703;
| Characteristics | Odds ratio | 95% confidence interval | P value |
| Duration (years) | 1.854 | 1.191-2.884 | 0.006 |
| SBP (mmHg) | 1.091 | 1.026-1.160 | 0.005 |
| eGFR (mL/min/1.73 m2) | 0.946 | 0.909-0.986 | 0.008 |
| Scr (μmol/L) | 1.136 | 1.058-1.219 | < 0.001 |
| GSH (nmol/mL) | 0.438 | 0.272-0.703 | 0.001 |
| SLC7A11 (pg/mL) | 0.953 | 0.911-0.998 | 0.041 |
| GPX4 (ng/mL) | 0.925 | 0.885-0.966 | < 0.001 |
| RRM2 (pg/mL) | 0.820 | 0.712-0.945 | 0.006 |
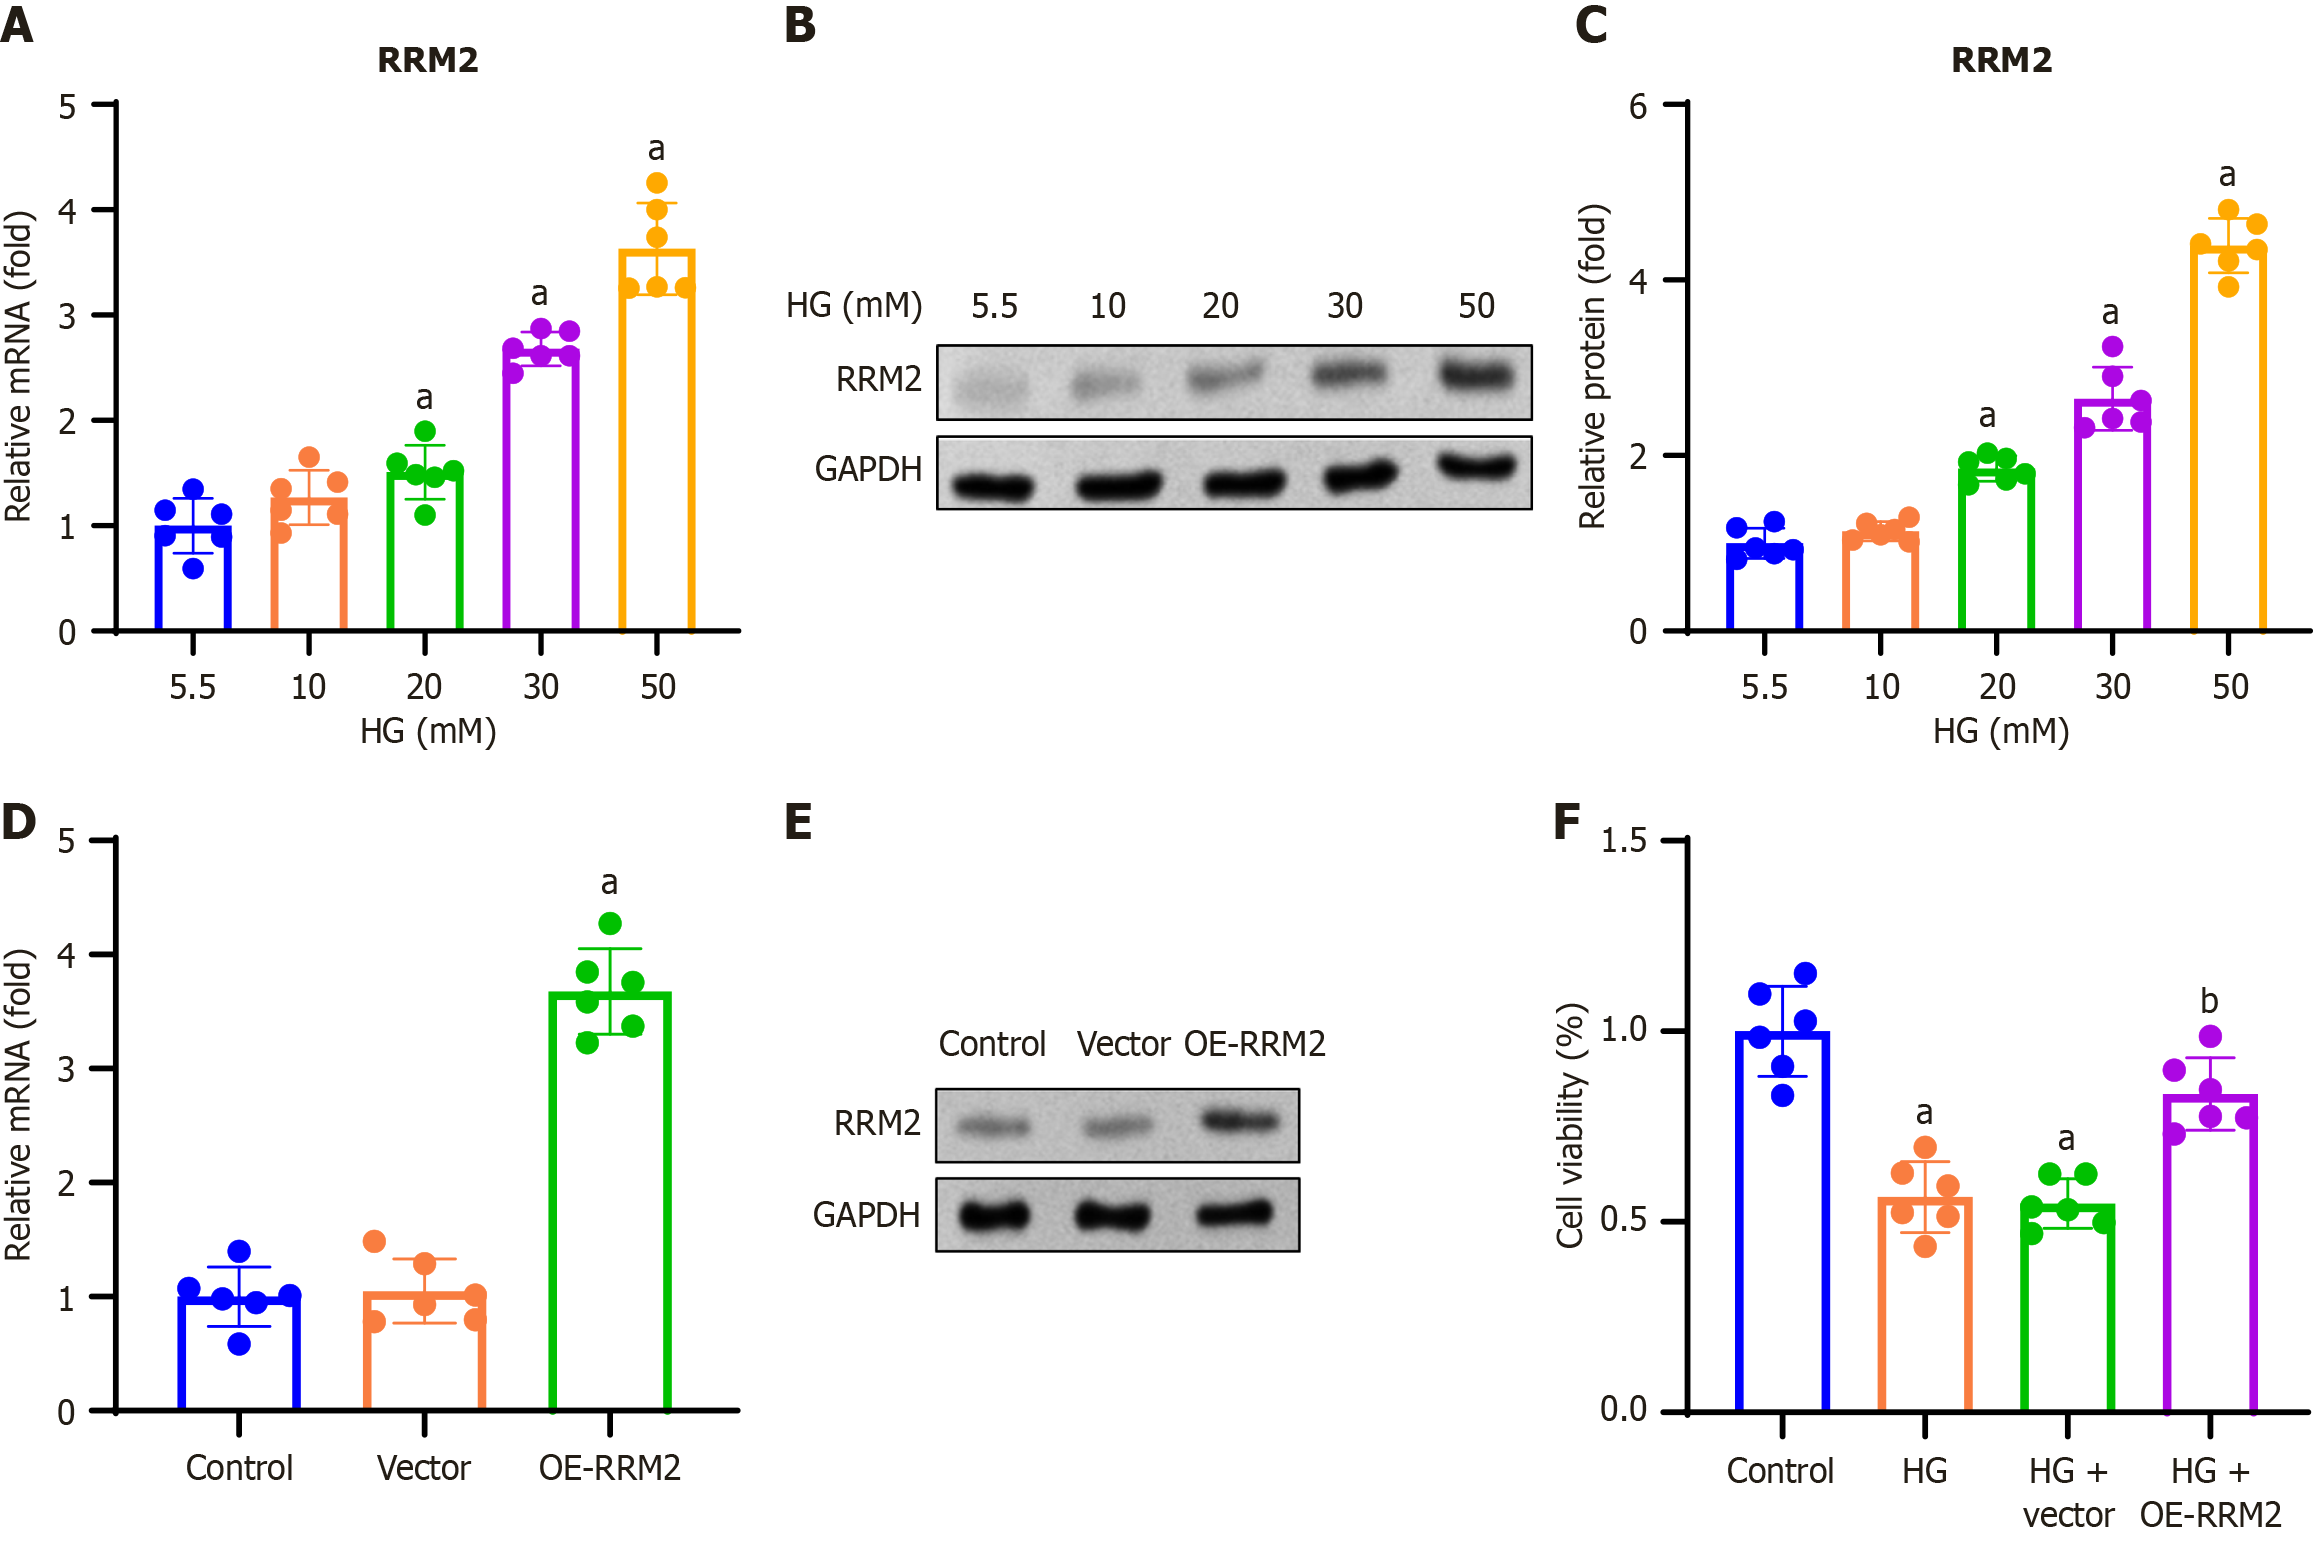
In this study, we investigated the effect of RRM2 on renal tubular cell proliferation. HK-2 cells were treated with 5.5, 10, 20, 30, and 50 mmol/L D-glucose and incubated for 48 hours. RT-qPCR analysis was performed to determine RRM2 mRNA expression, and we found that RRM2 mRNA expression increased with increasing doses (Figure 2A). To validate the obtained results, we performed western blot analysis and found that RRM2 protein expression elevated with increasing dose (Figure 2B and C). HK-2 cells were transfected with pCDH-CMV-RRM2 or an empty vector, and RT-qPCR and Western blotting were performed 48 hours after transfection. The results showed that OE-RRM2 increased RRM2 expression (Figure 2D and E). HK-2 cells were transfected with pCDH-CMV-RRM2 or an empty vector and treated with HG (30 mmol/L) for 48 hours. The effect of RRM2 overexpression on cell viability was assessed using the MTT assay. The results indicated that HG + OE-RRM2 treatment improved the cell viability (Figure 2F).
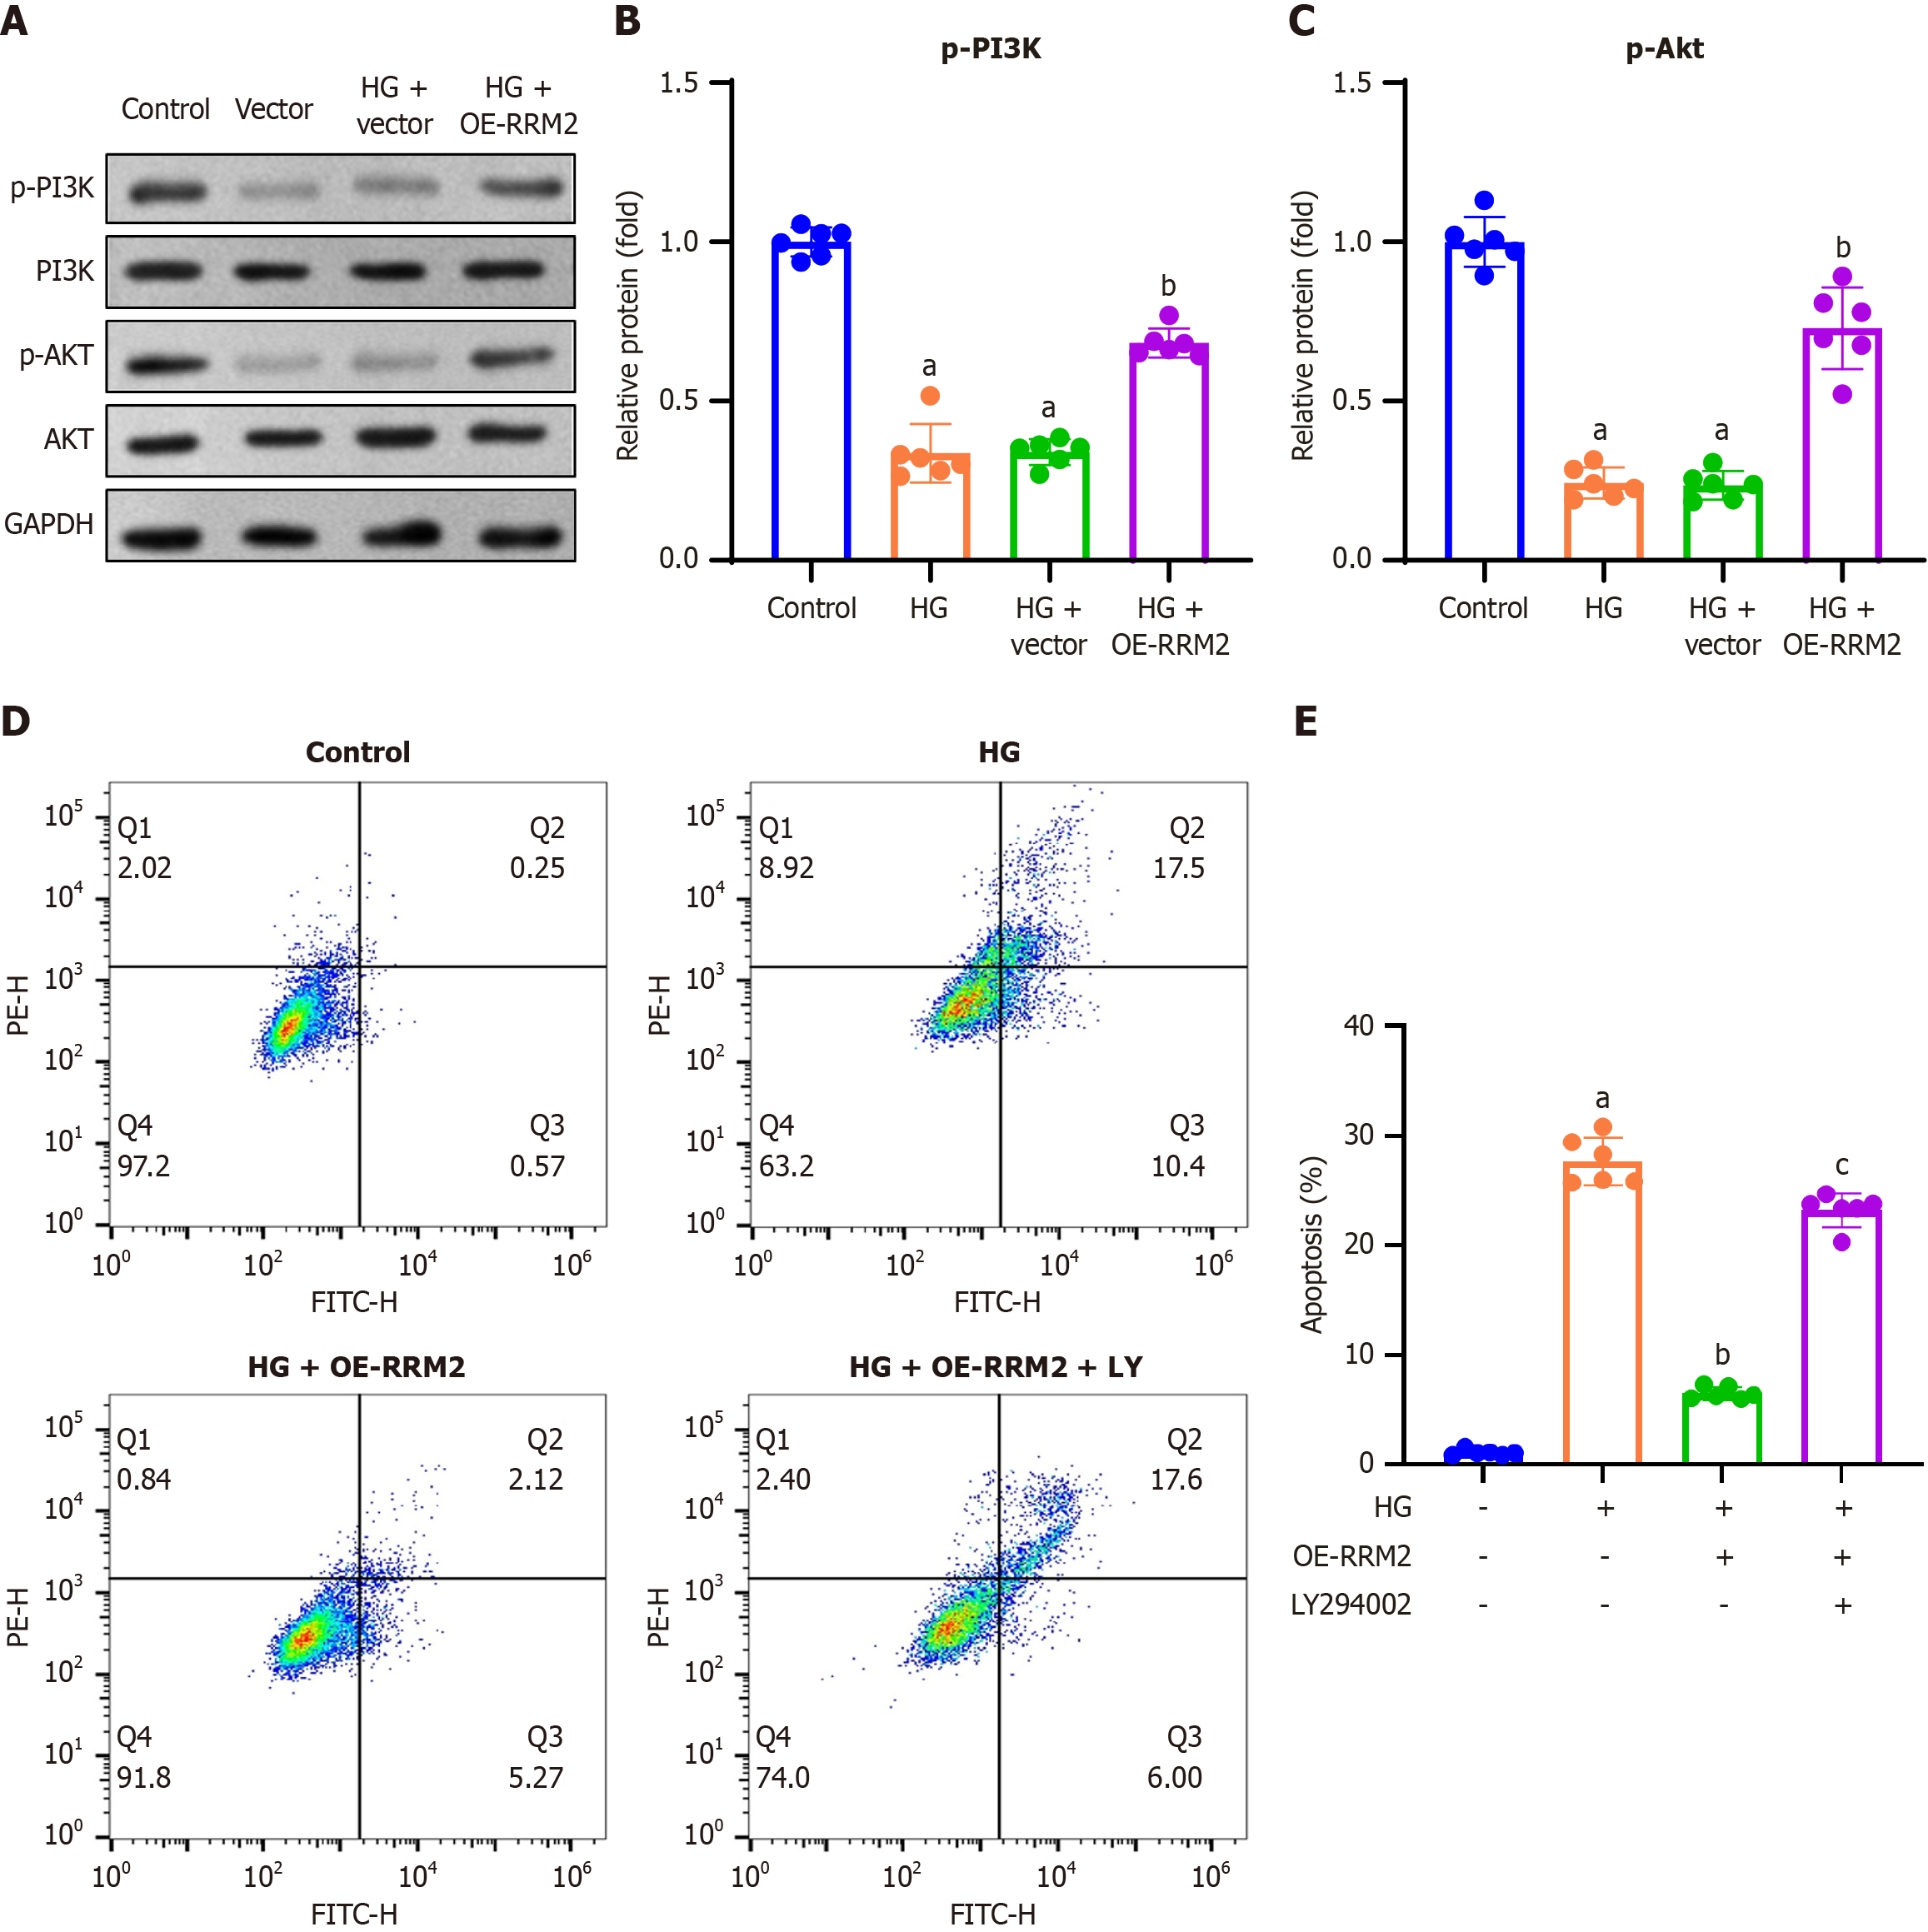
To examine the effect of RRM2 overexpression on the PI3K/Akt signaling pathway, we conducted Western blot analysis to assess the expression levels of phosphorylated PI3K and Akt. The findings indicated a reduction in p-PI3K and p-Akt expression in the HG and HG + vector groups, whereas an increase was observed in the HG + OE-RRM2 group (Figure 3A). Quantitative analysis confirmed consistent trends of p-PI3K and p-Akt expression in HG-treated HK-2 cells (Figure 3B and C).
To examine the effect of RRM2 overexpression on apoptosis, HK-2 cells were transfected with pCDH-CMV-RRM2 or an empty vector, and co-treated with the PI3K/Akt pathway inhibitor LY294002 (10 μM) and HG (30 mmol/L) for 48 hours. Apoptosis was assessed using Annexin V-FITC double staining and flow cytometry. The results demonstrated that HG treatment increased the apoptosis rate, which was reduced by HG + OE-RRM2 treatment. In contrast, treatment with the PI3K/Akt pathway inhibitor LY294002 (HG + OE-RRM2 + LY294002) restored the increased apoptotic rate (Figure 3D). The apoptotic rate was calculated by summing the number of early apoptotic cells (lower right quadrant) and late apoptotic cells (upper right quadrant), and showed consistent trends in the apoptosis rate for HG + OE-RRM2 + LY294002 treatment (Figure 3E).
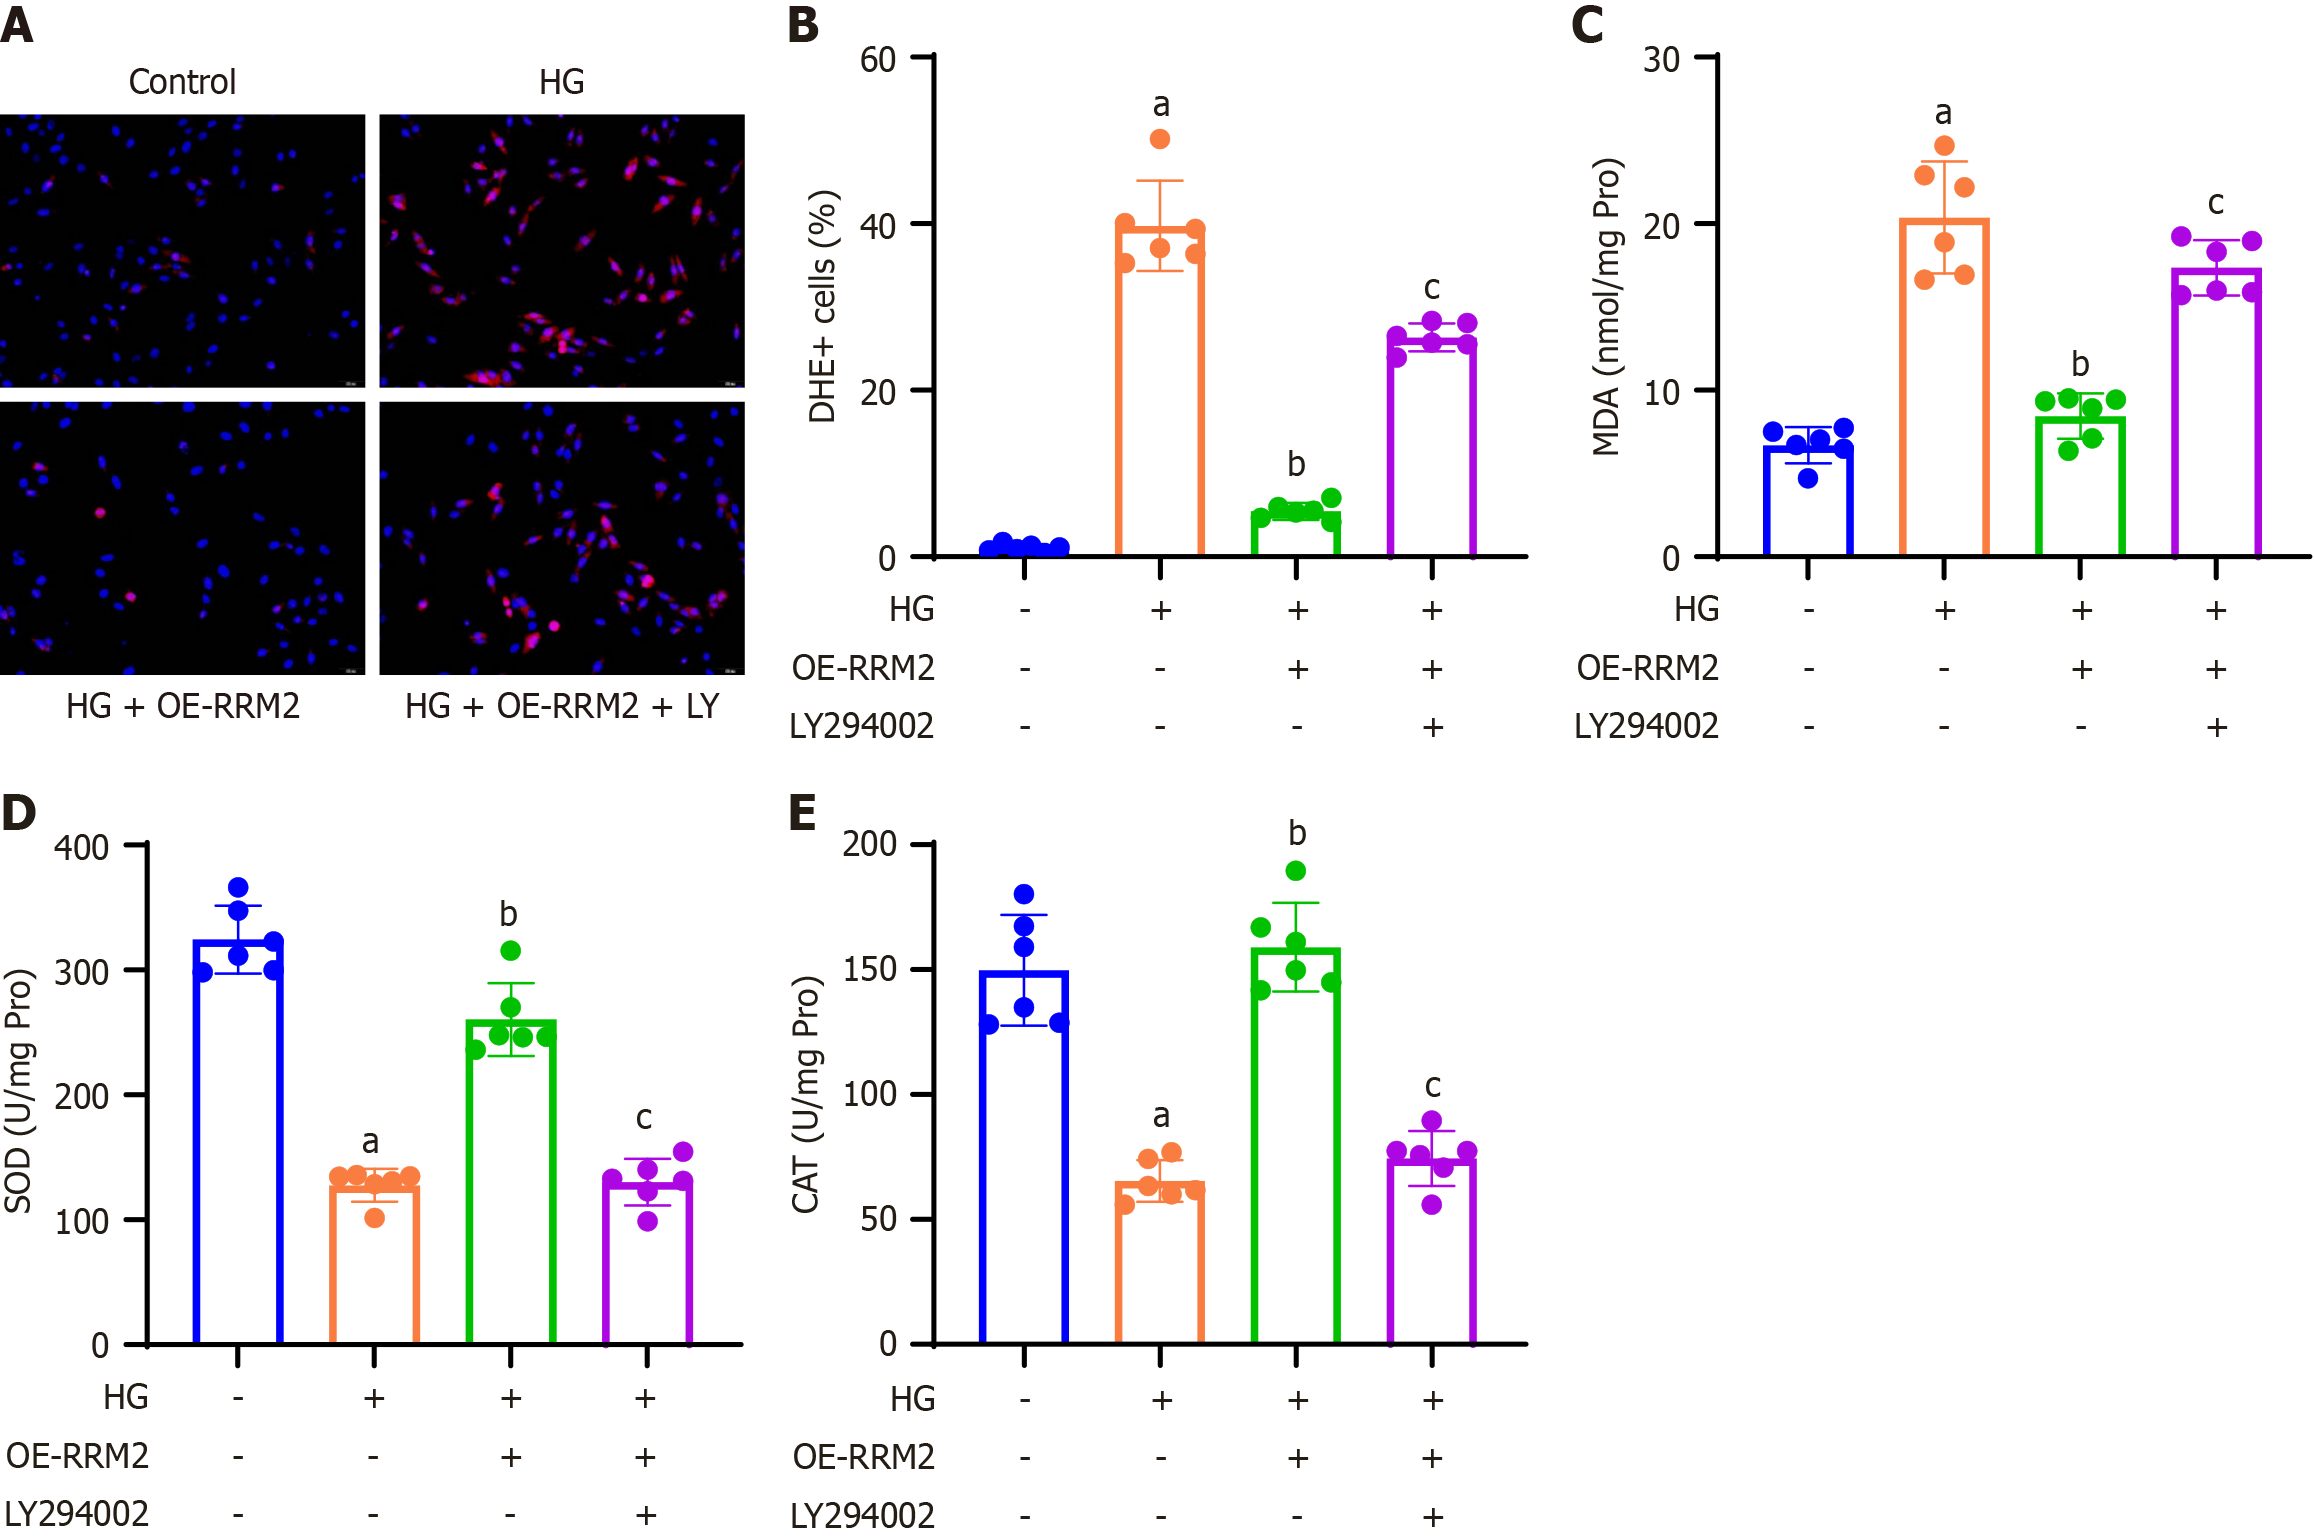
To investigate the impact of RRM2 overexpression on cellular reactive oxygen species (ROS) production and oxidative stress, HK-2 cells were subjected to DHE staining, and the proportion of DHE-positive cells relative to DAPI-positive cells was quantified. These findings revealed that HG treatment increased ROS production, which was subsequently reduced by HG + OE-RRM2 treatment. Conversely, application of the PI3K/Akt pathway inhibitor LY294002 (HG + OE-RRM2 + LY294002) restored ROS production (Figure 4A and B). A colorimetric method was used to assess oxidative stress markers in HK-2 cell lysates. The results demonstrated that HG treatment decreased SOD and CAT levels and increased MDA levels, which were reversed by HG + OE-RRM2 treatment. In contrast, treatment with the PI3K/Akt pathway inhibitor LY294002 (HG + OE-RRM2 + LY294002) restored the effects of oxidative stress (Figure 4C-E).
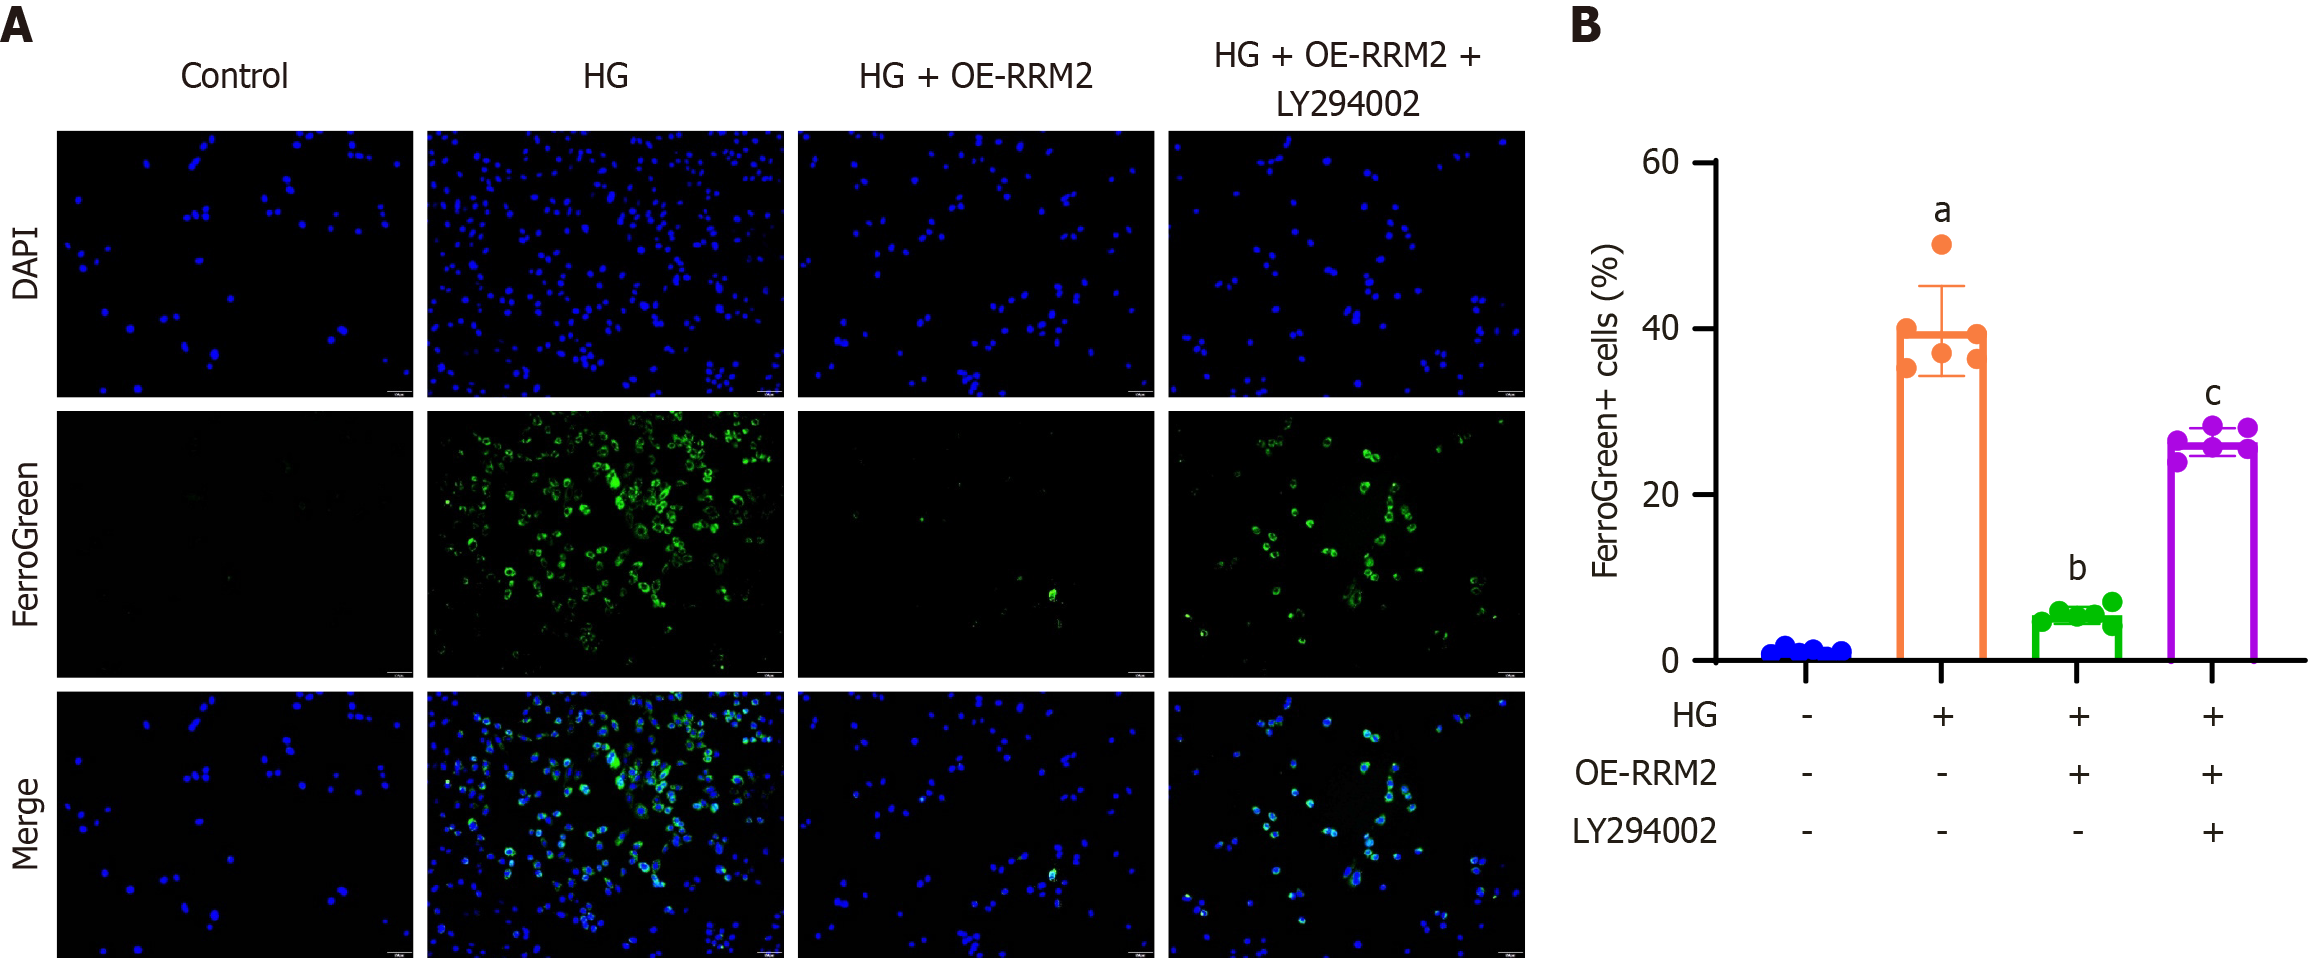
To examine the effect of RRM2 overexpression on cellular ferroptosis within the PI3K/Akt signaling pathway, HK-2 cells were stained with Mito FerroGreen to visualize mitochondrial ferrous iron, which is indicated by green fluorescence. A representative image of FerroGreen-positive cells is presented (200 × magnification) and the proportion of FerroGreen-positive cells relative to DAPI-positive cells was quantified. These findings demonstrated that HG treatment increased ferroptosis, which was mitigated by HG + OE-RRM2 treatment. Conversely, the application of the PI3K/Akt pathway inhibitor LY294002 (HG + OE-RRM2 + LY294002) restored the ferroptosis levels (Figure 5A). Quantitative analysis corroborated consistent trends in ferroptosis rates in HK-2 cells (Figure 5B).
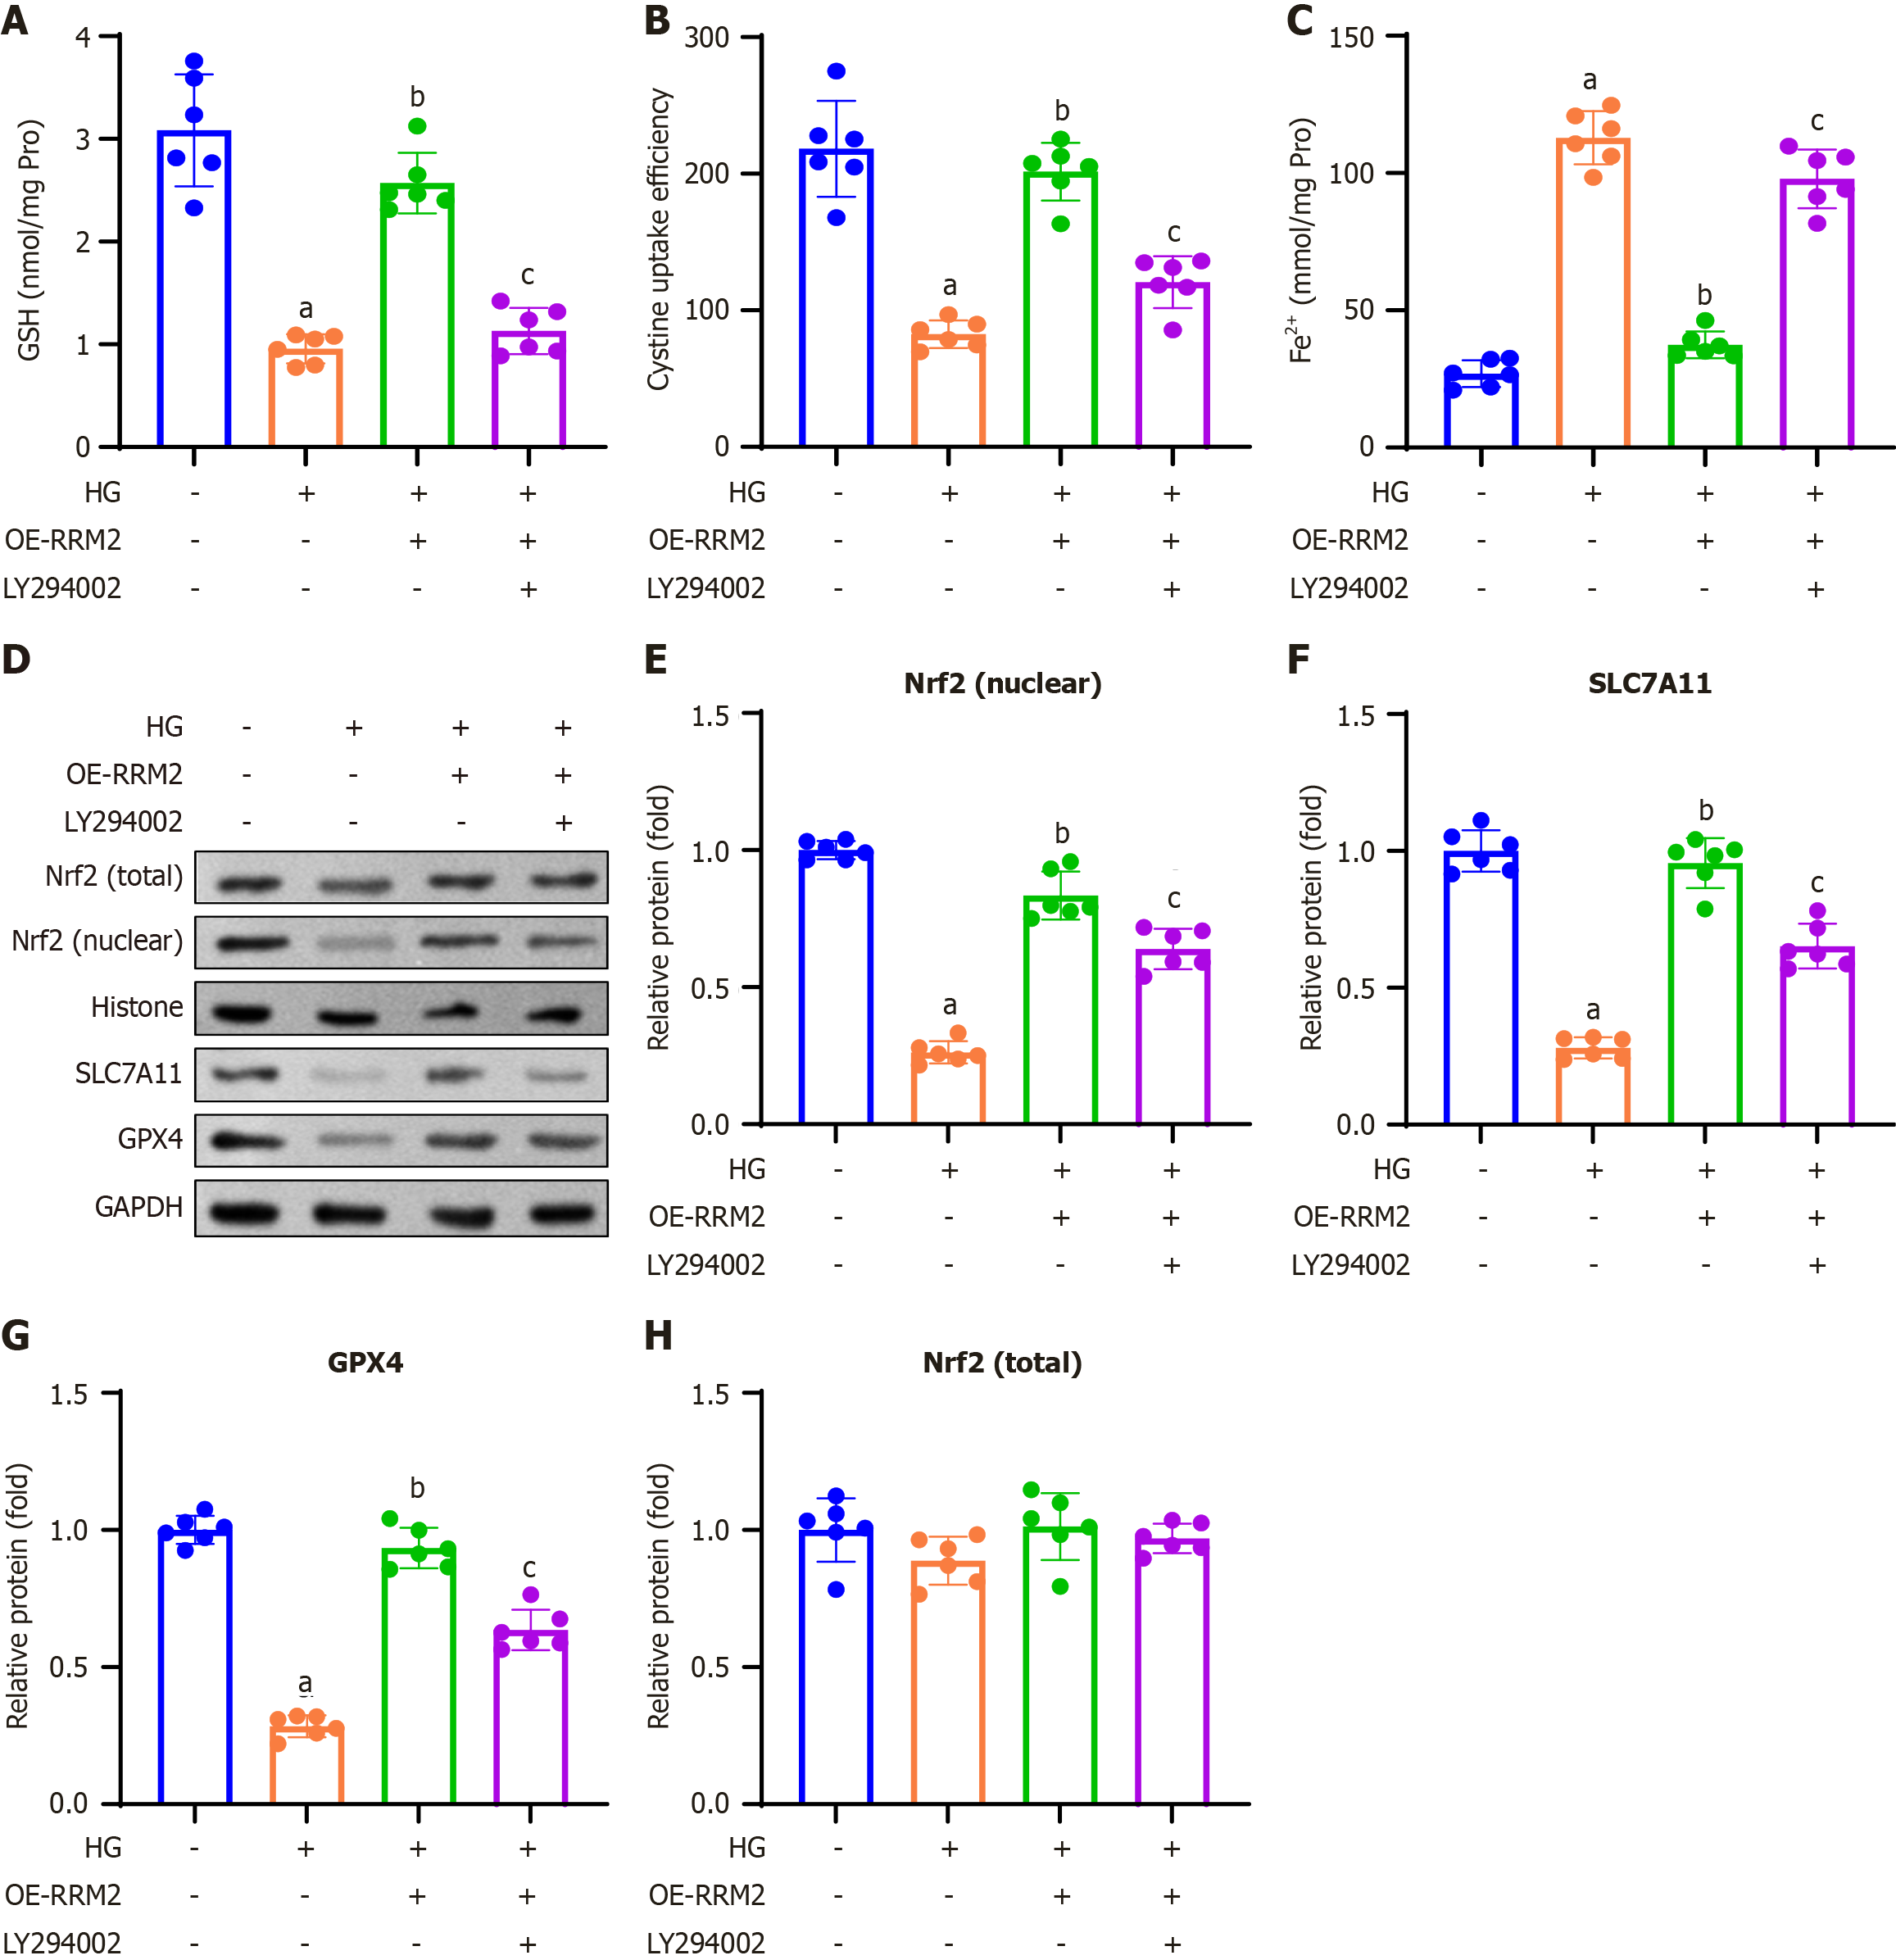
In this study, we investigated the impact of RRM2 overexpression on ferroptosis-related indicators and proteins via the PI3K/Akt signaling pathway. A colorimetric method was employed to assess GSH content, revealing that HG treatment elevated GSH levels, an effect that was attenuated by HG + OE-RRM2 treatment. Conversely, introduction of the PI3K/Akt pathway inhibitor LY294002 (HG + OE-RRM2 + LY294002) restored the elevated GSH content (Figure 6A). We also measured cystine uptake and Fe2+ concentrations in HG-treated HK-2 cells. Our findings demonstrated that HG treatment enhanced cystine uptake capacity and reduced Fe2+ concentration, and which were reversed by HG + OE-RRM2 treatment. In contrast, treatment with the PI3K/Akt pathway inhibitor LY294002 (HG + OE-RRM2 + LY294002) restored cystine uptake capacity and decreased Fe2+ concentration (Figure 6B and C).
Western blot analysis was performed to assess the expression of ferroptosis-related proteins. These results indicated that HG treatment diminished the expression of Nrf2 (nuclear), SLC7A11, and GPX4 proteins, and these effects were reversed by HG + OE-RRM2 treatment. Conversely, treatment with the PI3K/Akt pathway inhibitor LY294002 (HG + OE-RRM2 + LY294002) restored the reduced nuclear expression of Nrf2 (nuclear), SLC7A11, and GPX4 (Figure 6D). Quantitative analysis confirmed consistent trends in Nrf2 (nuclear), SLC7A11, and GPX4 protein expression in HK-2 cells (Figure 6E-G), while total Nrf2 levels remained unchanged across all groups (Figure 6H).
DKD is a significant complication frequently observed in individuals with diabetes[15]. The global prevalence of DKD is projected to reach 693 million by 2045, underscoring its status as a critical public health issue that requires urgent attention[16]. Investigating the underlying mechanisms of DKD is essential for developing novel therapeutic strategies aimed at extending the lifespan of patients with DKD. A growing body of research supports the notion that ferroptosis is a pivotal mediator of DKD progression, suggesting that targeting ferroptosis may offer a promising therapeutic approach for DKD[17].
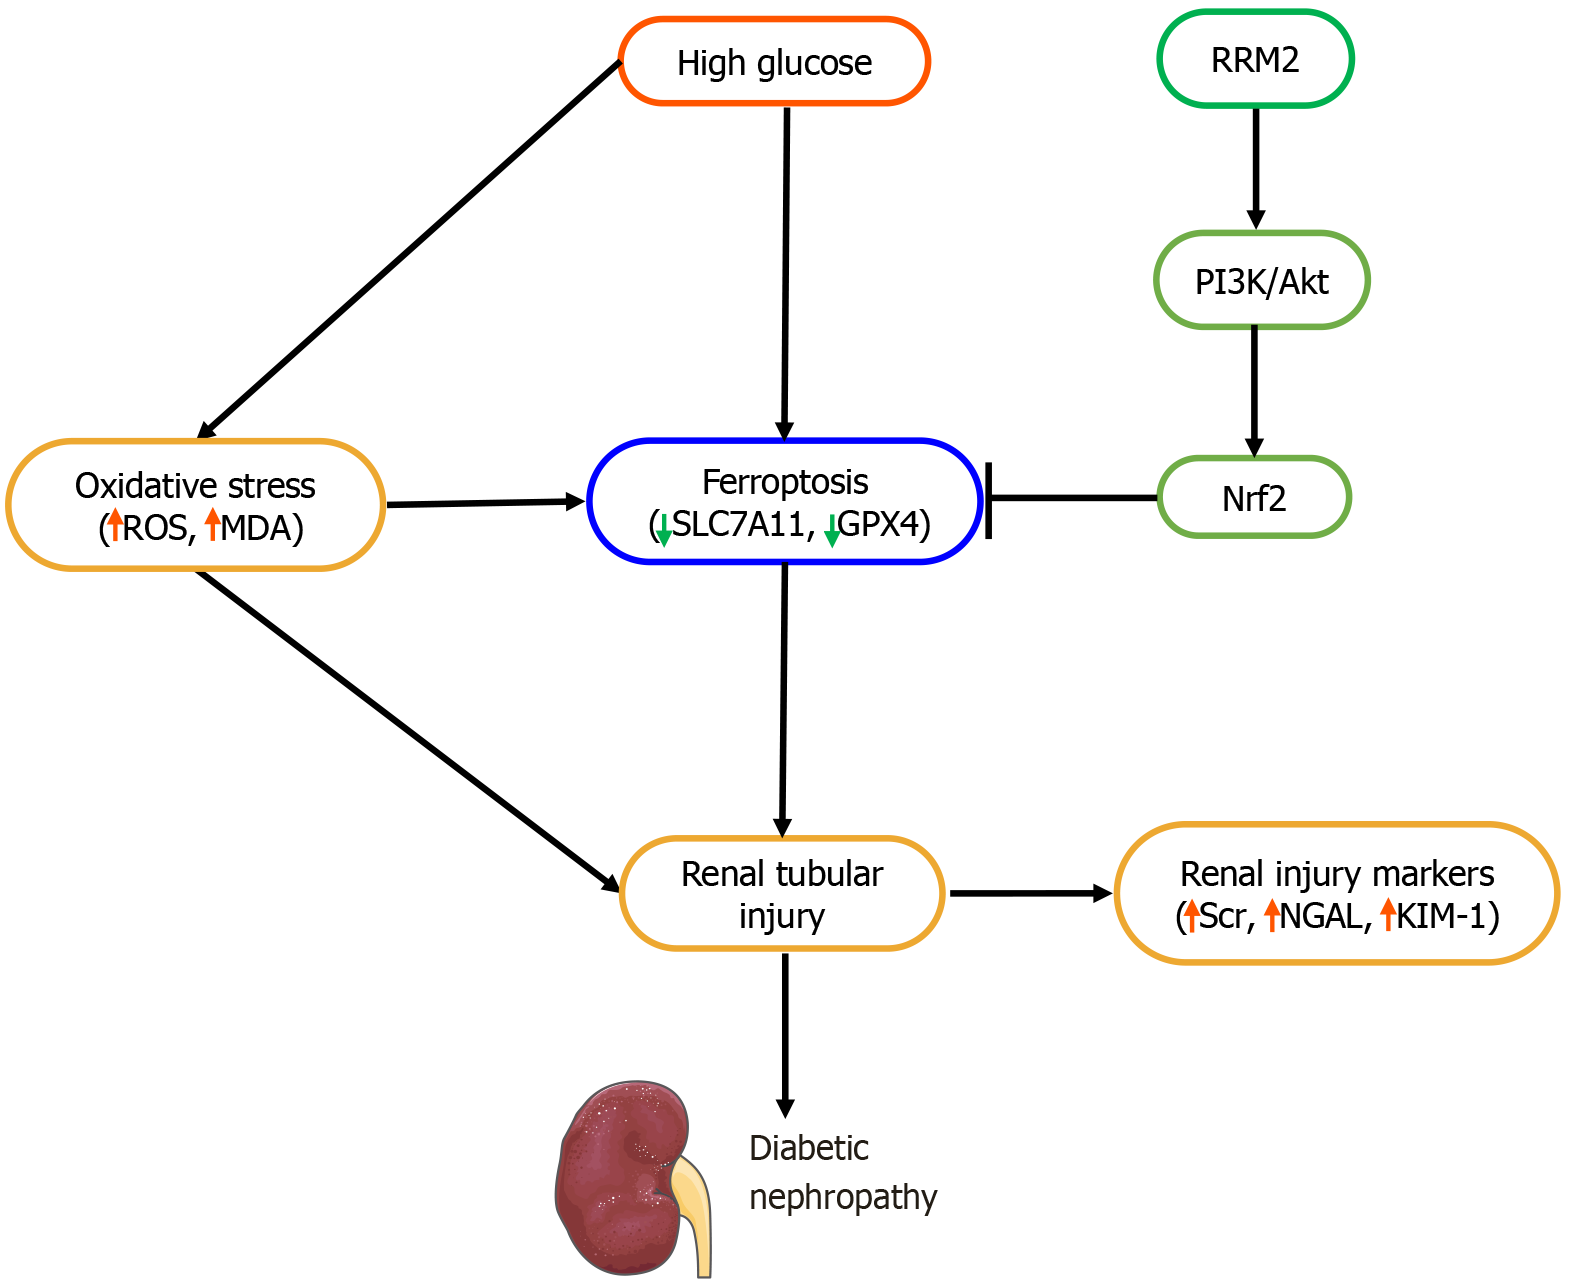
In this study, we demonstrated that RRM2 exerts a protective effect against renal tubular ferroptosis in DKD by activating the PI3K/Akt/Nrf2 signaling pathway. Ferroptosis is a recently characterized, regulated form of cell death that is mechanistically distinct from apoptosis, which involves caspase activation and DNA fragmentation, and necrosis, which is characterized by uncontrolled membrane rupture and inflammation. In contrast, ferroptosis is driven by iron-dependent lipid peroxidation, impaired antioxidant defenses, and inactivation of GPX4[18-20]. Loss of GPX4 activity, either through genetic knockout or ferroptosis agonists such as erastin or RSL3, is a hallmark of ferroptotic cell death or has been shown to trigger renal tubular epithelial injury[21,22]. Consistent with this paradigm, we found that RRM2 overexpression restored GPX4 and SLC7A11 levels, suppressed ROS accumulation, and reduced lipid peroxidation, thereby alleviating the ferroptosis.
Moreover, our results demonstrated that exposure of HK-2 cells to HG levels decreased RRM2 expression, ac
RRM2 is classically recognized as a rate-limiting subunit of RNR, which is essential for de novo DNA synthesis and repair through the conversion of ribonucleotides to deoxyribonucleotides[23,24]. Beyond this canonical role, accumulating evidence indicates that RRM2 contributes to cellular redox homeostasis. RRM2 harbors a di-iron center that generates tyrosyl radicals necessary for nucleotide reduction, and this iron-handling property may influence oxidative stress response[25]. Recent studies have shown that RRM2 can modulate GSH metabolism and ROS detoxification, thereby linking nucleotide metabolism to antioxidant defense[9,26].
Our findings support this dual role: Under high-glucose conditions, RRM2 expression was downregulated, coinciding with reduced GSH, GPX4, and SLC7A11 levels, as well as enhanced ROS and lipid peroxidation. Conversely, RRM2 overexpression restored redox balance and mitigated ferroptosis, partly by activating the PI3K/Akt/Nrf2 pathway. This suggests that RRM2 may function as a metabolic “bridge”, coupling nucleotide biosynthesis with redox regulation to protect renal tubular cells against diabetic injuries. Further studies are warranted to elucidate the intersection between RRM2 enzymatic activity in DNA synthesis and its antioxidant functions in DKD progression.
Given the central role of ferroptosis in DKD, targeting RRM2 and its downstream effectors may offer novel therapeutic opportunities for treating DKD. Previous studies have demonstrated that Nrf2 activators, such as bardoxolone methyl, confer renoprotective effects in DN[27]. Our results suggest that augmenting RRM2 expression or enhancing PI3K/Akt/Nrf2 signaling could protect renal tubular cells against ferroptosis. However, further in vivo studies are required to validate these findings in preclinical DKD models.
Our clinical data were cross-sectional and could not prove causality; longitudinal validation is required to determine whether declining RRM2 levels precede DN progression. This was a single-center study, and external validation across diverse populations is important. Mechanistically, we focused on overexpression in one cell line and used pharmacologic PI3K/Akt inhibition and genetic gain- and loss-of-function approaches (e.g., RRM2 knockdown/CRISPR, AKT isoform modulation) and rescue with ferroptosis-specific tools (erastin/RSL3/ferrostatin-1) to strengthen causal inference. The absence of osmotic control (e.g., mannitol) in our in vitro experiments limits our ability to exclude the contribution of hyperosmolarity rather than hyperglycaemia alone. Finally, while our in vitro findings consistently highlight the protective role of RRM2 in oxidative stress and ferroptosis, reconciling these results with clinical correlations, particularly regarding GSH, should be prioritized through time-course and compartment-specific assays. In future studies, additional models, including in vivo validation and multiple cell lines, will further strengthen the mechanistic evidence chain and generalizability of our findings.
This study underscores the pivotal role of RRM2 in T2DM and its renal complications, DN. Serum RRM2 Levels were significantly higher in patients with T2DM than in healthy controls but markedly reduced in those with macroalbuminuria. Clinically, RRM2 showed negative correlations with renal injury and oxidative stress markers and positive associations with antioxidant indicators. In vitro, RRM2 overexpression enhanced renal tubular cell viability, activated the PI3K/Akt signaling pathway, suppressed apoptosis, and alleviated oxidative stress and ferroptosis under HG con
| 1. | Alicic RZ, Rooney MT, Tuttle KR. Diabetic Kidney Disease: Challenges, Progress, and Possibilities. Clin J Am Soc Nephrol. 2017;12:2032-2045. [RCA] [PubMed] [DOI] [Full Text] [Cited by in Crossref: 1257] [Cited by in RCA: 1963] [Article Influence: 218.1] [Reference Citation Analysis (0)] |
| 2. | Tang C, Livingston MJ, Liu Z, Dong Z. Autophagy in kidney homeostasis and disease. Nat Rev Nephrol. 2020;16:489-508. [RCA] [PubMed] [DOI] [Full Text] [Cited by in Crossref: 204] [Cited by in RCA: 391] [Article Influence: 65.2] [Reference Citation Analysis (0)] |
| 3. | Wu Y, Chen Y. Research progress on ferroptosis in diabetic kidney disease. Front Endocrinol (Lausanne). 2022;13:945976. [RCA] [PubMed] [DOI] [Full Text] [Full Text (PDF)] [Cited by in RCA: 37] [Reference Citation Analysis (0)] |
| 4. | Dodson M, Castro-Portuguez R, Zhang DD. NRF2 plays a critical role in mitigating lipid peroxidation and ferroptosis. Redox Biol. 2019;23:101107. [RCA] [PubMed] [DOI] [Full Text] [Full Text (PDF)] [Cited by in Crossref: 1085] [Cited by in RCA: 1771] [Article Influence: 253.0] [Reference Citation Analysis (0)] |
| 5. | Huang H, Liu Y, Xu Z, Zhang D, Feng M, Zhao T, Zhang L, Li W, Li X. Effect of fucoidan on kidney injury in type 2 diabetic rats based on PI3K/AKT/Nrf2. J Funct Foods. 2022;90:104976. [RCA] [DOI] [Full Text] [Cited by in RCA: 4] [Reference Citation Analysis (0)] |
| 6. | Mengstie MA, Seid MA, Gebeyehu NA, Adella GA, Kassie GA, Bayih WA, Gesese MM, Anley DT, Feleke SF, Zemene MA, Dessie AM, Solomon Y, Bantie B, Dejenie TA, Teshome AA, Abebe EC. Ferroptosis in diabetic nephropathy: Mechanisms and therapeutic implications. Metabol Open. 2023;18:100243. [RCA] [PubMed] [DOI] [Full Text] [Full Text (PDF)] [Cited by in RCA: 23] [Reference Citation Analysis (0)] |
| 7. | Deng Q, Zhu Y, Zhang M, Fei A, Liang J, Zheng J, Zhang Q, Cheng T, Ge X. Ferroptosis as a potential new therapeutic target for diabetes and its complications. Endocr Connect. 2023;12:e220419. [RCA] [PubMed] [DOI] [Full Text] [Cited by in Crossref: 6] [Cited by in RCA: 18] [Article Influence: 6.0] [Reference Citation Analysis (0)] |
| 8. | Shan J, Wang Z, Mo Q, Long J, Fan Y, Cheng L, Zhang T, Liu X, Wang X. Ribonucleotide reductase M2 subunit silencing suppresses tumorigenesis in pancreatic cancer via inactivation of PI3K/AKT/mTOR pathway. Pancreatology. 2022;22:401-413. [RCA] [PubMed] [DOI] [Full Text] [Cited by in Crossref: 4] [Cited by in RCA: 13] [Article Influence: 3.3] [Reference Citation Analysis (0)] |
| 9. | Yang Y, Lin J, Guo S, Xue X, Wang Y, Qiu S, Cui J, Ma L, Zhang X, Wang J. RRM2 protects against ferroptosis and is a tumor biomarker for liver cancer. Cancer Cell Int. 2020;20:587. [RCA] [PubMed] [DOI] [Full Text] [Full Text (PDF)] [Cited by in Crossref: 35] [Cited by in RCA: 117] [Article Influence: 19.5] [Reference Citation Analysis (0)] |
| 10. | Hao F, Zhang S. Correlation between serum IL-22 and IL-27 levels and vasculopathy in diabetic nephropathy patients. Am J Transl Res. 2024;16:5659-5666. [RCA] [PubMed] [DOI] [Full Text] [Cited by in RCA: 3] [Reference Citation Analysis (0)] |
| 11. | Smith-Clerc J, Hinz B. Immunofluorescence detection of the cytoskeleton and extracellular matrix in tissue and cultured cells. Methods Mol Biol. 2010;611:43-57. [RCA] [PubMed] [DOI] [Full Text] [Cited by in Crossref: 18] [Cited by in RCA: 20] [Article Influence: 1.3] [Reference Citation Analysis (0)] |
| 12. | Peiyao R, Xueli M, Wenbo S, Danna Z, Jianguang G, Juan J, Qiang H. High glucose induces podocyte ferroptosis through BAP1/SLC7A11 pathway. Heliyon. 2025;11:e40590. [RCA] [PubMed] [DOI] [Full Text] [Full Text (PDF)] [Cited by in RCA: 6] [Reference Citation Analysis (0)] |
| 13. | Han Q, Shi J, Yu Y, Yuan H, Guo Y, Liu X, Xue Y, Li Y. Calycosin alleviates ferroptosis and attenuates doxorubicin-induced myocardial injury via the Nrf2/SLC7A11/GPX4 signaling pathway. Front Pharmacol. 2024;15:1497733. [RCA] [PubMed] [DOI] [Full Text] [Cited by in RCA: 19] [Reference Citation Analysis (0)] |
| 14. | Livak KJ, Schmittgen TD. Analysis of relative gene expression data using real-time quantitative PCR and the 2(-Delta Delta C(T)) Method. Methods. 2001;25:402-408. [RCA] [PubMed] [DOI] [Full Text] [Cited by in Crossref: 149116] [Cited by in RCA: 138815] [Article Influence: 5552.6] [Reference Citation Analysis (2)] |
| 15. | Forbes JM, Thorburn DR. Mitochondrial dysfunction in diabetic kidney disease. Nat Rev Nephrol. 2018;14:291-312. [RCA] [PubMed] [DOI] [Full Text] [Cited by in Crossref: 194] [Cited by in RCA: 466] [Article Influence: 58.3] [Reference Citation Analysis (0)] |
| 16. | Fineberg D, Jandeleit-Dahm KA, Cooper ME. Diabetic nephropathy: diagnosis and treatment. Nat Rev Endocrinol. 2013;9:713-723. [RCA] [PubMed] [DOI] [Full Text] [Cited by in Crossref: 178] [Cited by in RCA: 227] [Article Influence: 17.5] [Reference Citation Analysis (0)] |
| 17. | Tang S, Xiao X. Ferroptosis and kidney diseases. Int Urol Nephrol. 2020;52:497-503. [RCA] [PubMed] [DOI] [Full Text] [Cited by in Crossref: 23] [Cited by in RCA: 51] [Article Influence: 7.3] [Reference Citation Analysis (0)] |
| 18. | Dixon SJ, Lemberg KM, Lamprecht MR, Skouta R, Zaitsev EM, Gleason CE, Patel DN, Bauer AJ, Cantley AM, Yang WS, Morrison B 3rd, Stockwell BR. Ferroptosis: an iron-dependent form of nonapoptotic cell death. Cell. 2012;149:1060-1072. [RCA] [PubMed] [DOI] [Full Text] [Cited by in Crossref: 4711] [Cited by in RCA: 13257] [Article Influence: 946.9] [Reference Citation Analysis (2)] |
| 19. | Stockwell BR, Friedmann Angeli JP, Bayir H, Bush AI, Conrad M, Dixon SJ, Fulda S, Gascón S, Hatzios SK, Kagan VE, Noel K, Jiang X, Linkermann A, Murphy ME, Overholtzer M, Oyagi A, Pagnussat GC, Park J, Ran Q, Rosenfeld CS, Salnikow K, Tang D, Torti FM, Torti SV, Toyokuni S, Woerpel KA, Zhang DD. Ferroptosis: A Regulated Cell Death Nexus Linking Metabolism, Redox Biology, and Disease. Cell. 2017;171:273-285. [RCA] [PubMed] [DOI] [Full Text] [Cited by in Crossref: 4608] [Cited by in RCA: 5510] [Article Influence: 612.2] [Reference Citation Analysis (0)] |
| 20. | Jiang X, Stockwell BR, Conrad M. Ferroptosis: mechanisms, biology and role in disease. Nat Rev Mol Cell Biol. 2021;22:266-282. [RCA] [PubMed] [DOI] [Full Text] [Cited by in Crossref: 2184] [Cited by in RCA: 5239] [Article Influence: 1047.8] [Reference Citation Analysis (0)] |
| 21. | Friedmann Angeli JP, Schneider M, Proneth B, Tyurina YY, Tyurin VA, Hammond VJ, Herbach N, Aichler M, Walch A, Eggenhofer E, Basavarajappa D, Rådmark O, Kobayashi S, Seibt T, Beck H, Neff F, Esposito I, Wanke R, Förster H, Yefremova O, Heinrichmeyer M, Bornkamm GW, Geissler EK, Thomas SB, Stockwell BR, O'Donnell VB, Kagan VE, Schick JA, Conrad M. Inactivation of the ferroptosis regulator Gpx4 triggers acute renal failure in mice. Nat Cell Biol. 2014;16:1180-1191. [RCA] [PubMed] [DOI] [Full Text] [Cited by in Crossref: 1321] [Cited by in RCA: 2859] [Article Influence: 238.3] [Reference Citation Analysis (0)] |
| 22. | Linkermann A, Skouta R, Himmerkus N, Mulay SR, Dewitz C, De Zen F, Prokai A, Zuchtriegel G, Krombach F, Welz PS, Weinlich R, Vanden Berghe T, Vandenabeele P, Pasparakis M, Bleich M, Weinberg JM, Reichel CA, Bräsen JH, Kunzendorf U, Anders HJ, Stockwell BR, Green DR, Krautwald S. Synchronized renal tubular cell death involves ferroptosis. Proc Natl Acad Sci. U S A 2014;111:16836-16841. [RCA] [PubMed] [DOI] [Full Text] [Cited by in Crossref: 561] [Cited by in RCA: 927] [Article Influence: 77.3] [Reference Citation Analysis (0)] |
| 23. | Jordan A, Reichard P. Ribonucleotide reductases. Annu Rev Biochem. 1998;67:71-98. [RCA] [PubMed] [DOI] [Full Text] [Cited by in Crossref: 588] [Cited by in RCA: 568] [Article Influence: 20.3] [Reference Citation Analysis (0)] |
| 24. | Nordlund P, Reichard P. Ribonucleotide reductases. Annu Rev Biochem. 2006;75:681-706. [RCA] [PubMed] [DOI] [Full Text] [Cited by in Crossref: 821] [Cited by in RCA: 882] [Article Influence: 44.1] [Reference Citation Analysis (0)] |
| 25. | Thelander L, Gräslund A. Mechanism of inhibition of mammalian ribonucleotide reductase by the iron chelate of 1-formylisoquinoline thiosemicarbazone. Destruction of the tyrosine free radical of the enzyme in an oxygen-requiring reaction. J Biol Chem. 1983;258:4063-4066. [PubMed] |
| 26. | Zuo Z, Zhou Z, Chang Y, Liu Y, Shen Y, Li Q, Zhang L. Ribonucleotide reductase M2 (RRM2): Regulation, function and targeting strategy in human cancer. Genes Dis. 2024;11:218-233. [RCA] [PubMed] [DOI] [Full Text] [Full Text (PDF)] [Cited by in RCA: 77] [Reference Citation Analysis (10)] |
| 27. | Pergola PE, Raskin P, Toto RD, Meyer CJ, Huff JW, Grossman EB, Krauth M, Ruiz S, Audhya P, Christ-Schmidt H, Wittes J, Warnock DG; BEAM Study Investigators. Bardoxolone methyl and kidney function in CKD with type 2 diabetes. N Engl J Med. 2011;365:327-336. [RCA] [PubMed] [DOI] [Full Text] [Cited by in Crossref: 669] [Cited by in RCA: 728] [Article Influence: 48.5] [Reference Citation Analysis (0)] |
Open Access: This article is an open-access article that was selected by an in-house editor and fully peer-reviewed by external reviewers. It is distributed in accordance with the Creative Commons Attribution NonCommercial (CC BY-NC 4.0) license, which permits others to distribute, remix, adapt, build upon this work non-commercially, and license their derivative works on different terms, provided the original work is properly cited and the use is non-commercial. See: https://creativecommons.org/Licenses/by-nc/4.0/


