Copyright
©The Author(s) 2025.
World J Diabetes. Sep 15, 2025; 16(9): 110183
Published online Sep 15, 2025. doi: 10.4239/wjd.v16.i9.110183
Published online Sep 15, 2025. doi: 10.4239/wjd.v16.i9.110183
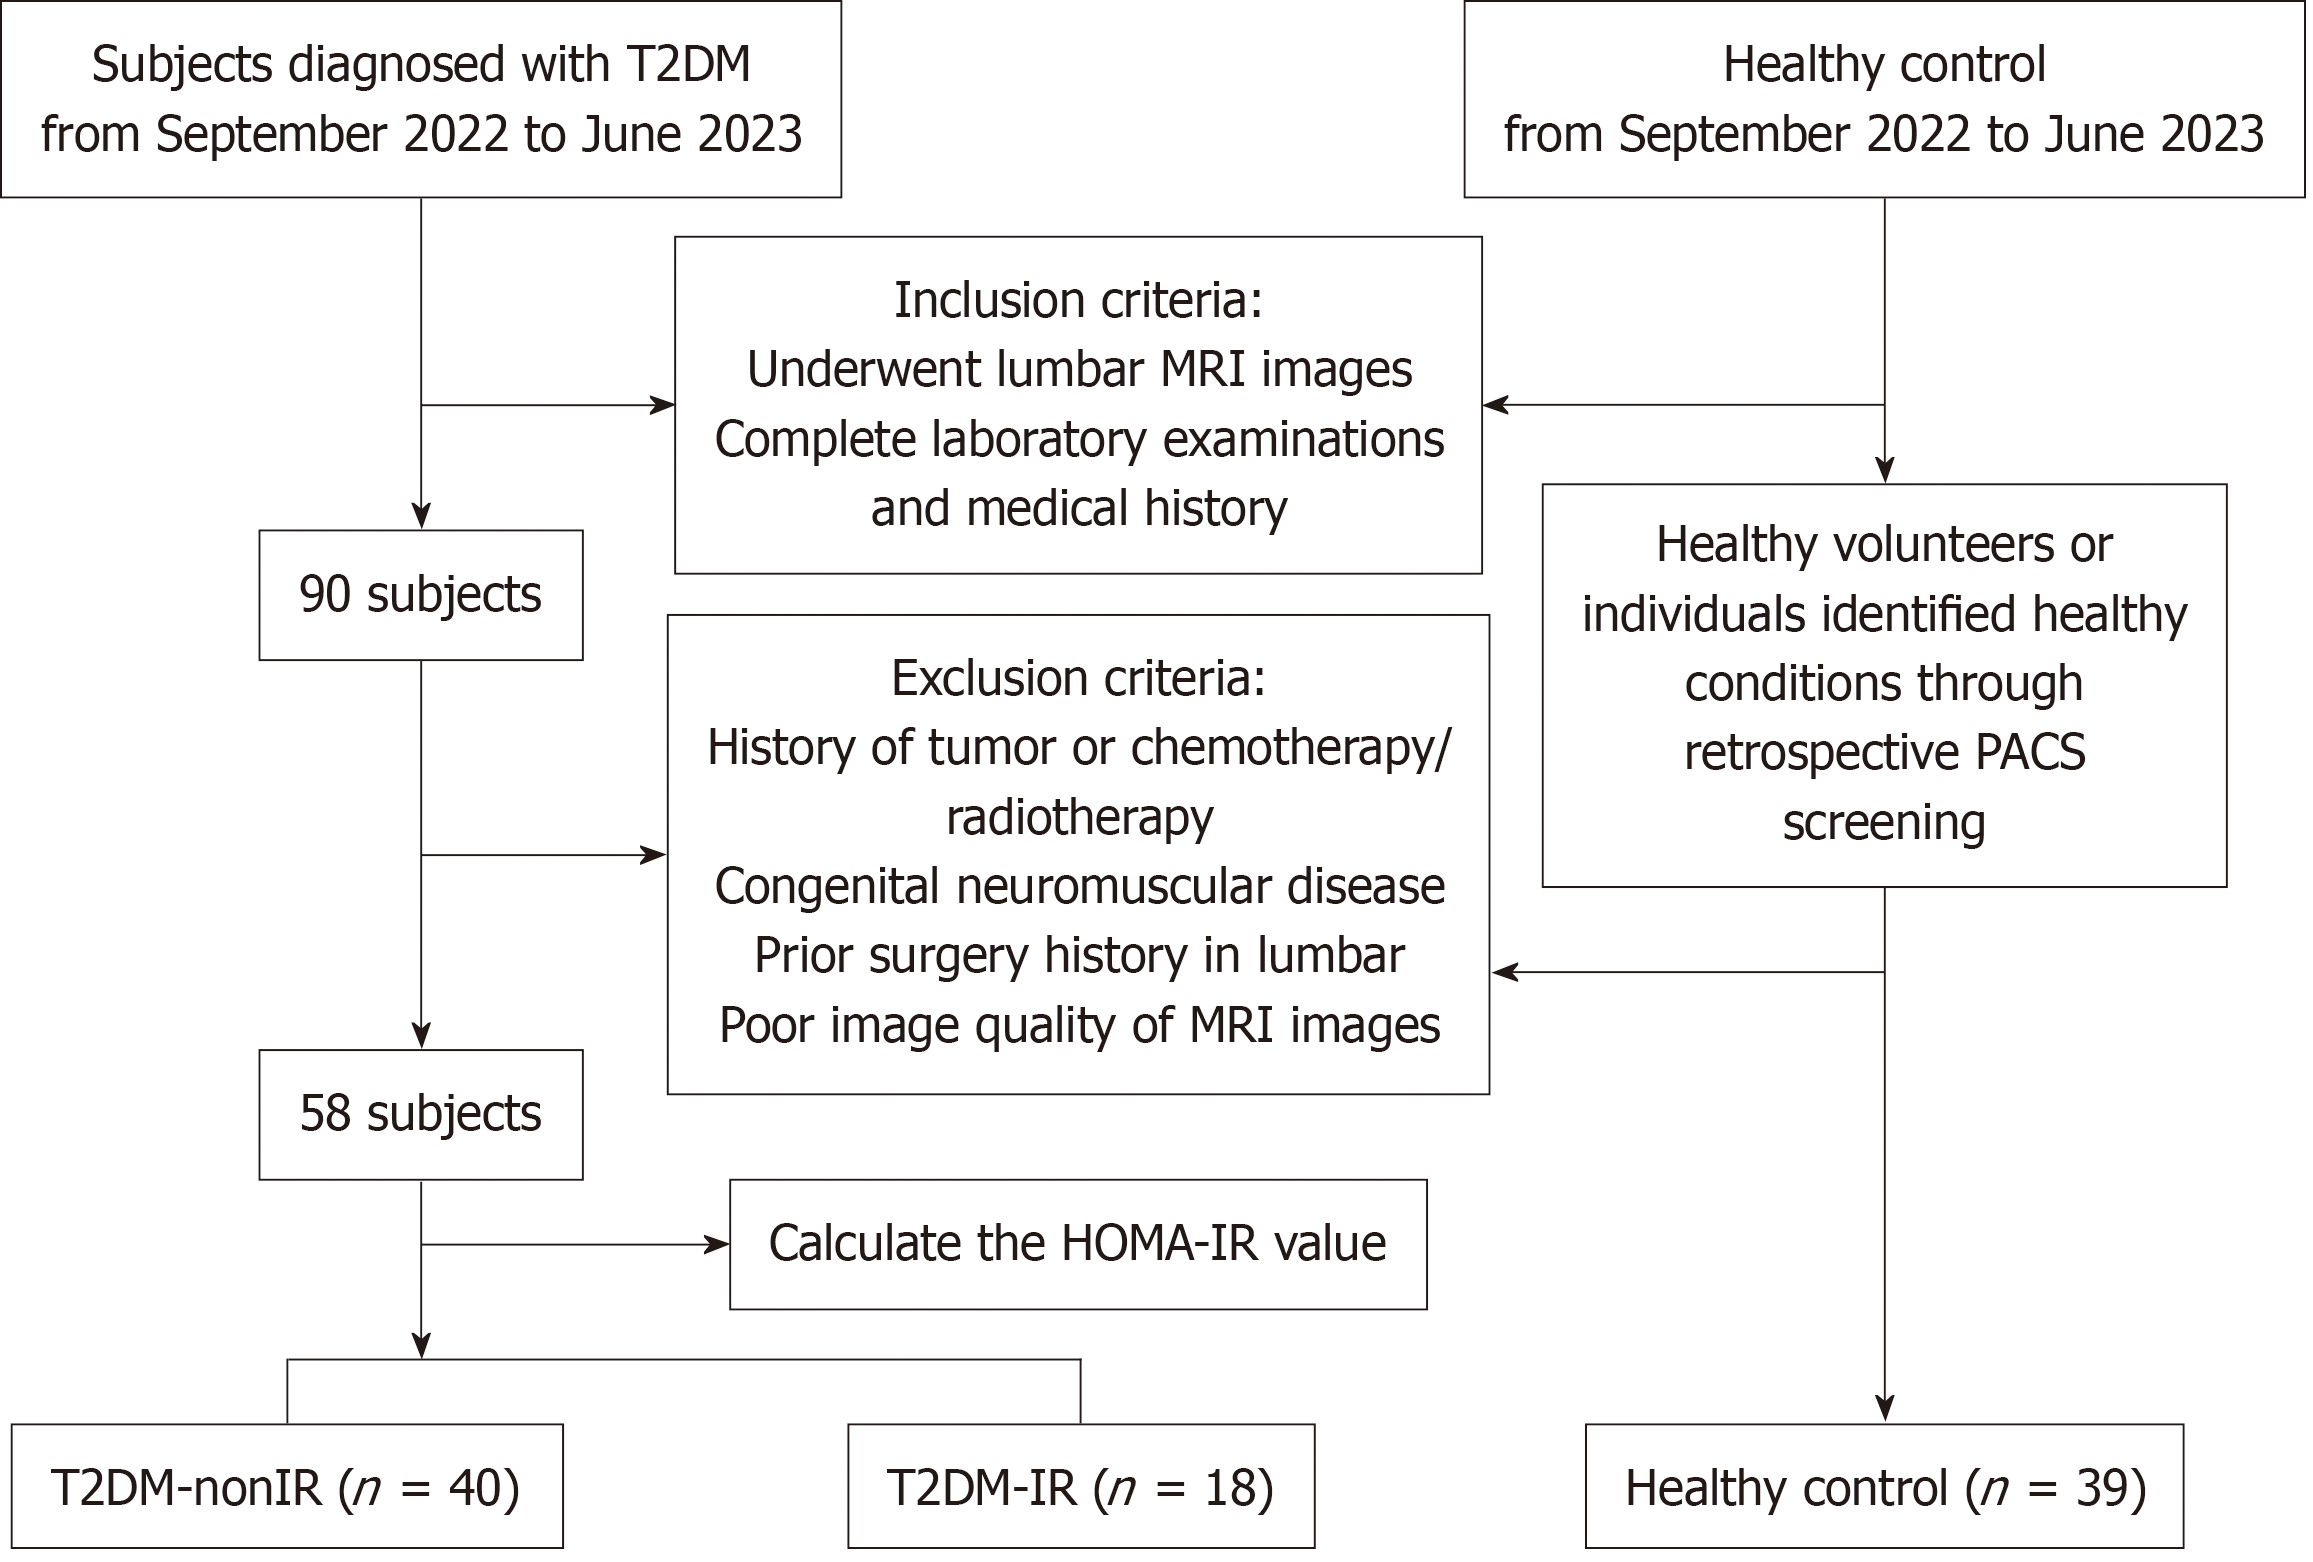
Figure 1 Flowchart of subject recruitment.
T2DM: Type 2 diabetes mellitus; IR: Insulin resistance; MRI: Magnetic resonance imaging; HOMA: Homeostatic Model Assessment; PACS: Picture archiving and communication system.
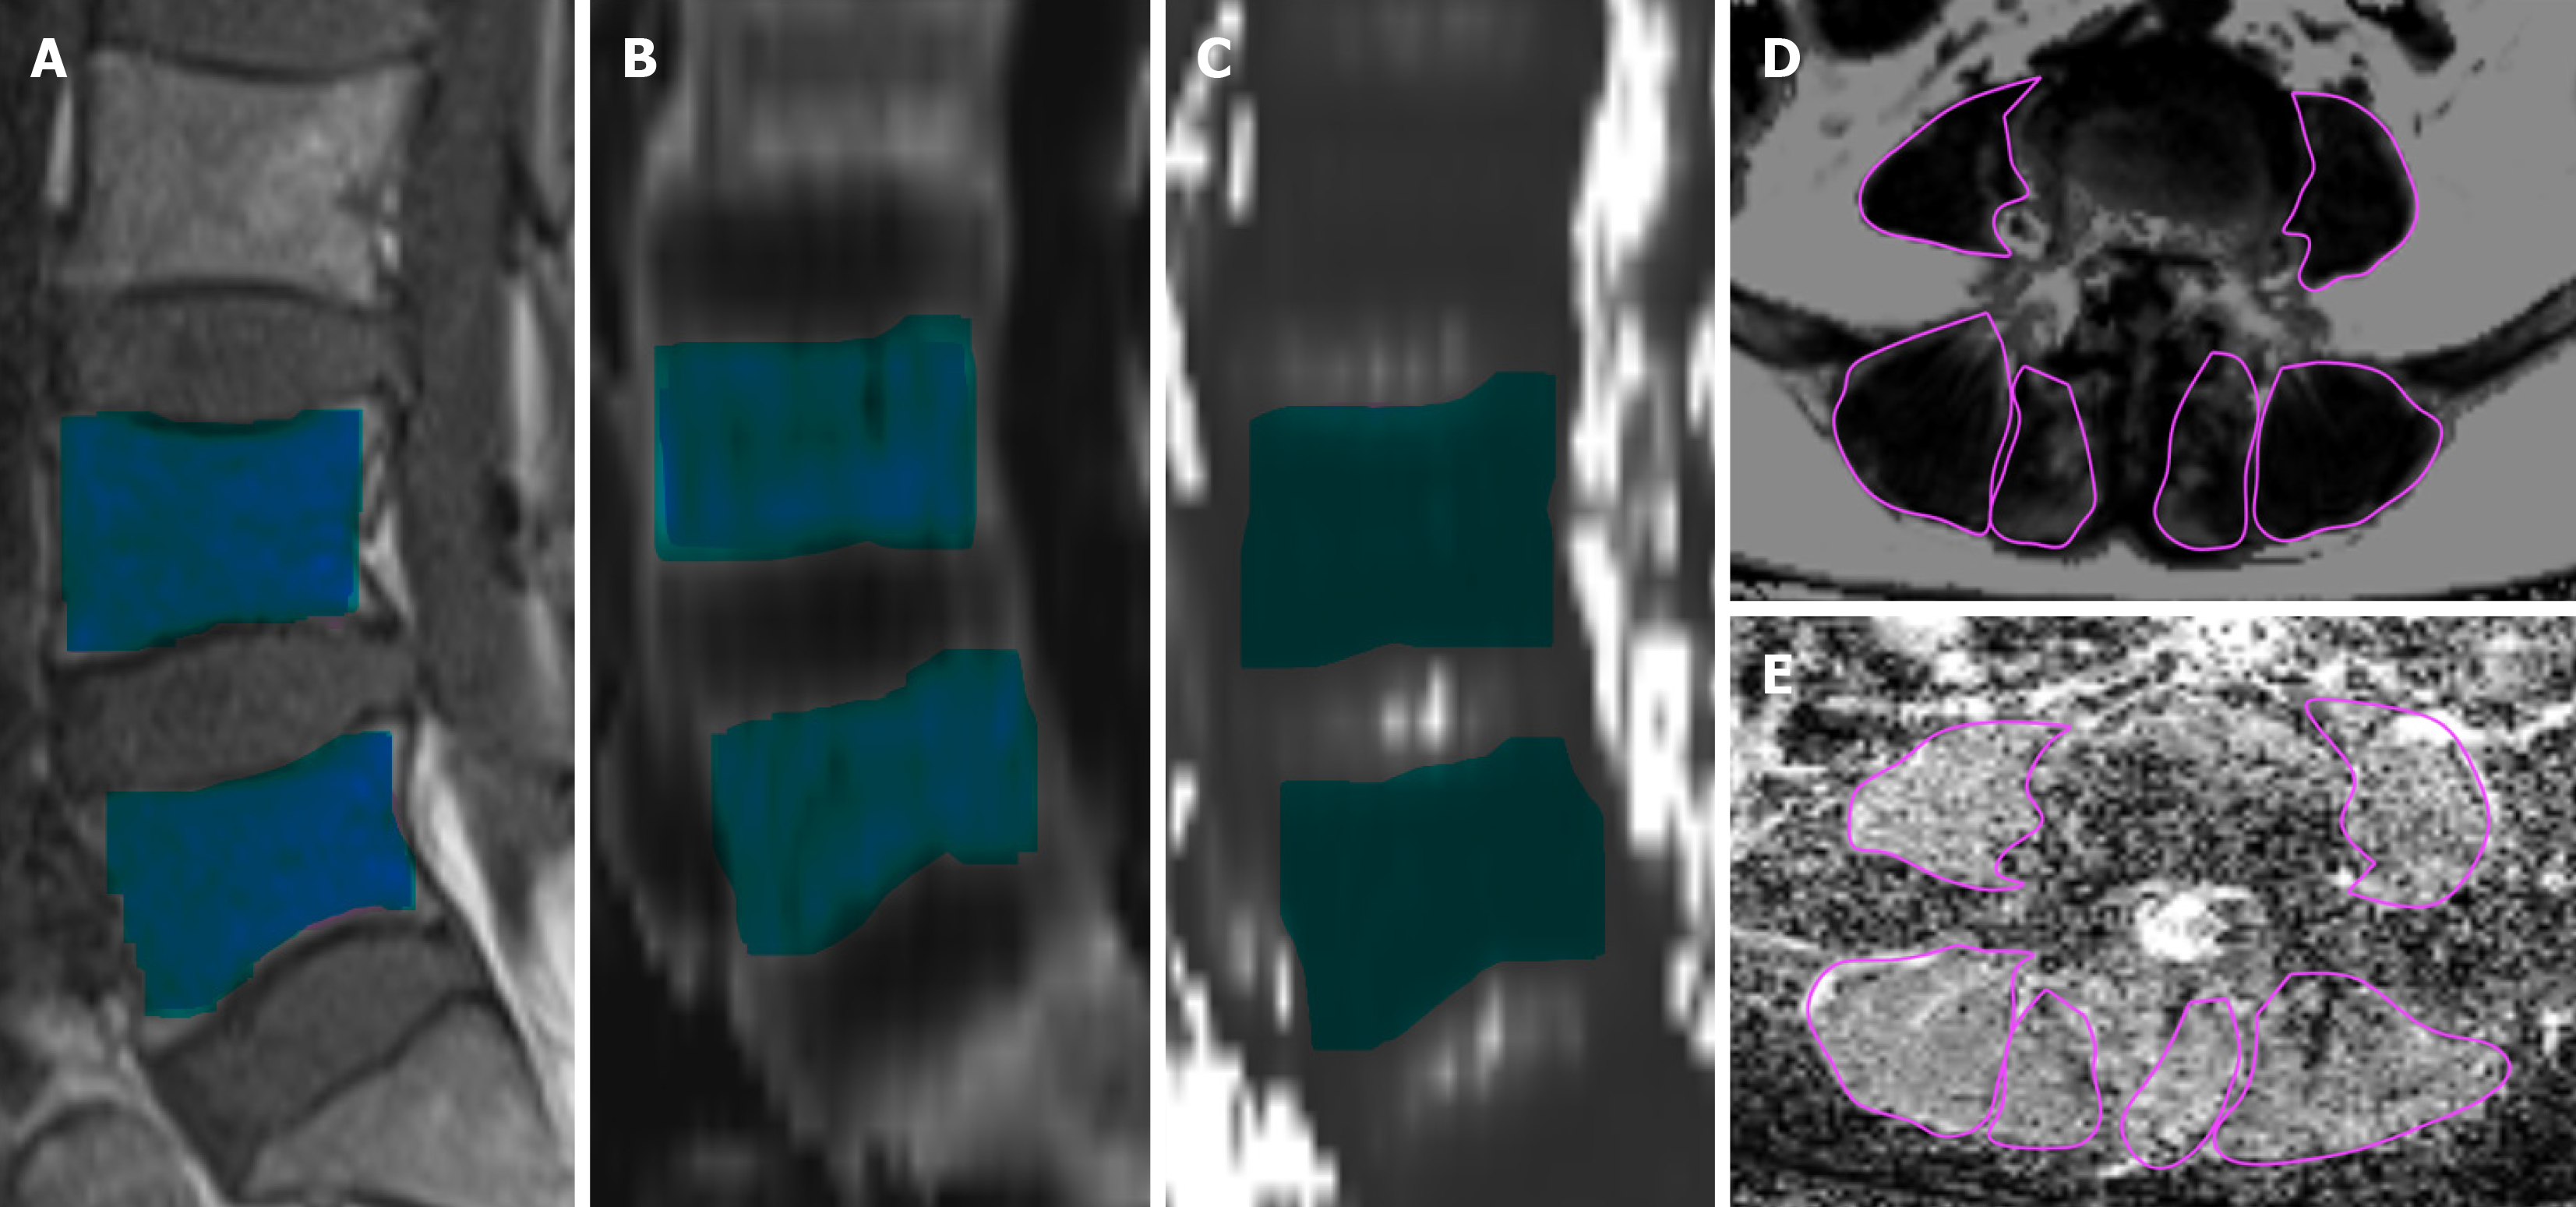
Figure 2 Illustrations of the measurements.
Blue squares represent the regions of interest in L4 and L5 vertebrae, and purple regions represent the paravertebral muscles. A: Sagittal T1-weighted imaging; B: R2* maps; C: T2* maps; D: Fat fraction; E: Diffusion tensor imaging.
Figure 3 Violin and box plots of vertebra feature distribution.
A: L4 fat fraction; B: L5 fat fraction; C: L4 T2*; D: L5 T2*; E: L4 R2*; F: L5 R2*. Group 0: Control; Group 1: Type 2 diabetes mellitus without insulin resistance; Group 2: Type 2 diabetes mellitus with insulin resistance.
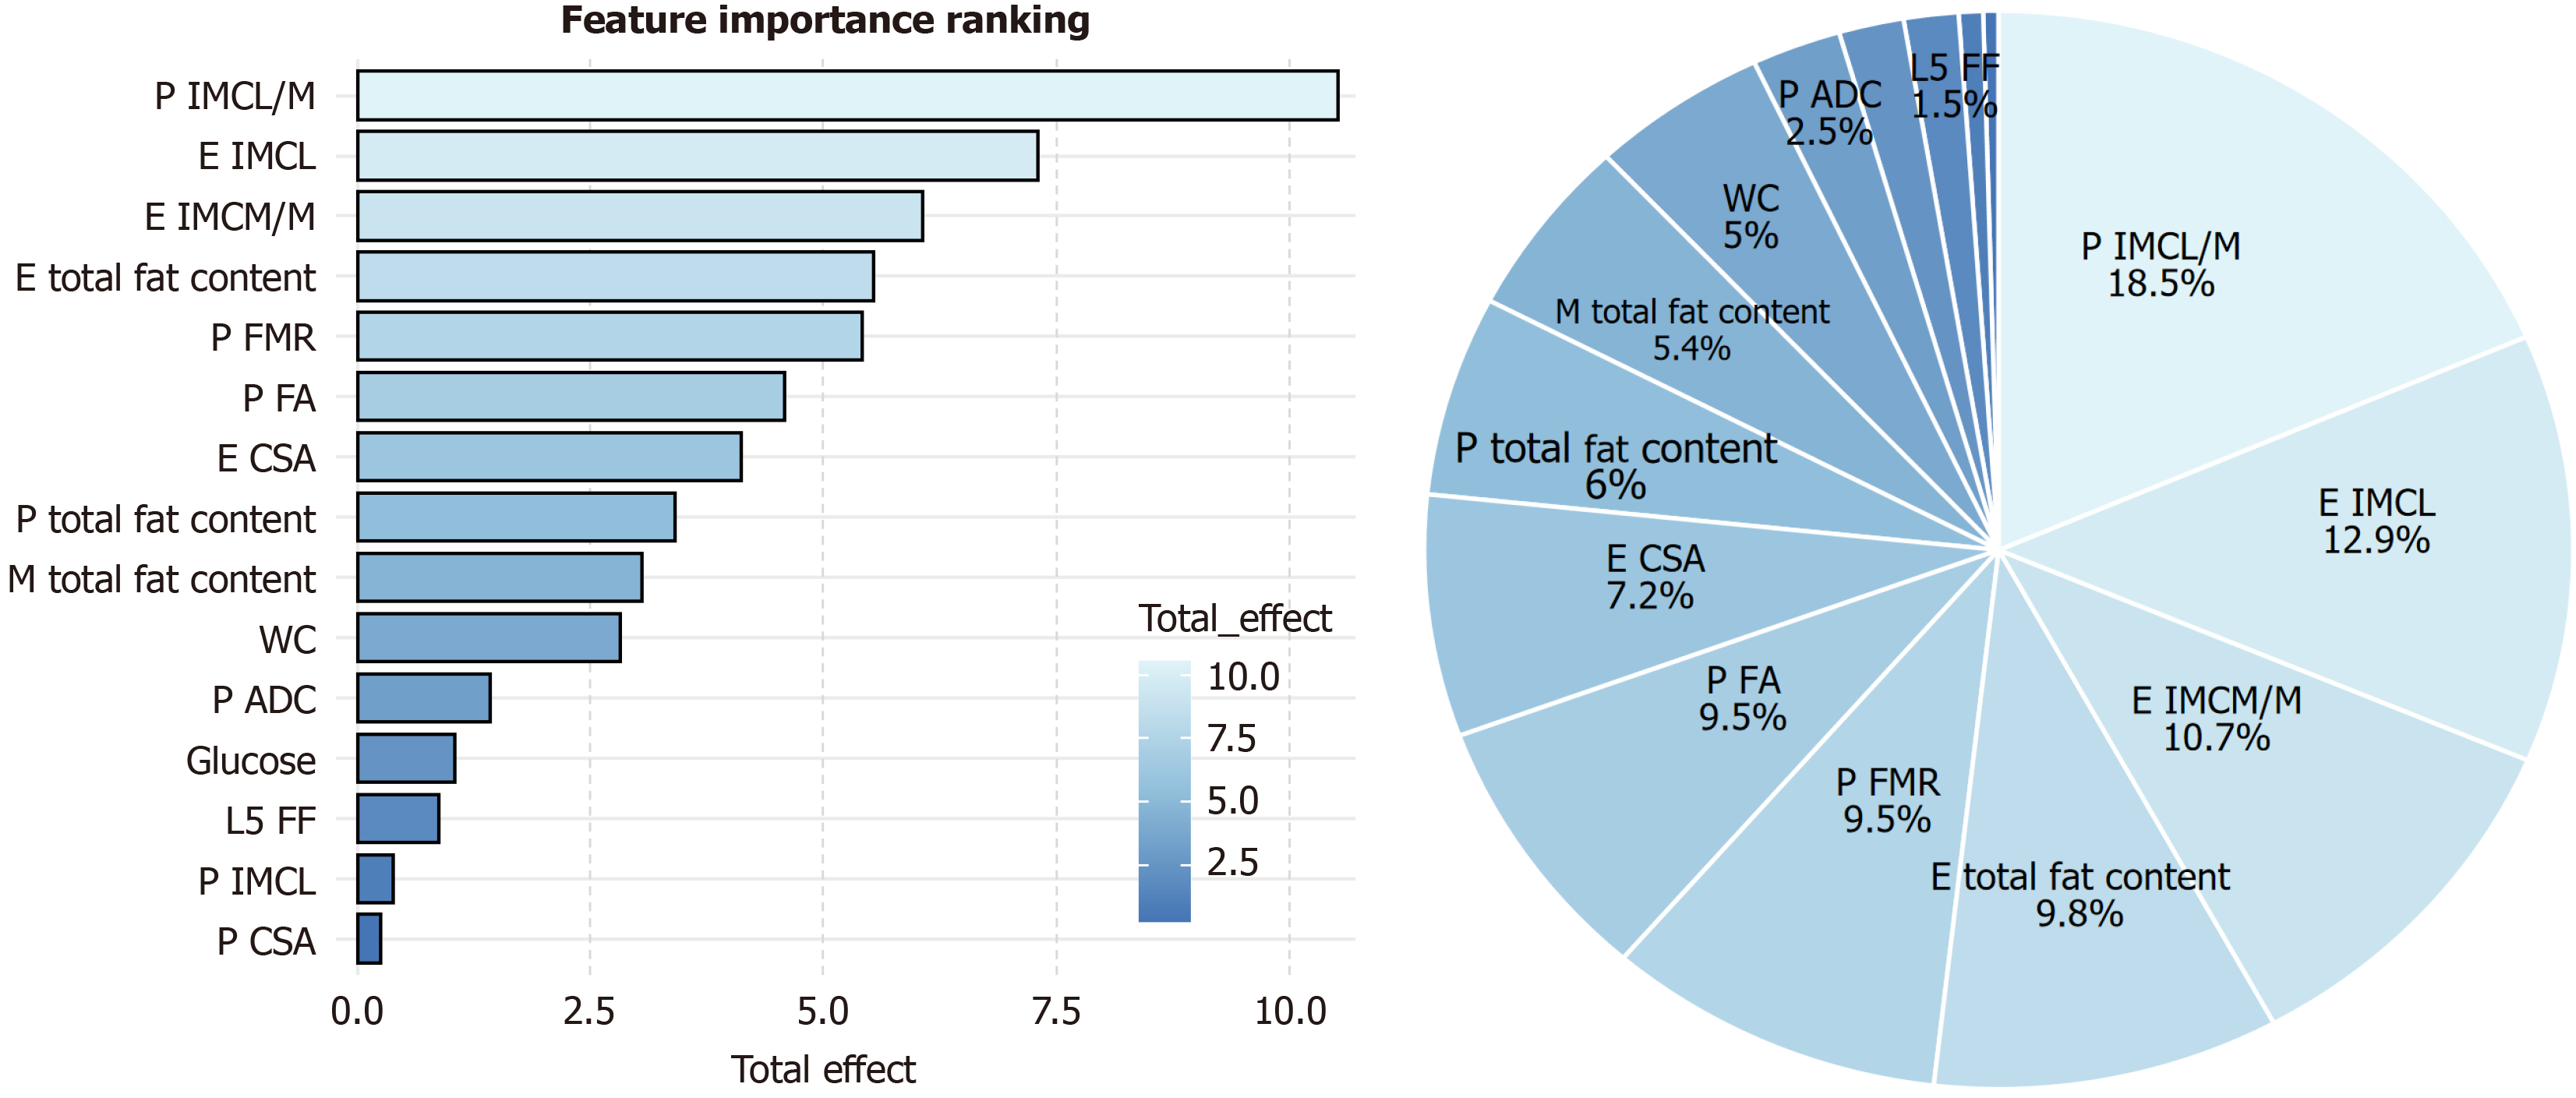
Figure 4 Importance of features in the diagnosis of type 2 diabetes mellitus with insulin resistance.
P: Psoas; E: Erector; M: Multifidus; IMCL/M: Intramyocellular lipid/muscle ratio; IMCL: Intramyocellular lipid; FMR: Fat–muscle ratio; FA: Fractional anisotropy; CSA: Cross-sectional area; WC: Waist circumstance; ADC: Apparent diffusion coefficient; FF: Fat fraction.
- Citation: Hou BW, Ran Z, Li YT, Zhang J, Chu YQ, Gharaibeh NM, Li XM. Magnetic resonance imaging derived biomarkers for the diagnosis of type 2 diabetes with insulin resistance: A pilot study. World J Diabetes 2025; 16(9): 110183
- URL: https://www.wjgnet.com/1948-9358/full/v16/i9/110183.htm
- DOI: https://dx.doi.org/10.4239/wjd.v16.i9.110183


