Copyright
©The Author(s) 2025.
World J Diabetes. Sep 15, 2025; 16(9): 109553
Published online Sep 15, 2025. doi: 10.4239/wjd.v16.i9.109553
Published online Sep 15, 2025. doi: 10.4239/wjd.v16.i9.109553
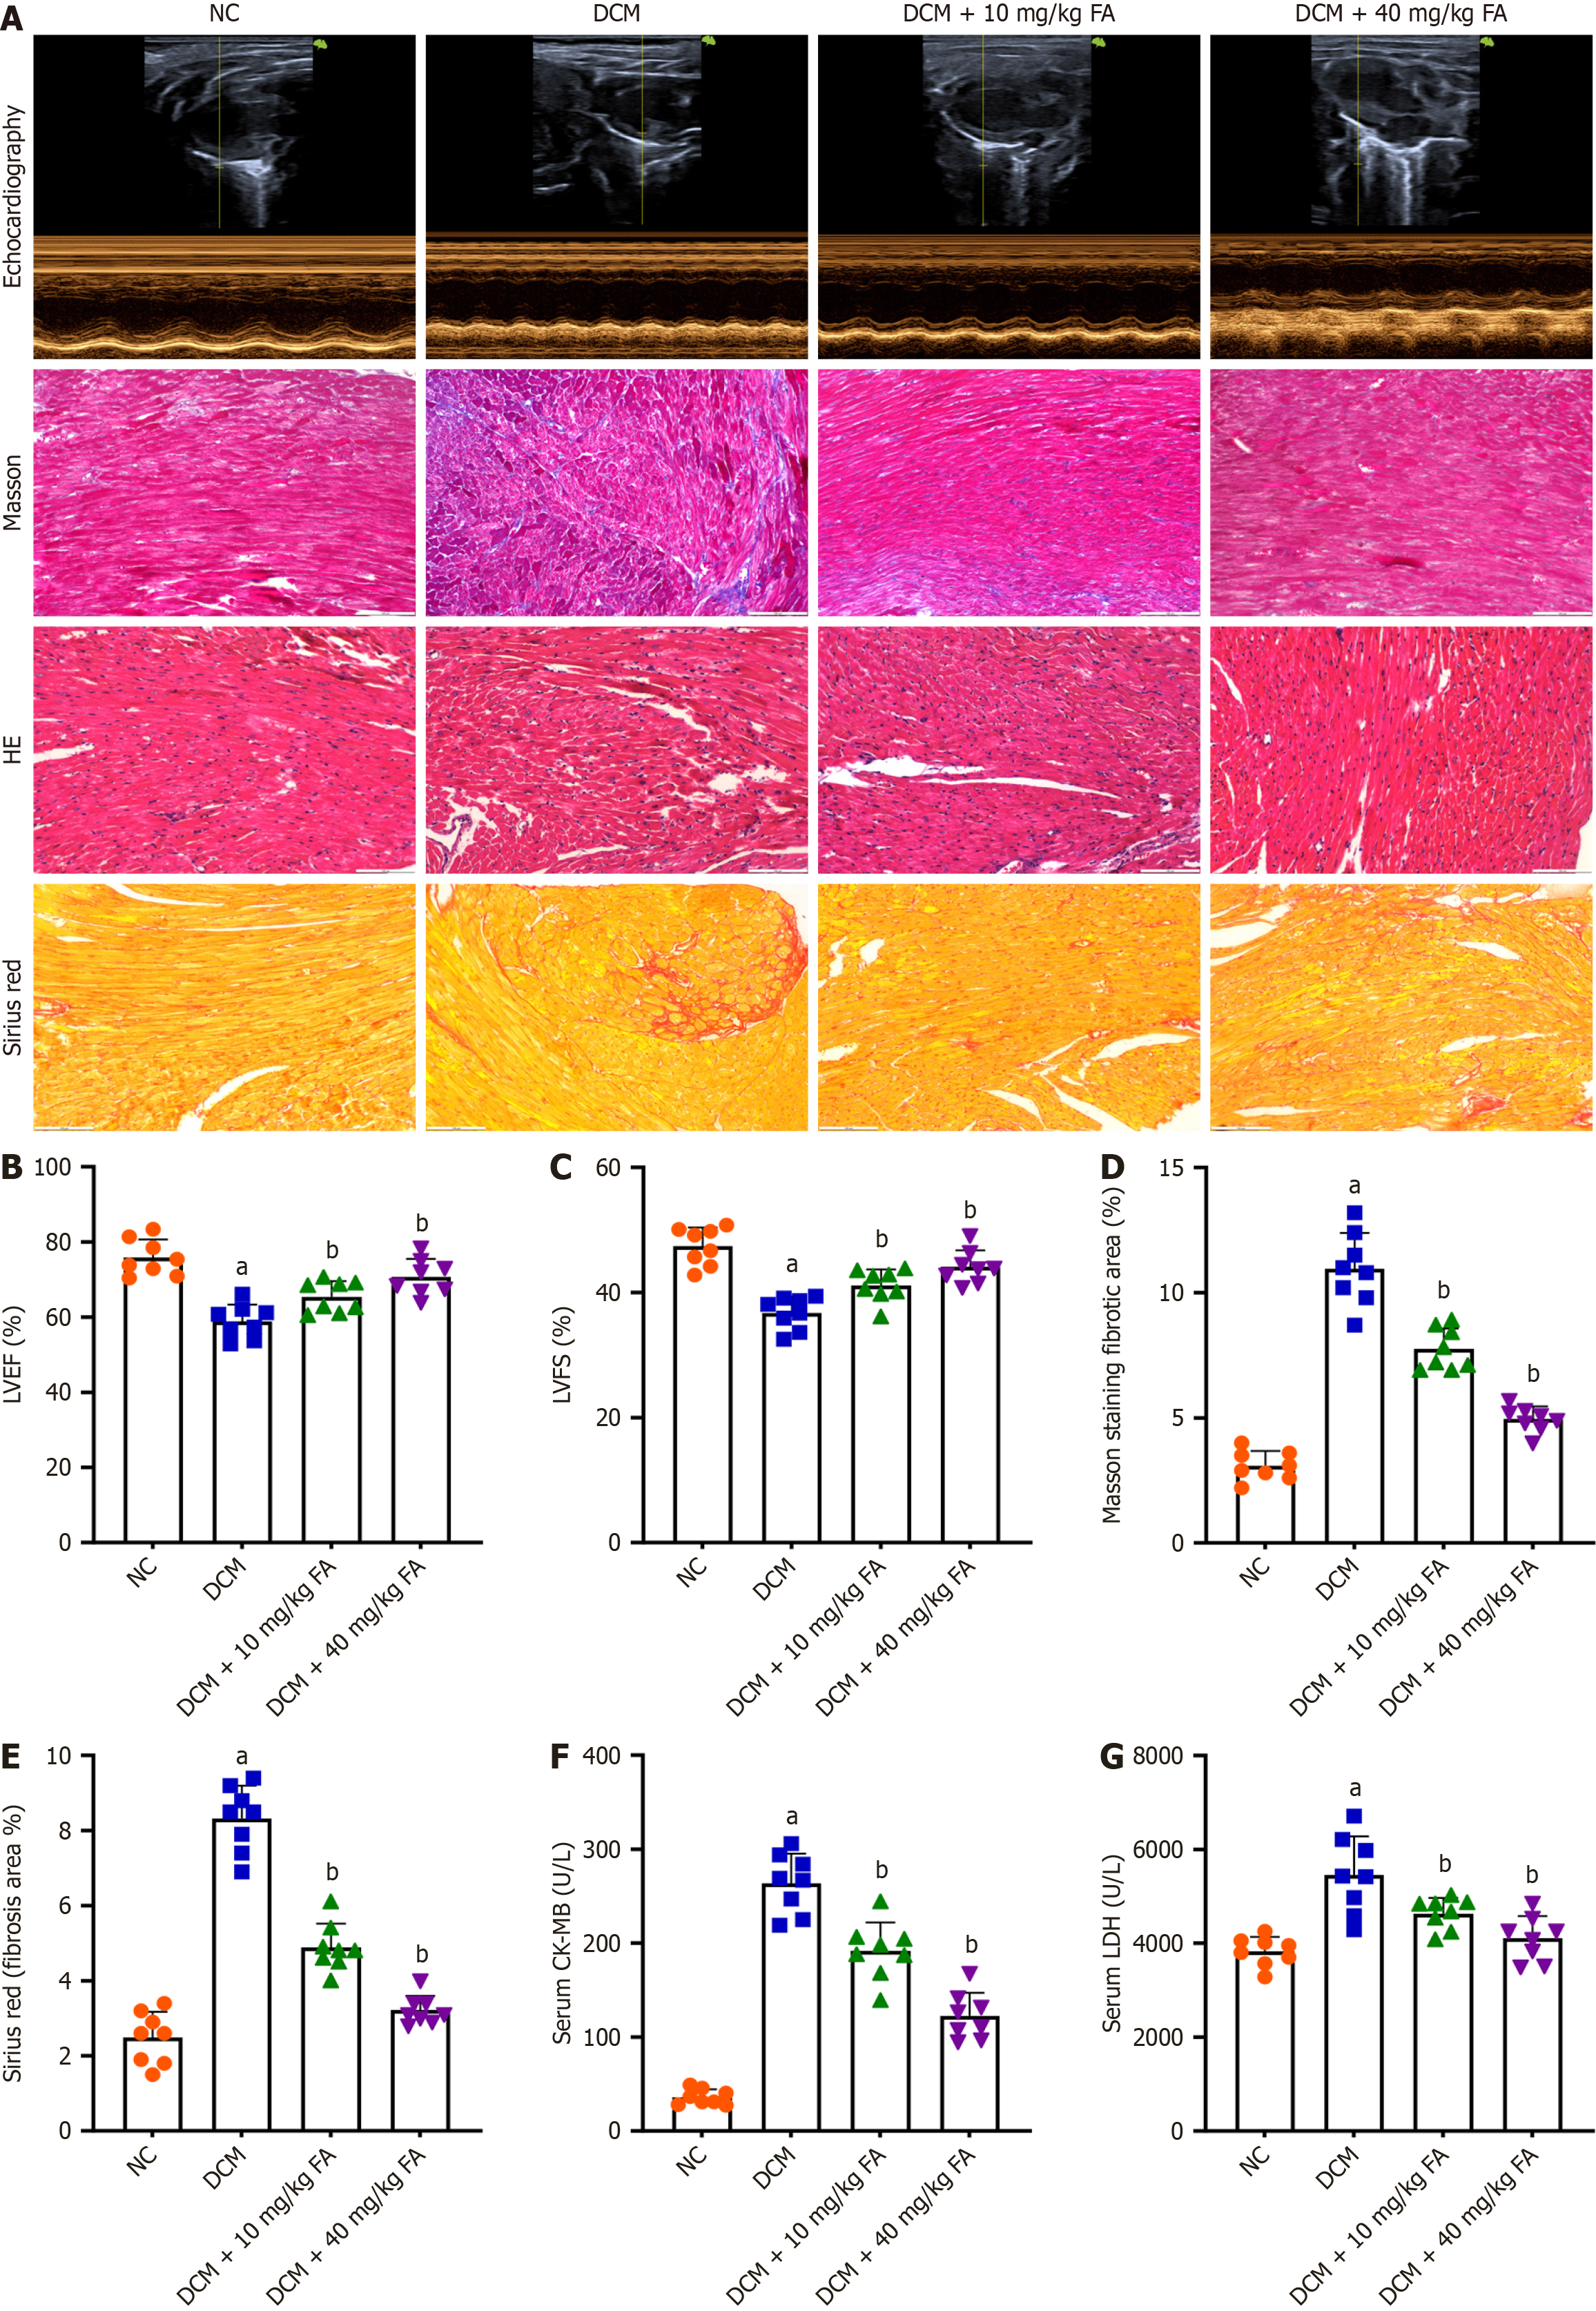
Figure 1 Treatment with Farrerol improved cardiac performance and histopathology in diabetic cardiomyopathy mice.
A: Representative M-mode and pulse-wave Doppler echocardiograms of the mitral inflow (n = 8); B and C: Statistical analysis of the left ventricular ejection fraction and left ventricular fractional shortening in mice from indicated groups (n = 8); D and E: Interstitial fibrosis was detected by Masson's trichrome and Sirius red staining. Scale bars: 100 μm; F and G: Quantitative analysis of serum creatine kinase-MB and lactate dehydrogenase levels by ELISA (n = 8). aP < 0.05 vs NC; bP < 0.05 vs DCM. Eight biological replicates were included in the experiment, and the results are shown as scatter plots. FA: Farrerol; DCM: Diabetic cardiomyopathy.
Figure 2 Treatment with Farrerol alleviated cardiac microvascular injury in diabetic cardiomyopathy mice.
A and B: Cardiac microvascular density was determined using CD31-positive endothelial cells (ECs), and large vessels were excluded (n = 6 per fields); C: Perivascular leakage of albumin was detected by immunofluorescence staining and quantified. Bar = 50 μm; D-F: Protein expression of intercellular adhesion molecule-1 and endothelial nitric oxide synthase (eNOS) were detected by western blot and quantified (n = 3); G: Representative immunofluorescence images of endothelial anchoring junctions (VE-cadherin). Bar = 100 μm; H: In vitro endothelial monolayer permeability was determined based on FITC-BSA leakage (n = 6 per group); I and J: Representative images of immunofluorescence staining of Intercellular adhesion molecule-1 (VCAM-1) and quantitative analysis of VCAM-1 intensity. Bar = 20 μm. n = 6 per fields; K-M: Immunoblots and quantitative data of VCAM-1 and eNOS expression in high glucose and free fatty acid treated ECs (n = 3). aP < 0.05 vs NC; bP < 0.05 vs DCM or HG/FFA. FA: Farrerol; DCM: Diabetic cardiomyopathy; HG/FFA: High glucose and free fatty acid.
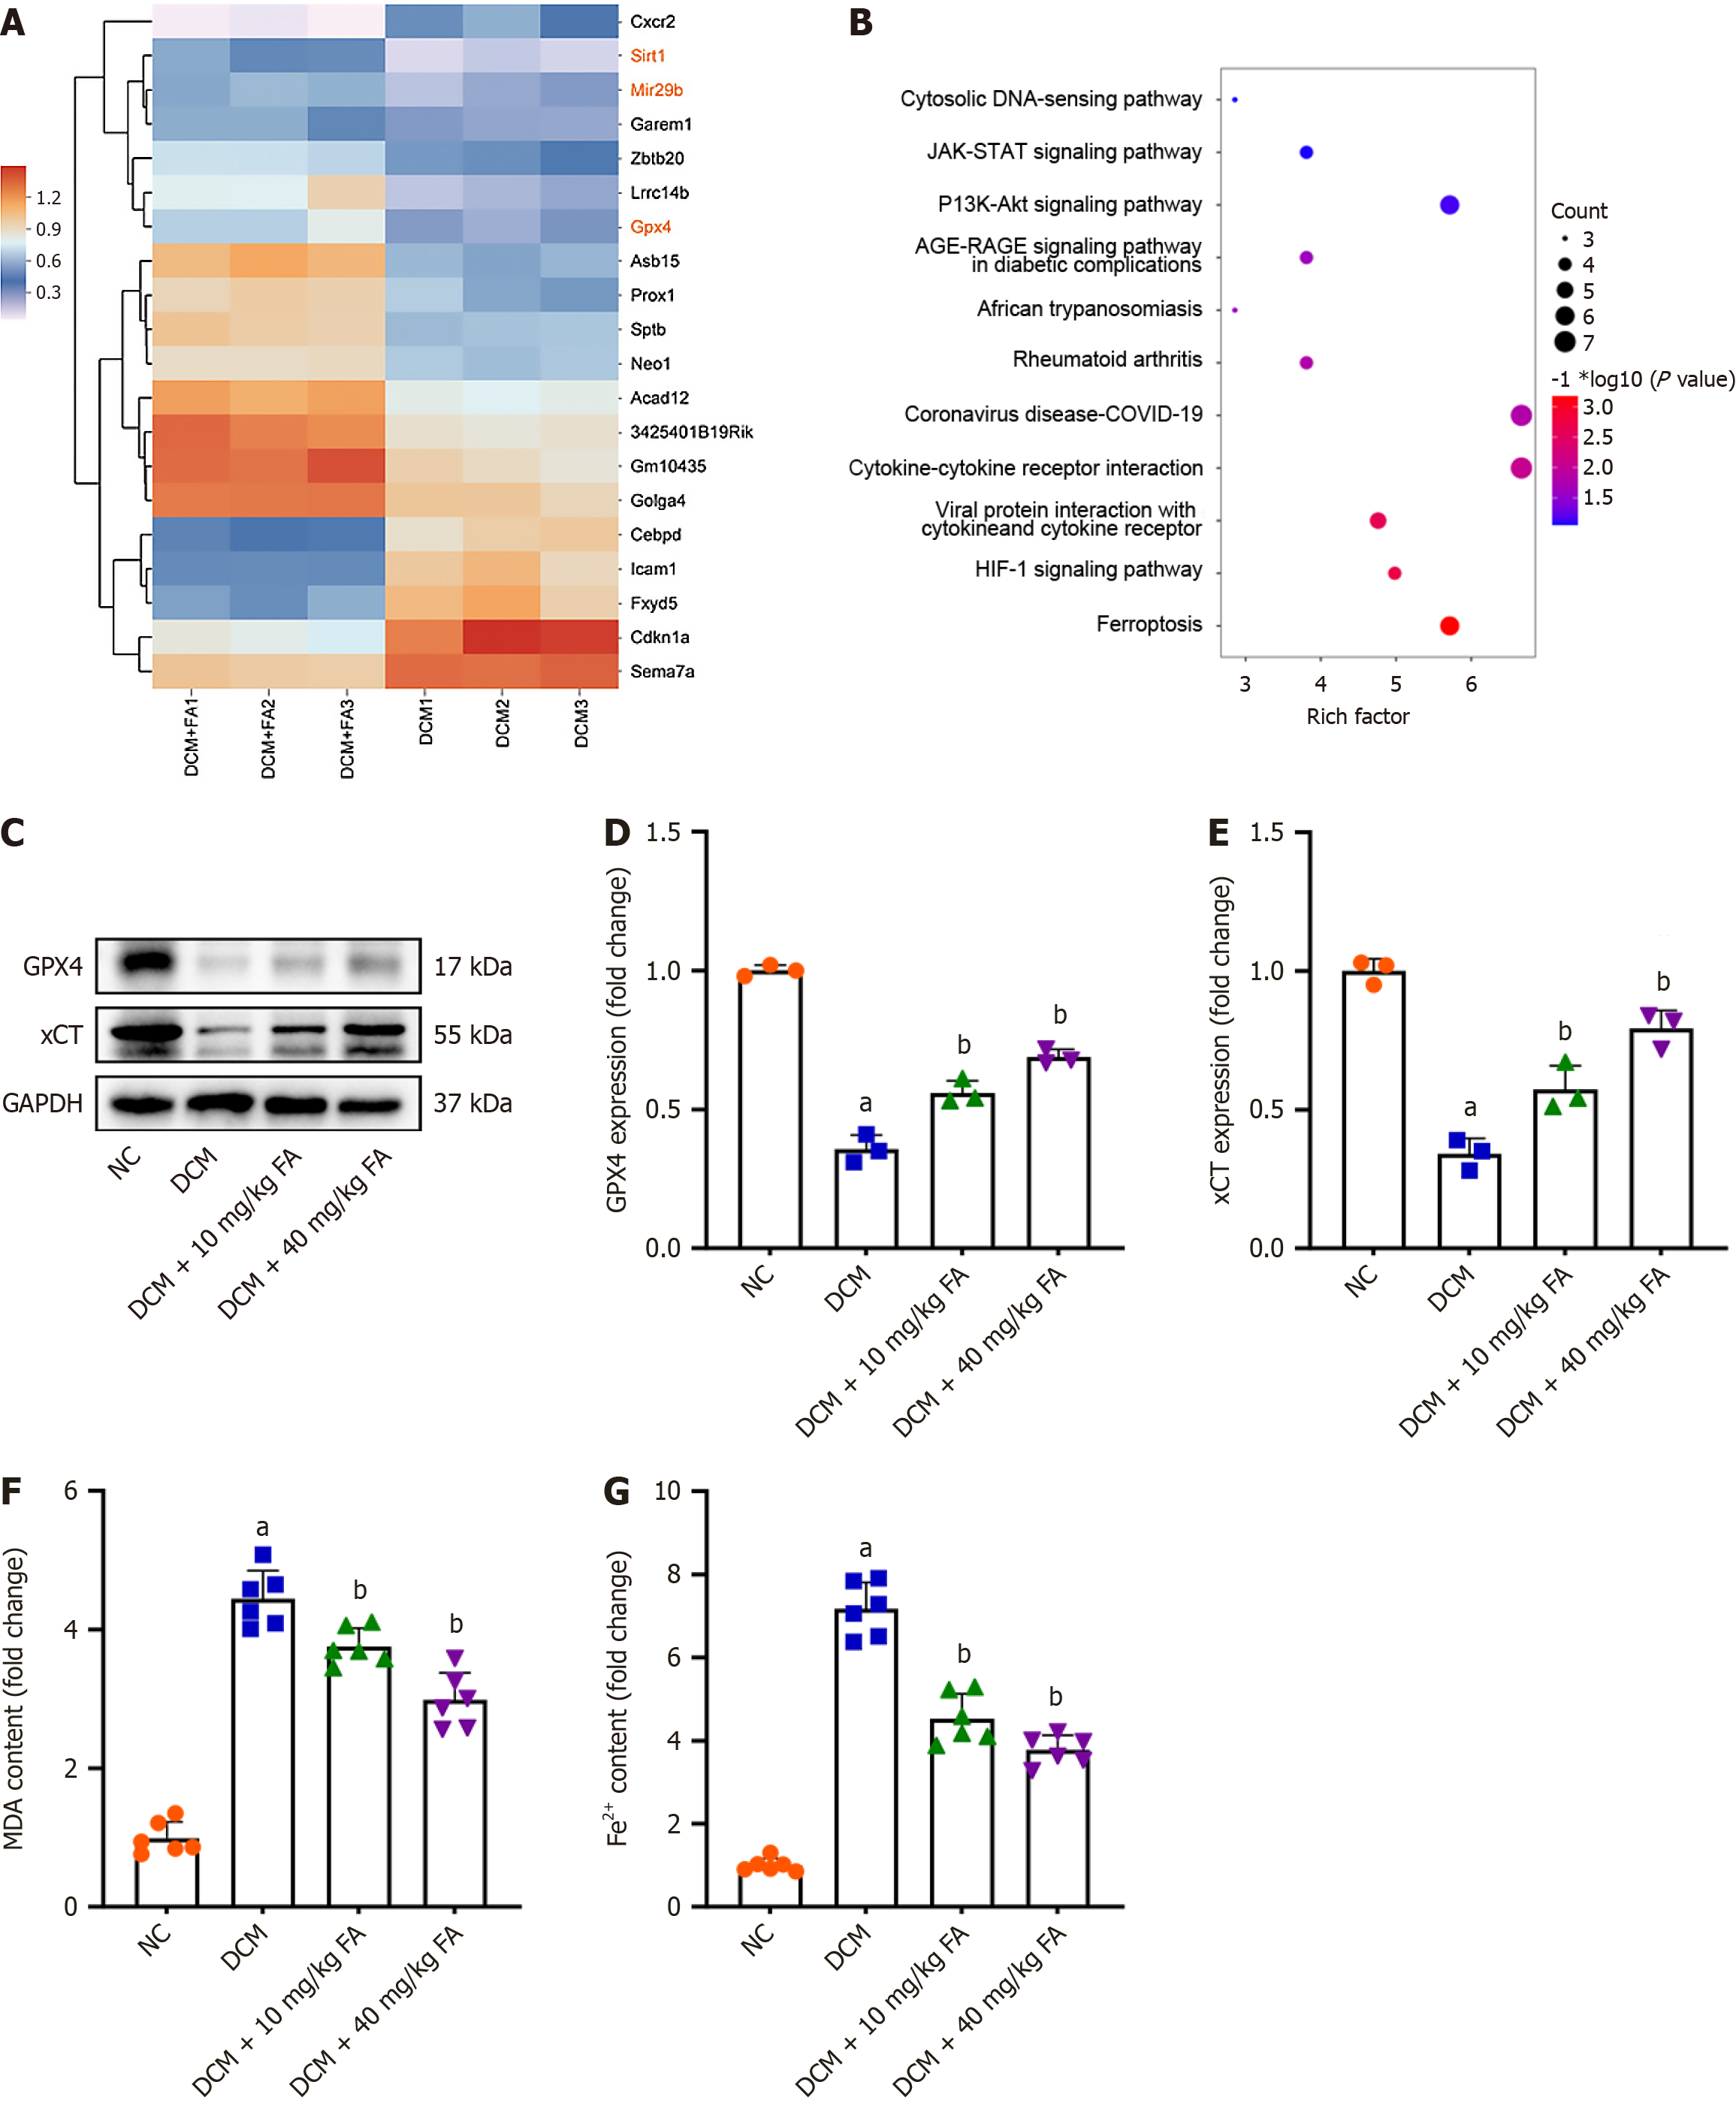
Figure 3 Farrerol treatment inhibited ferroptosis in diabetic hearts.
A: RNA-sequencing was used to investigate the underlying mechanism of Farrerol on diabetic cardiomyopathy and a heatmap showed the top 20 differentially expressed genes (DEGs) between the groups; B: Kyoto Encyclopedia of Genes and Genome analysis of the top 100 DEGs between the groups; C-E: Western blot showed the changes of ferroptosis related proteins GPX4 and xCT in the four groups (n = 3); F: Relative expression of malondialdehyde in the hearts from indicated groups were determined by the commercial kit (n = 6); G: The content of Fe2+ in endothelial cells was assessed by the commercial kit (n = 6). aP < 0.05 vs NC; bP < 0.05 vs DCM. FA: Farrerol; DCM: Diabetic cardiomyopathy.
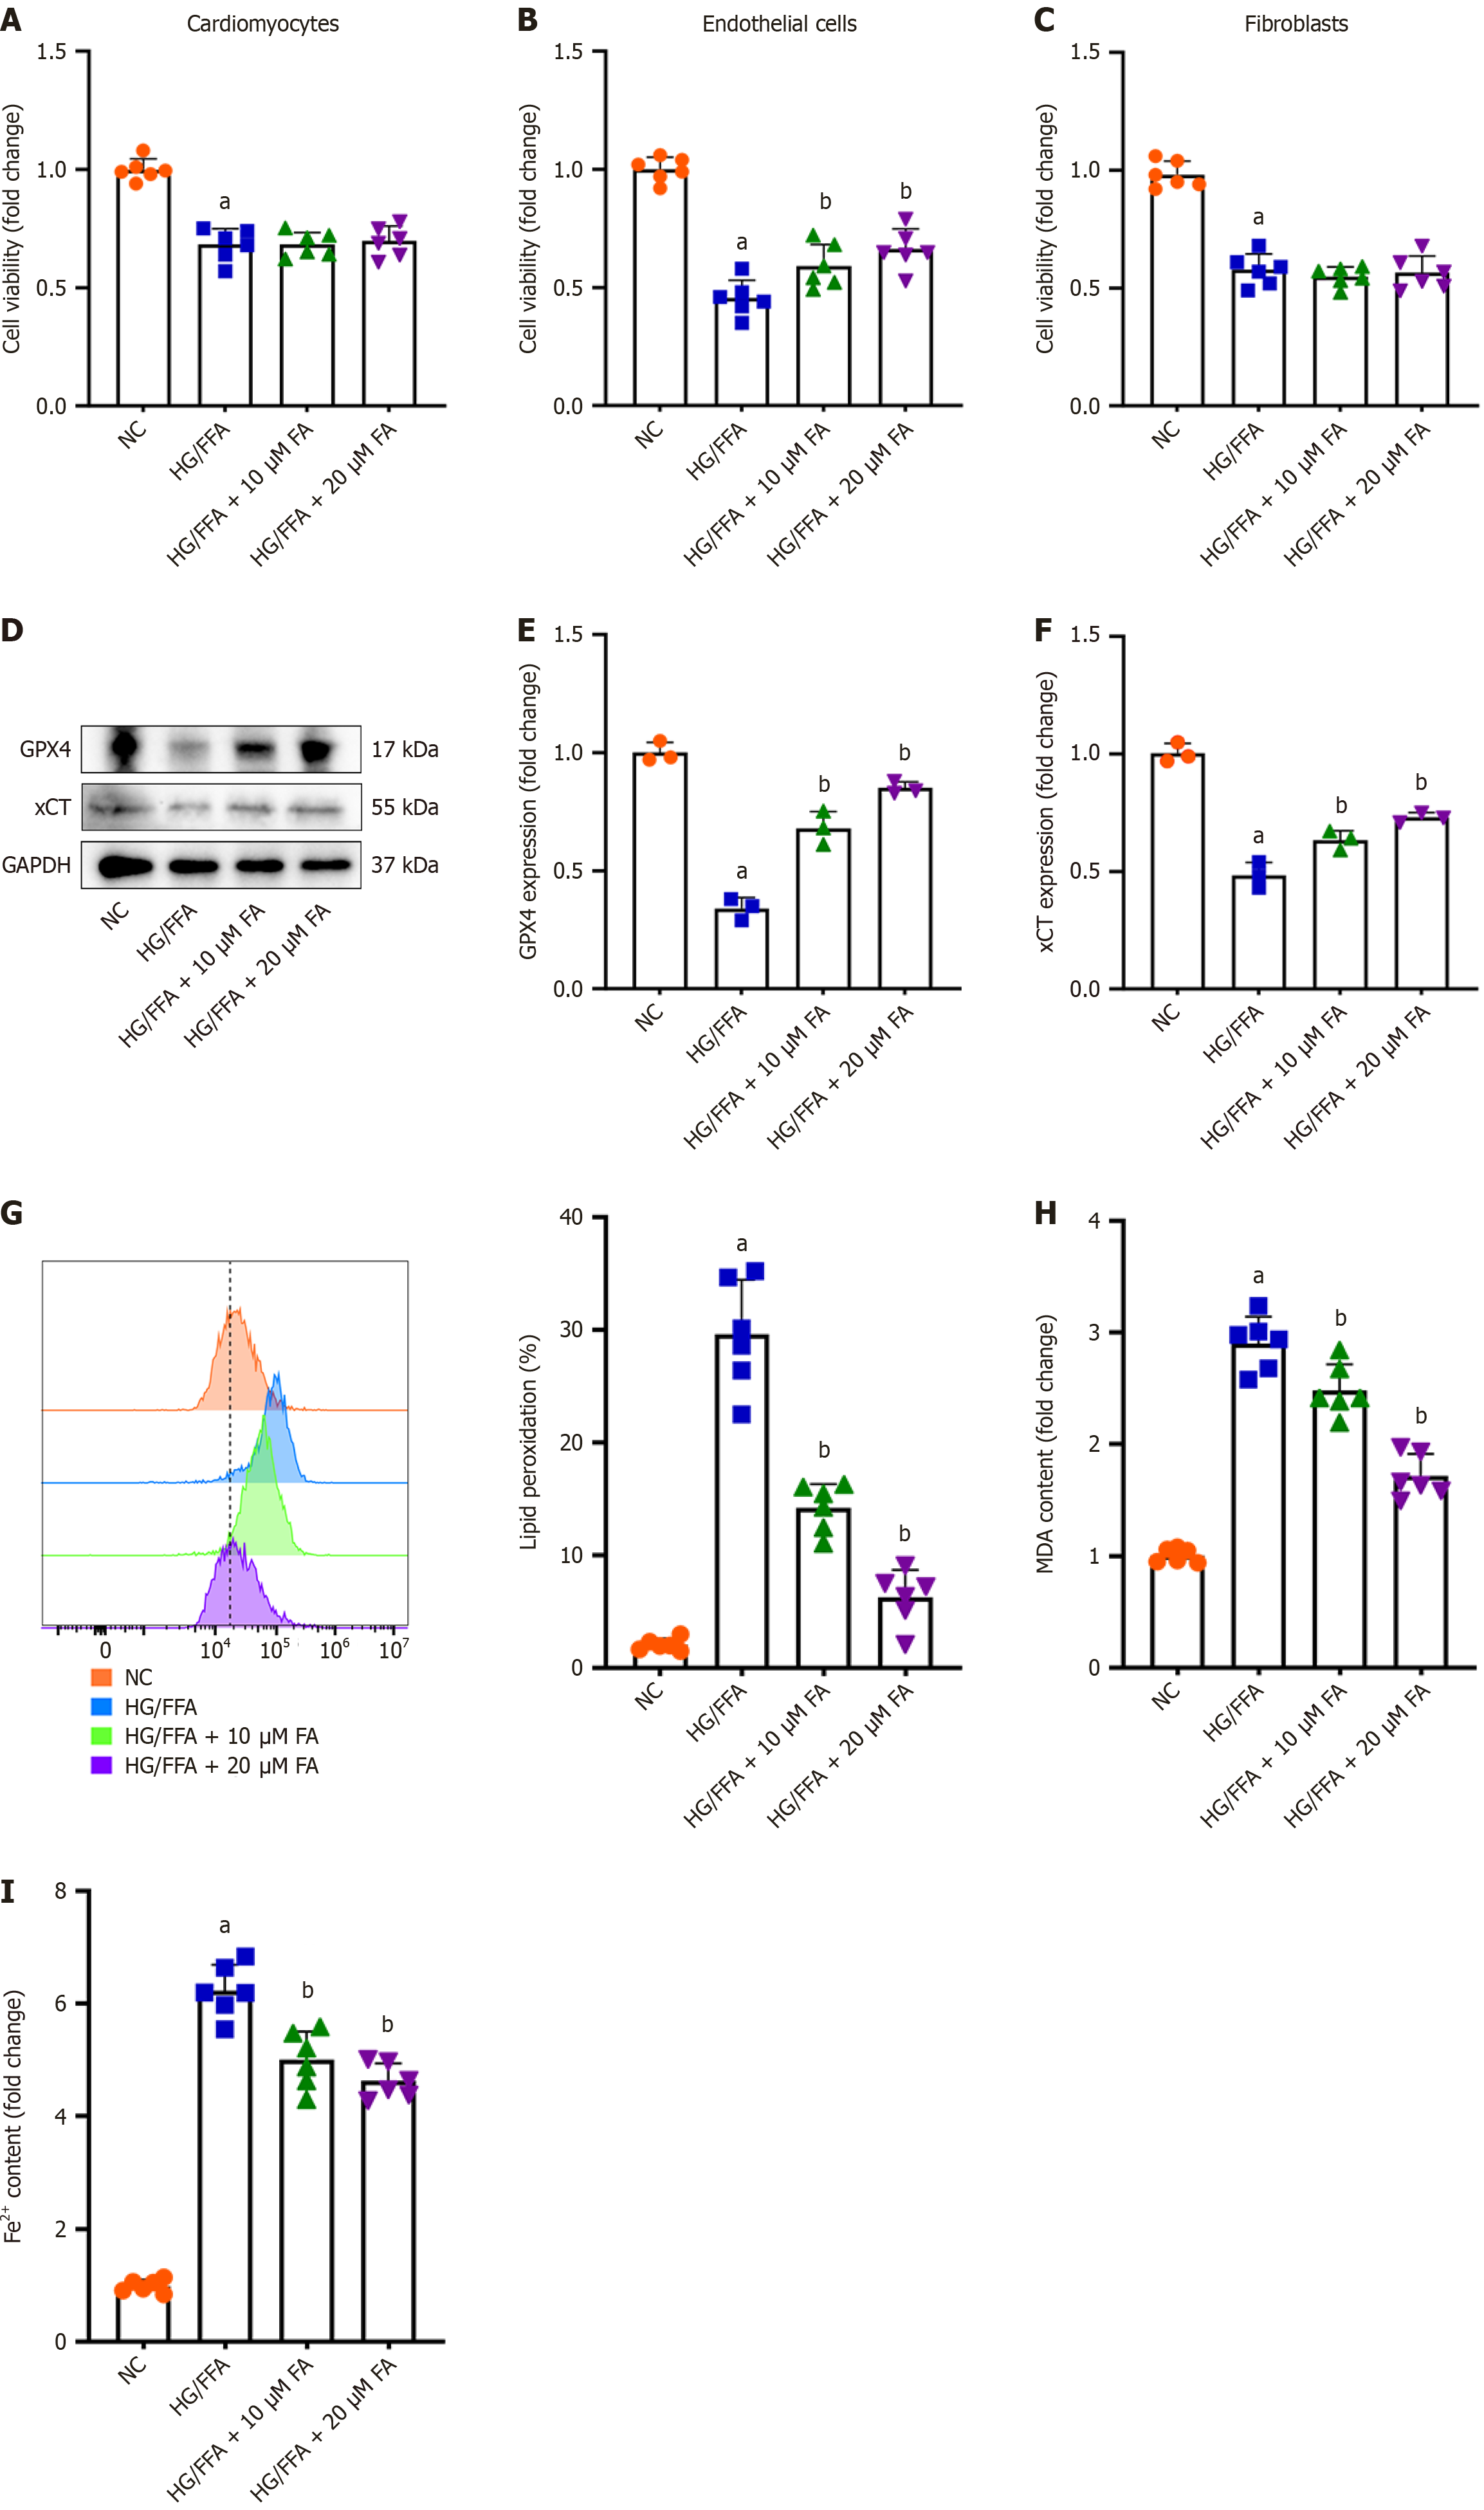
Figure 4 Farrerol treatment inhibited ferroptosis in high glucose and free fatty acid treated endothelial cells.
A-C: Cell viability was detected via cell counting kit-8 assay in cardiomyocytes, endothelial cells (ECs), and fibroblasts after indicated treatments (n = 6); D-F: Protein expression of GPX4 and xCT were detected in ECs upon high glucose and free fatty acid or different concentration of Farrerol treatment (n = 3); G: Flow cytometry is used to detect the changes in lipid peroxidation levels in ECs under different treatment conditions; H: Relative expression of malondialdehyde in the hearts from indicated groups were determined by the commercial kit (n = 6); I: The content of Fe2+ in ECs was assessed by the commercial kit (n = 6). aP < 0.05 vs NC; bP < 0.05 vs DCM. FA: Farrerol; DCM: Diabetic cardiomyopathy; HG/FFA: High glucose and free fatty acid.
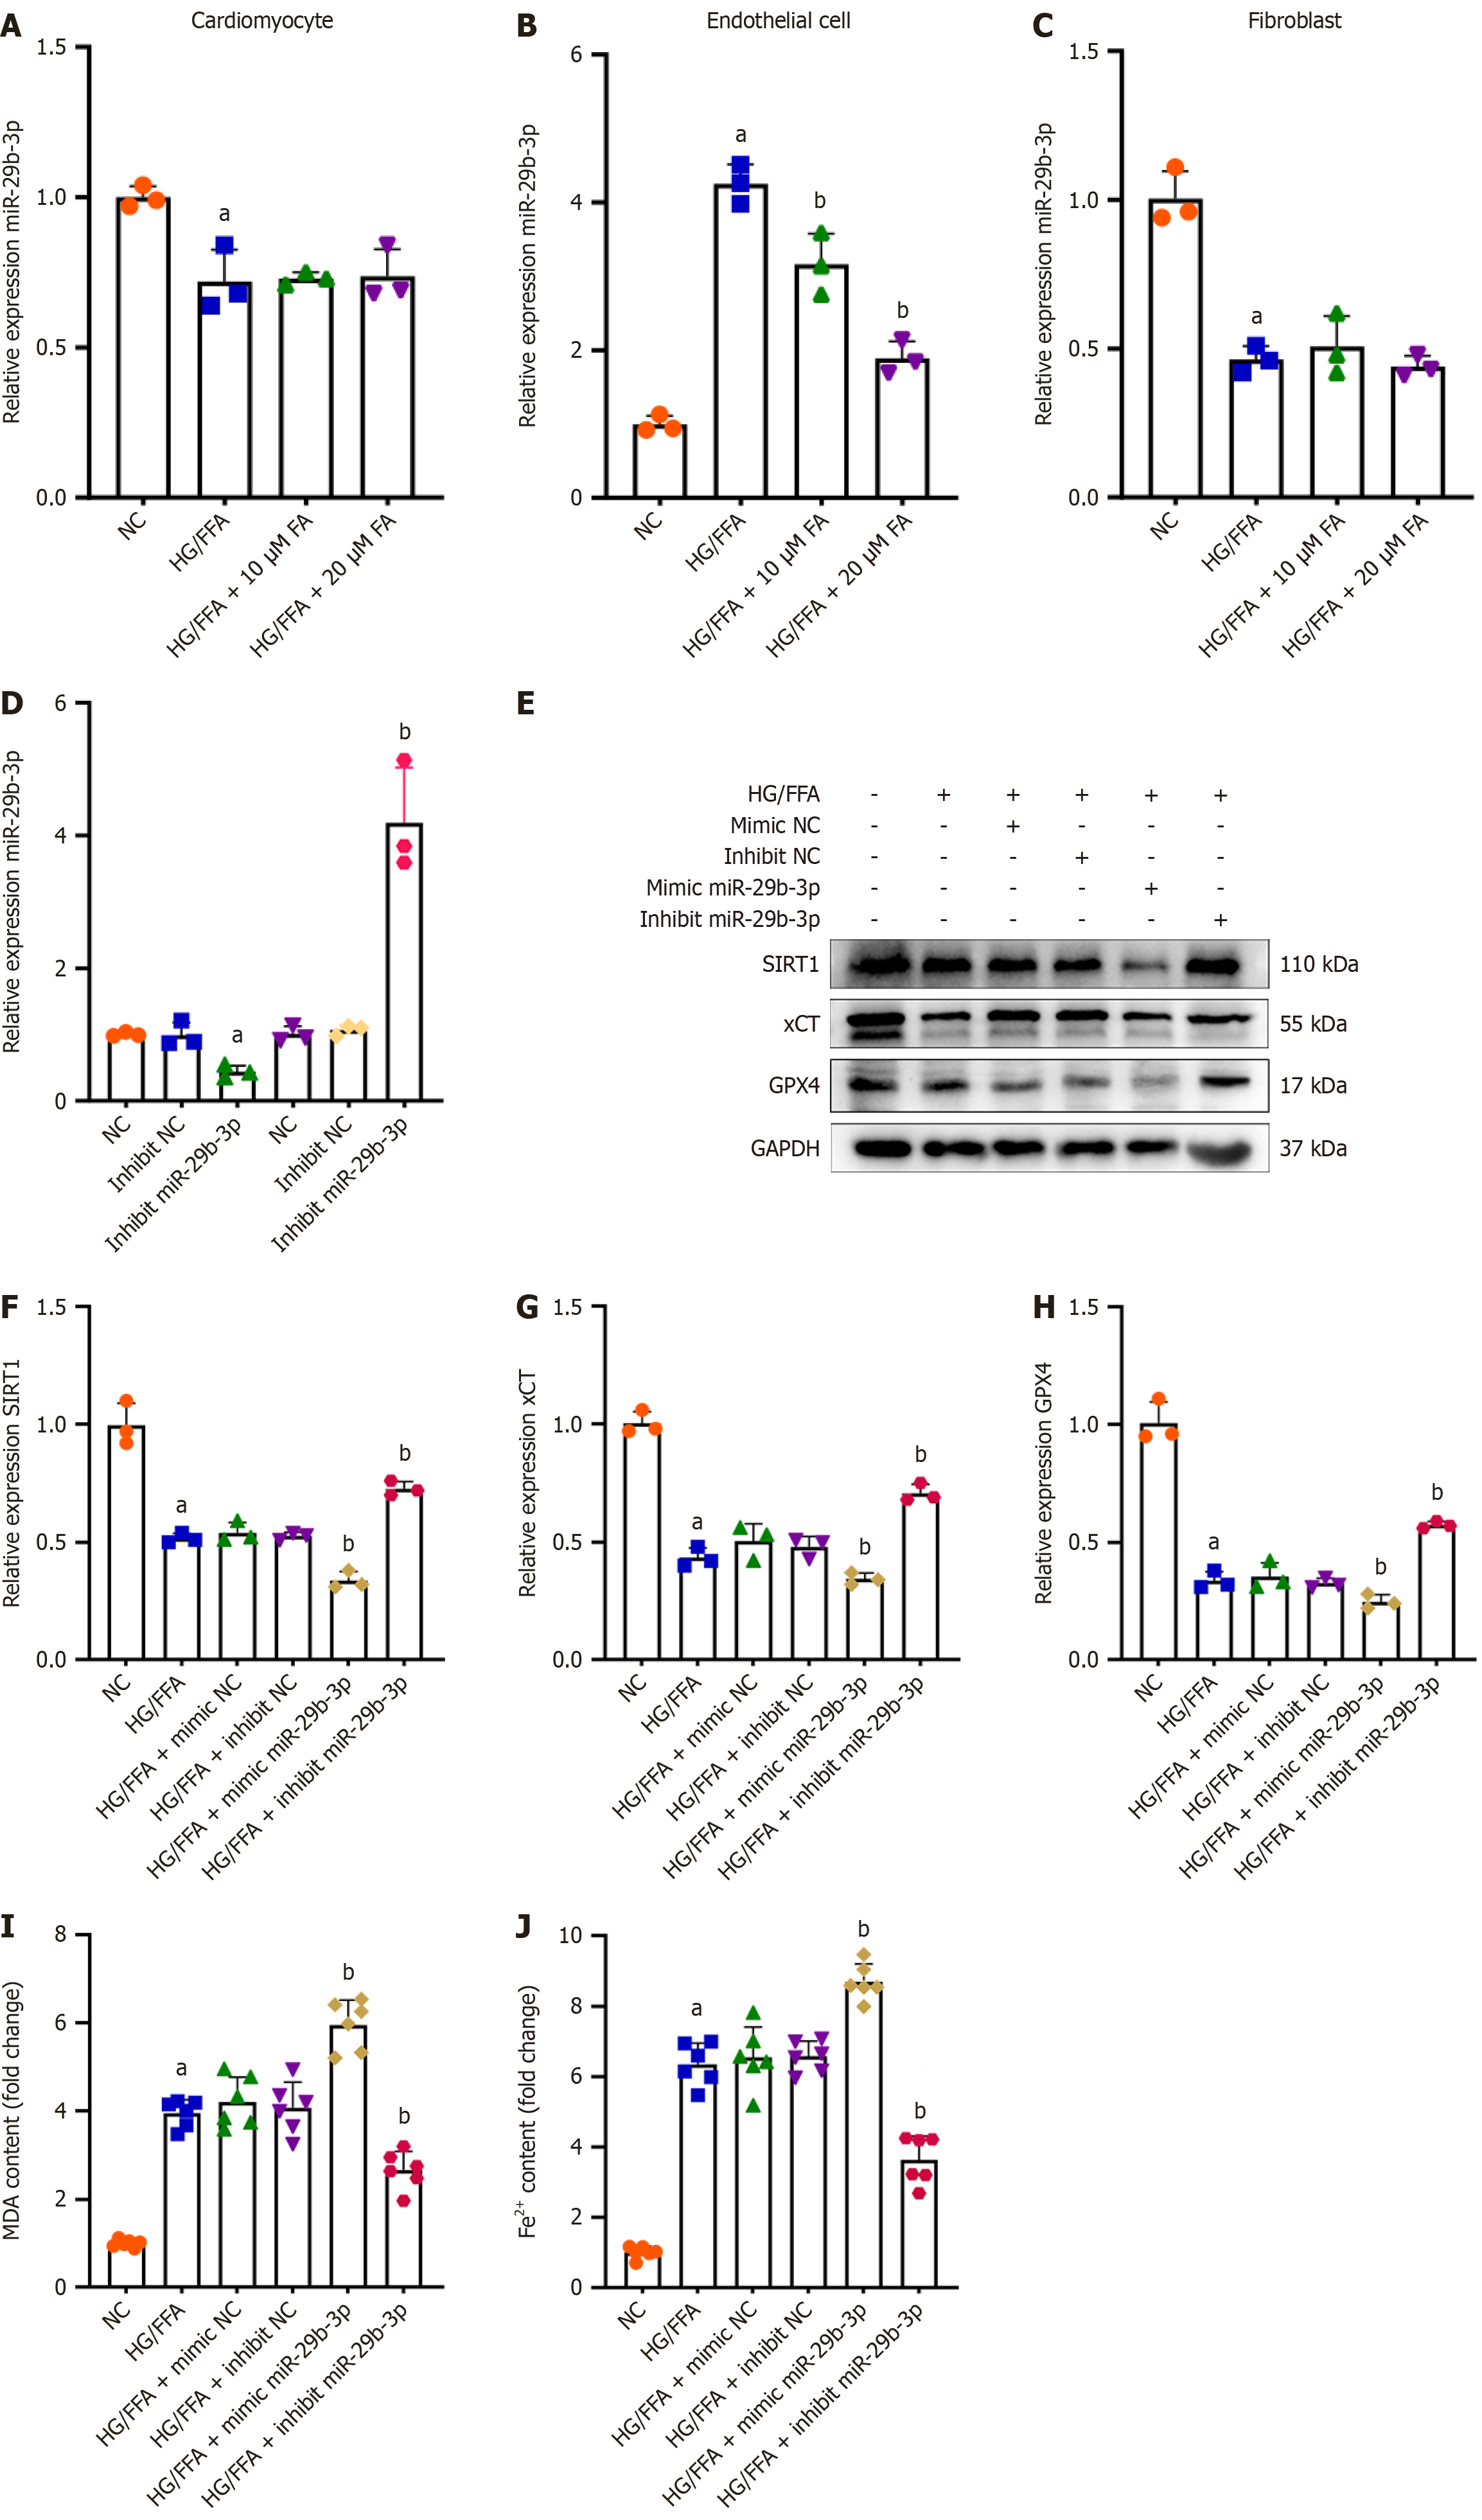
Figure 5 The effect of upregulation or downregulation of miR-29b-3p on high glucose and free fatty acid-induced ferroptosis of endothelial cells.
A-C: Relative expression of miR-29b-3p in cardiomyocytes, endothelial cells (ECs), and fibroblasts was detected via reverse transcription-quantitative PCR analysis (n = 3); D: Relative expression of miR-29b-3p in ECs transfected with miR-29b-3p mimics, miR-29b-3p inhibitors and their corresponding negative controls (miR-NC and inhibit-NC, respectively); E-H: Protein expression of GPX4 and xCT were detected in ECs after indicated treatment (n = 3); I: Relative expression of malondialdehyde in the hearts from indicated groups were determined by the commercial kit (n = 6); J: The content of Fe2+ in ECs was assessed by the commercial kit (n = 6). aP < 0.05 vs NC; bP < 0.05 vs HG/FFA. FA: Farrerol; DCM: Diabetic cardiomyopathy; HG/FFA: High glucose and free fatty acid.
Figure 6 Effects of upregulation or downregulation of miR-29b-3p on histopathology and ferroptosis in diabetic cardiomyopathy mice.
A: Representative echocardiographic images for six groups of mice; B and C: Quantification of Left ventricular ejection fraction and left ventricular fractional shortening in mice from specified groups (n = 8); D and E: Masson's trichrome and Sirius red staining was used to detect cardiac fibrosis. Scale bars: 100 μm; F and G: Analysis of serum myocardial enzyme activity creatine kinase-MB and lactate dehydrogenase levels (n = 8); H-K: Representative blot images and quantitative analysis of SIRT1, GPX4 and xCT expression in diabetic hearts from the indicated groups (n = 3). aP < 0.05 vs NC; bP < 0.05 vs DCM. FA: Farrerol; DCM: Diabetic cardiomyopathy; LVEF: Left ventricular ejection fraction; LVFS: Left ventricular fractional shortening; CK-MB: Creatine kinase-MB; LDH: Lactate dehydrogenase.
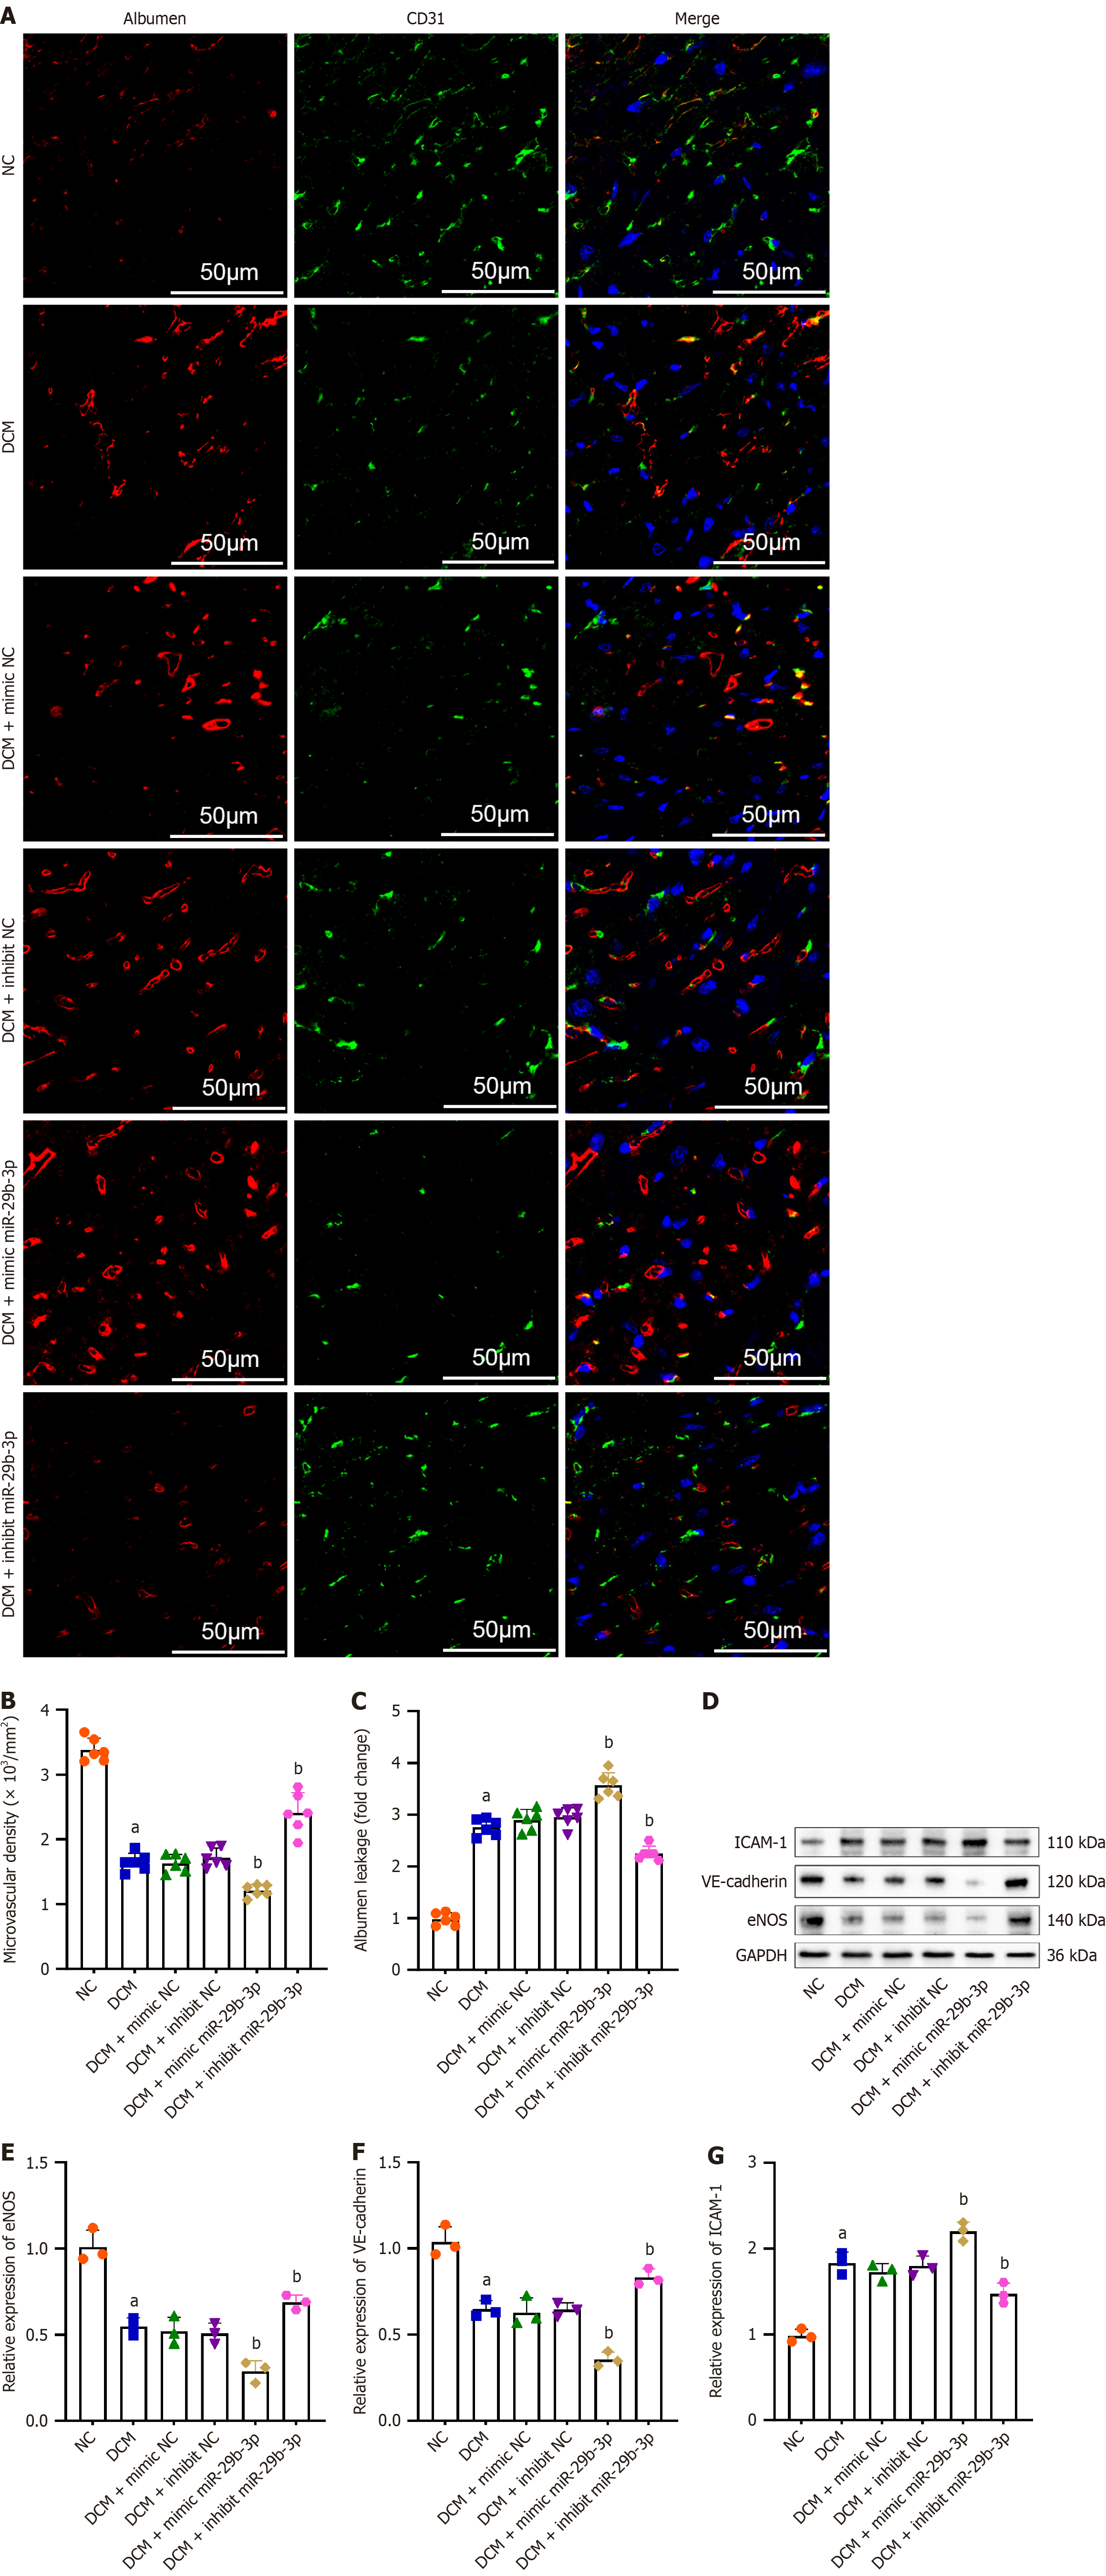
Figure 7 The effects of upregulation or downregulation of miR-29b-3p on cardiac microvascular injury in diabetic cardiomyopathy mice.
A and B: Cardiac microvascular density was determined using CD31-positive endothelial cells, and large vessels were excluded (n = 6); C: Perivascular leakage of albumin was detected by immunofluorescence staining and quantified. Bar = 50 μm; D-G: Protein expression of intercellular adhesion molecule-1, VE-cadherin and endothelial nitric oxide synthase were detected by western blot and quantified (n = 3). aP < 0.05 vs NC; bP < 0.05 vs DCM. DCM: Diabetic cardiomyopathy; ECs: Endothelial cells; ICAM-1: Intercellular adhesion molecule-1; eNOS: Endothelial nitric oxide synthase.
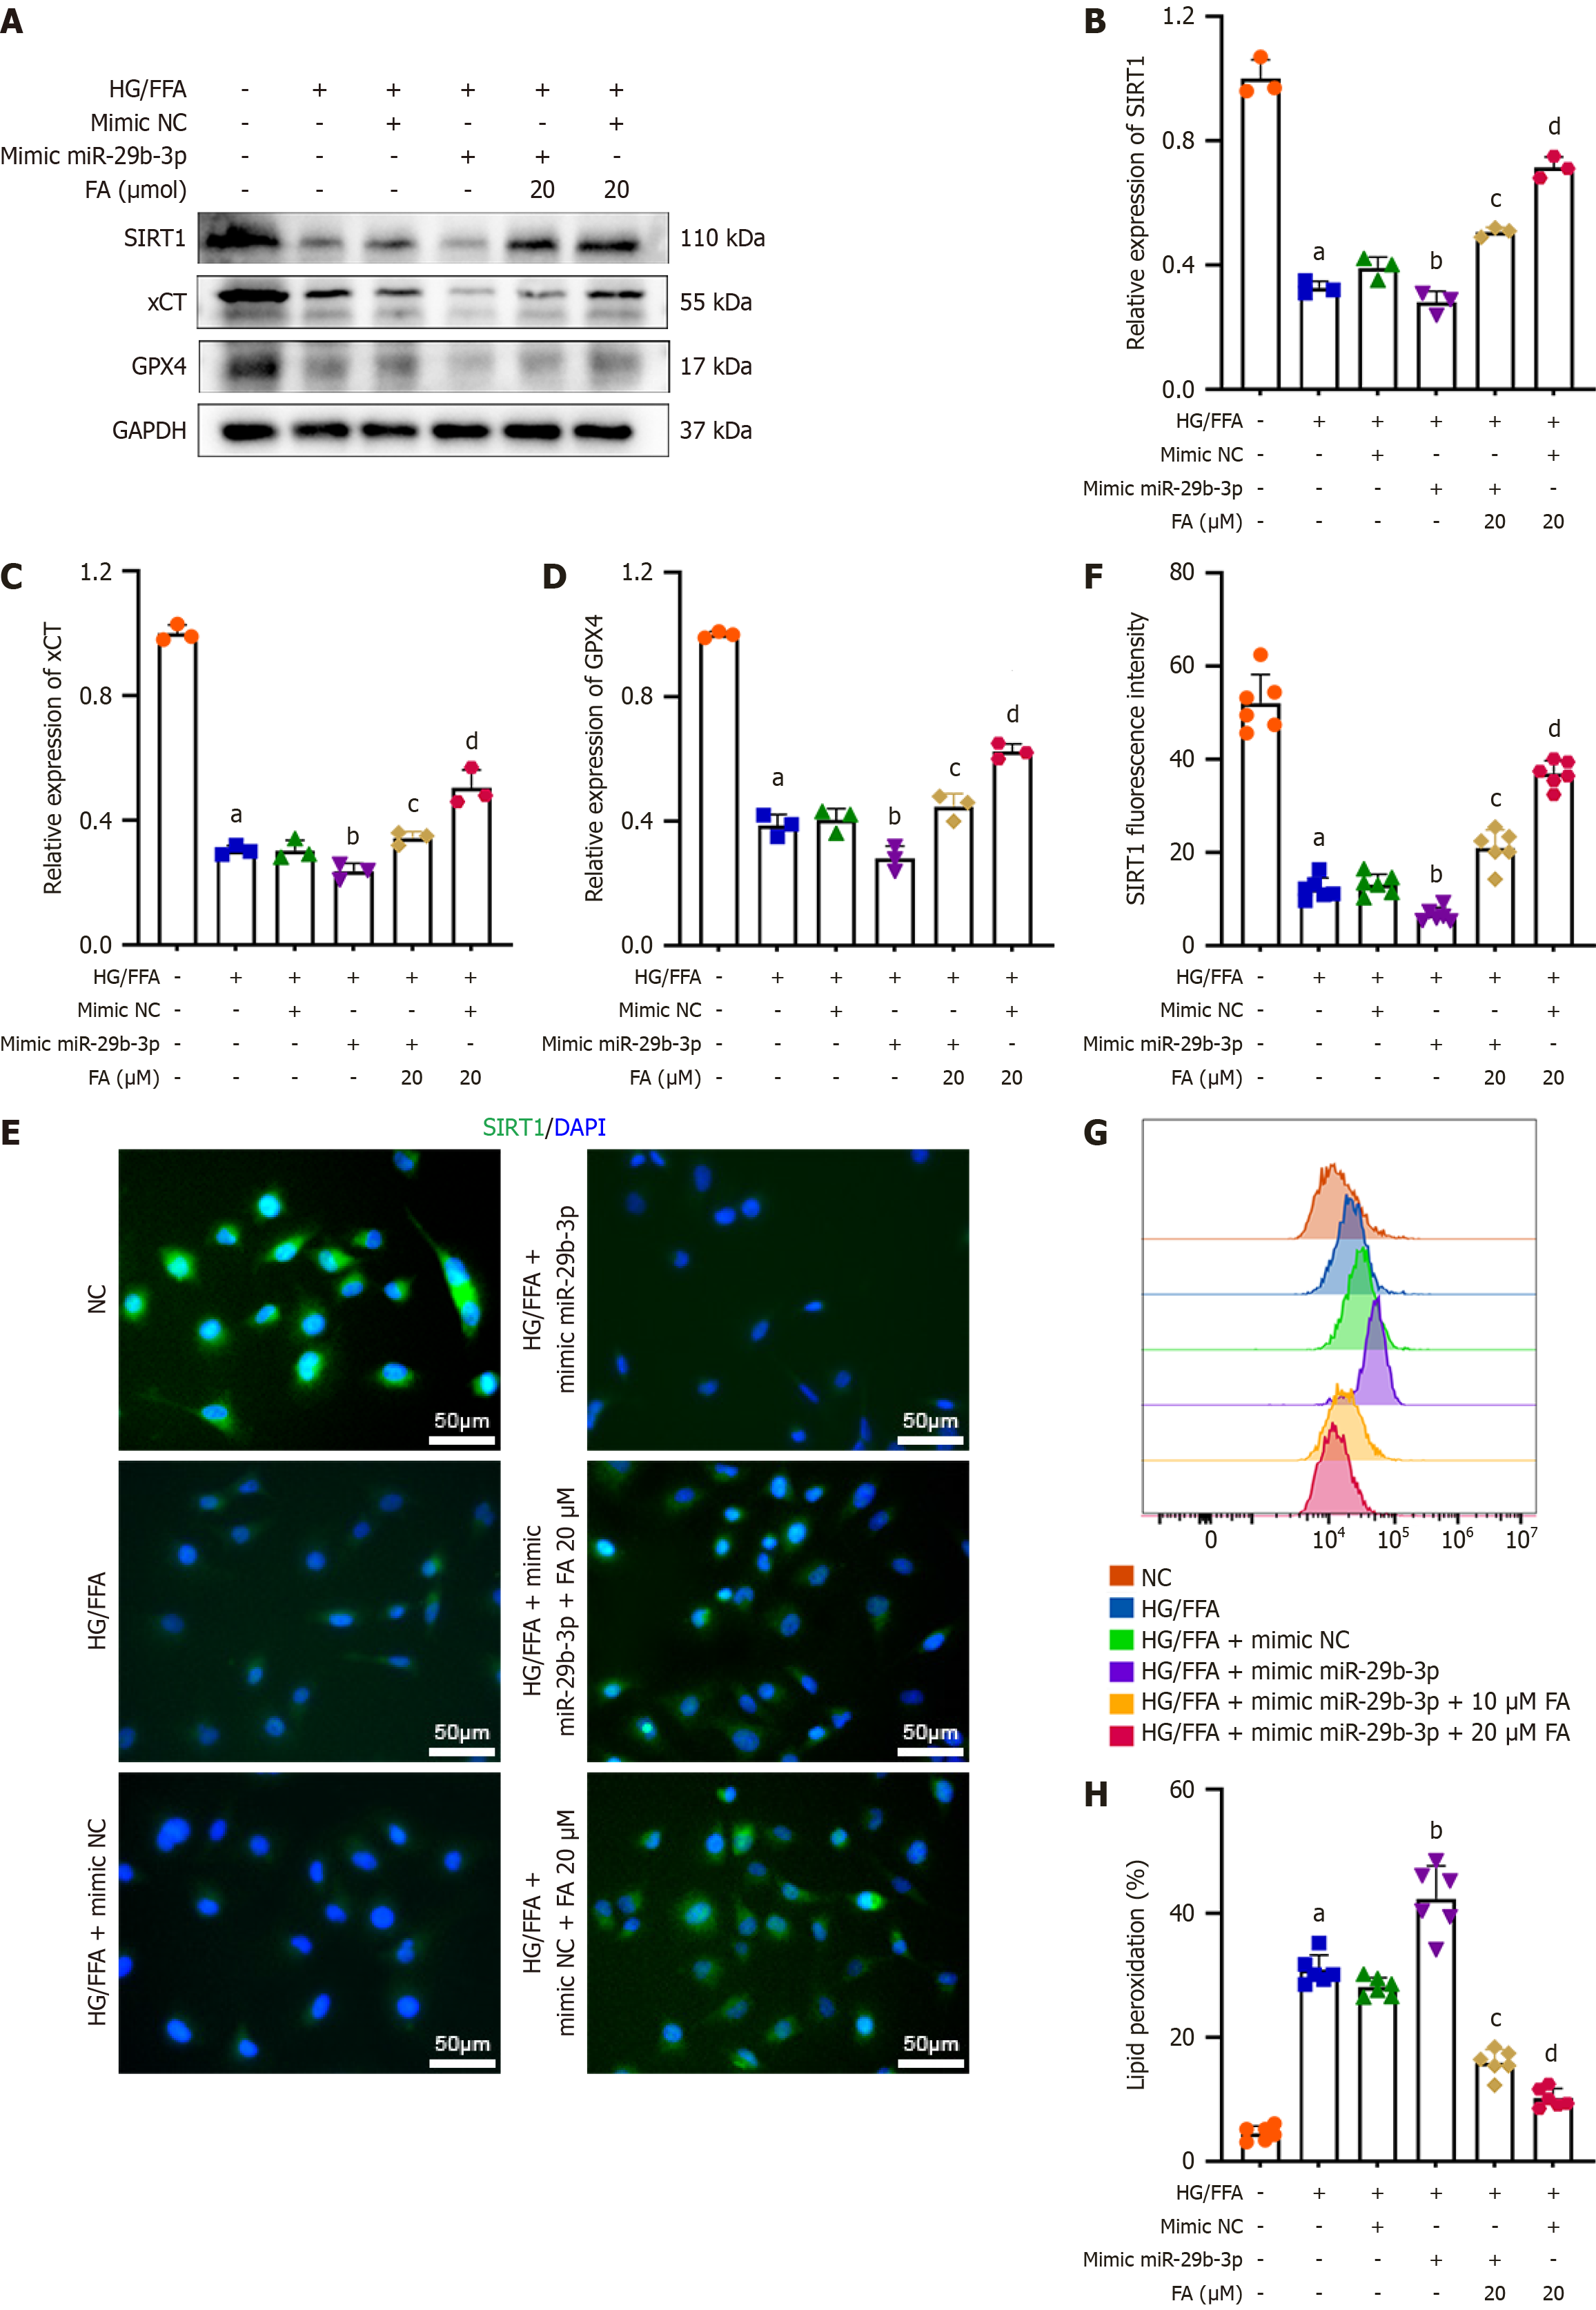
Figure 8 Farrerol inhibits high glucose and free fatty acid-induced ferroptosis via inhibition of miR-29b-3p in endothelial cells.
A-D: Protein expression of SIRT1, GPX4 and xCT were detected in endothelial cells (ECs) upon high glucose and free fatty acid, together with Farrerol or miR-29b-3p (n = 3); E and F: Representative immunofluorescence images of SIRT1 in ECs from indicated group. Bar = 50 μm. n = 6; G-H: Flow cytometry is used to detect the changes in lipid peroxidation levels in ECs under different treatment conditions (n = 6). aP < 0.05 vs NC; bP < 0.05 vs HG/FFA + mimic NC; cP < 0.05 vs HG/FFA + miR-29b-3p mimic; dP < 0.05 vs HG/FFA + FA + mimic NC. HG/FFA: High glucose and free fatty acid; FA: Farrerol.
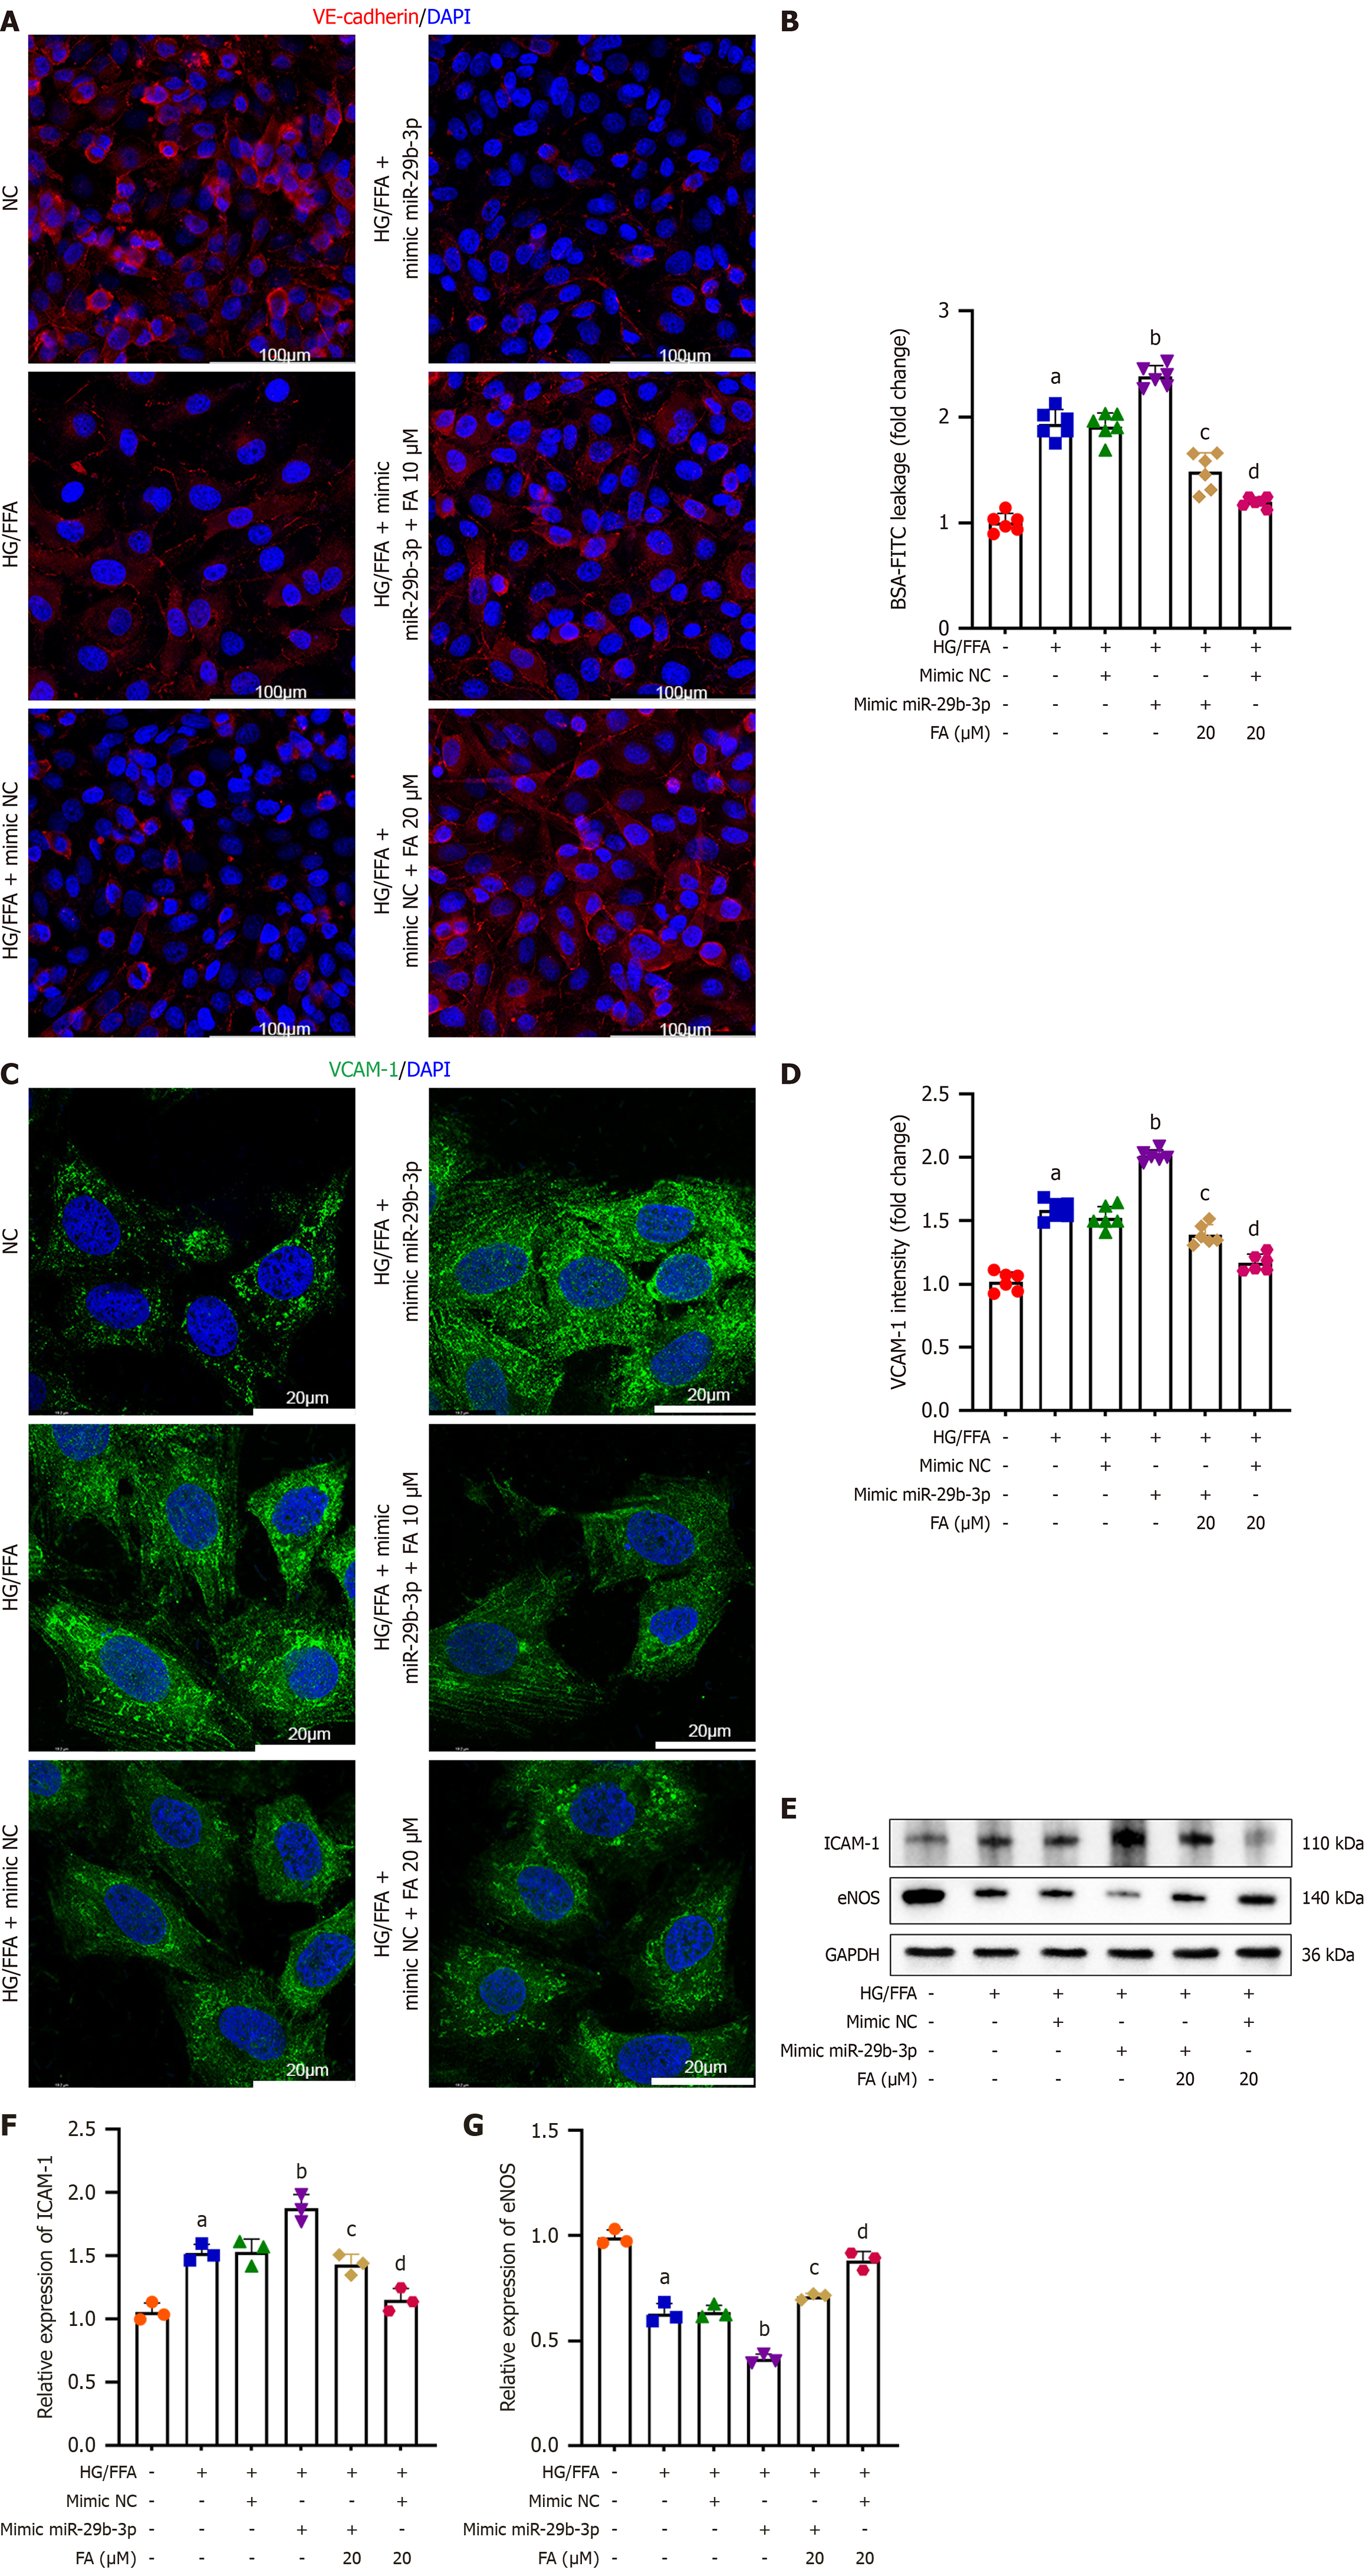
Figure 9 Farrerol alleviates high glucose and free fatty acid-induced endothelial cell dysfunction via inhibition of miR-29b-3p.
A and B: Representative immunofluorescence images and quantitative analysis of the intensity endothelial anchoring junctions (VE-cadherin). Bar = 100 μm. n = 6; C and D: Representative images of immunofluorescence staining of intercellular adhesion molecule-1 (VCAM-1) and quantitative analysis of VCAM-1 intensity. Bar = 20 μm. n = 6; E-G: Western blots analysis and quantitative data of VCAM-1 and endothelial nitric oxide synthase expression in high glucose and free fatty acid treated endothelial cells (n = 3). aP < 0.05 vs NC; bP < 0.05 vs HG/FFA + mimic NC; cP < 0.05 vs HG/FFA + miR-29b-3p mimic; dP < 0.05 vs HG/FFA + FA + mimic NC. eNOS: Endothelial nitric oxide synthase; ICAM-1: Intercellular adhesion molecule-1; HG/FFA: High glucose and free fatty acid; FA: Farrerol.
Figure 10 SIRT1 was involved in the protective effects of Farrerol and miR-29b-3p on high glucose and free fatty acid-induced endothelial cells dysfunction.
A: Knockdown of SIRT1 was achieved by transfected siRNA into Human umbilical vein Endothelial cells and confirmed by western blot analysis (n = 3); B: Cell viability was detected via cell counting kit-8 (CCK-8) assay in endothelial cells (ECs) after indicated treatments (n = 6); C-E: Western blots analysis and quantitative data of GPX4 and xCT expression in high glucose and free fatty acid (HG/FFA) treated ECs (n = 3); F: Representative immunofluorescence images of the intensity endothelial anchoring junctions (VE-cadherin). Bar = 100 μm; G: In vitro endothelial monolayer permeability was determined based on FITC-BSA leakage (n = 6 per group); H: Cell viability was detected via CCK-8 assay in ECs with SIRT silencing (n = 6); I-K: Western blots analysis and quantitative data of GPX4 and xCT expression in HG/FFA treated ECs (n = 3); L: Representative immunofluorescence images of the intensity endothelial anchoring junctions (VE-cadherin). Bar = 100 μm; M: In vitro endothelial monolayer permeability was determined based on FITC-BSA leakage (n = 6 per group). aP < 0.05 vs NC; bP < 0.05 vs HG/FFA; cP < 0.05 vs HG/FFA + miR-29b-3p mimic. HG/FFA: High glucose and free fatty acid.
- Citation: Guo Y, Yu XR, Gu HD, Wang YJ, Yang ZG, Chi JF, Zhang LP, Lin H. Farrerol ameliorates diabetic cardiomyopathy by inhibiting ferroptosis via miR-29b-3p/SIRT1 signaling pathway in endothelial cells. World J Diabetes 2025; 16(9): 109553
- URL: https://www.wjgnet.com/1948-9358/full/v16/i9/109553.htm
- DOI: https://dx.doi.org/10.4239/wjd.v16.i9.109553


