Copyright
©The Author(s) 2025.
World J Diabetes. Jun 15, 2025; 16(6): 105496
Published online Jun 15, 2025. doi: 10.4239/wjd.v16.i6.105496
Published online Jun 15, 2025. doi: 10.4239/wjd.v16.i6.105496
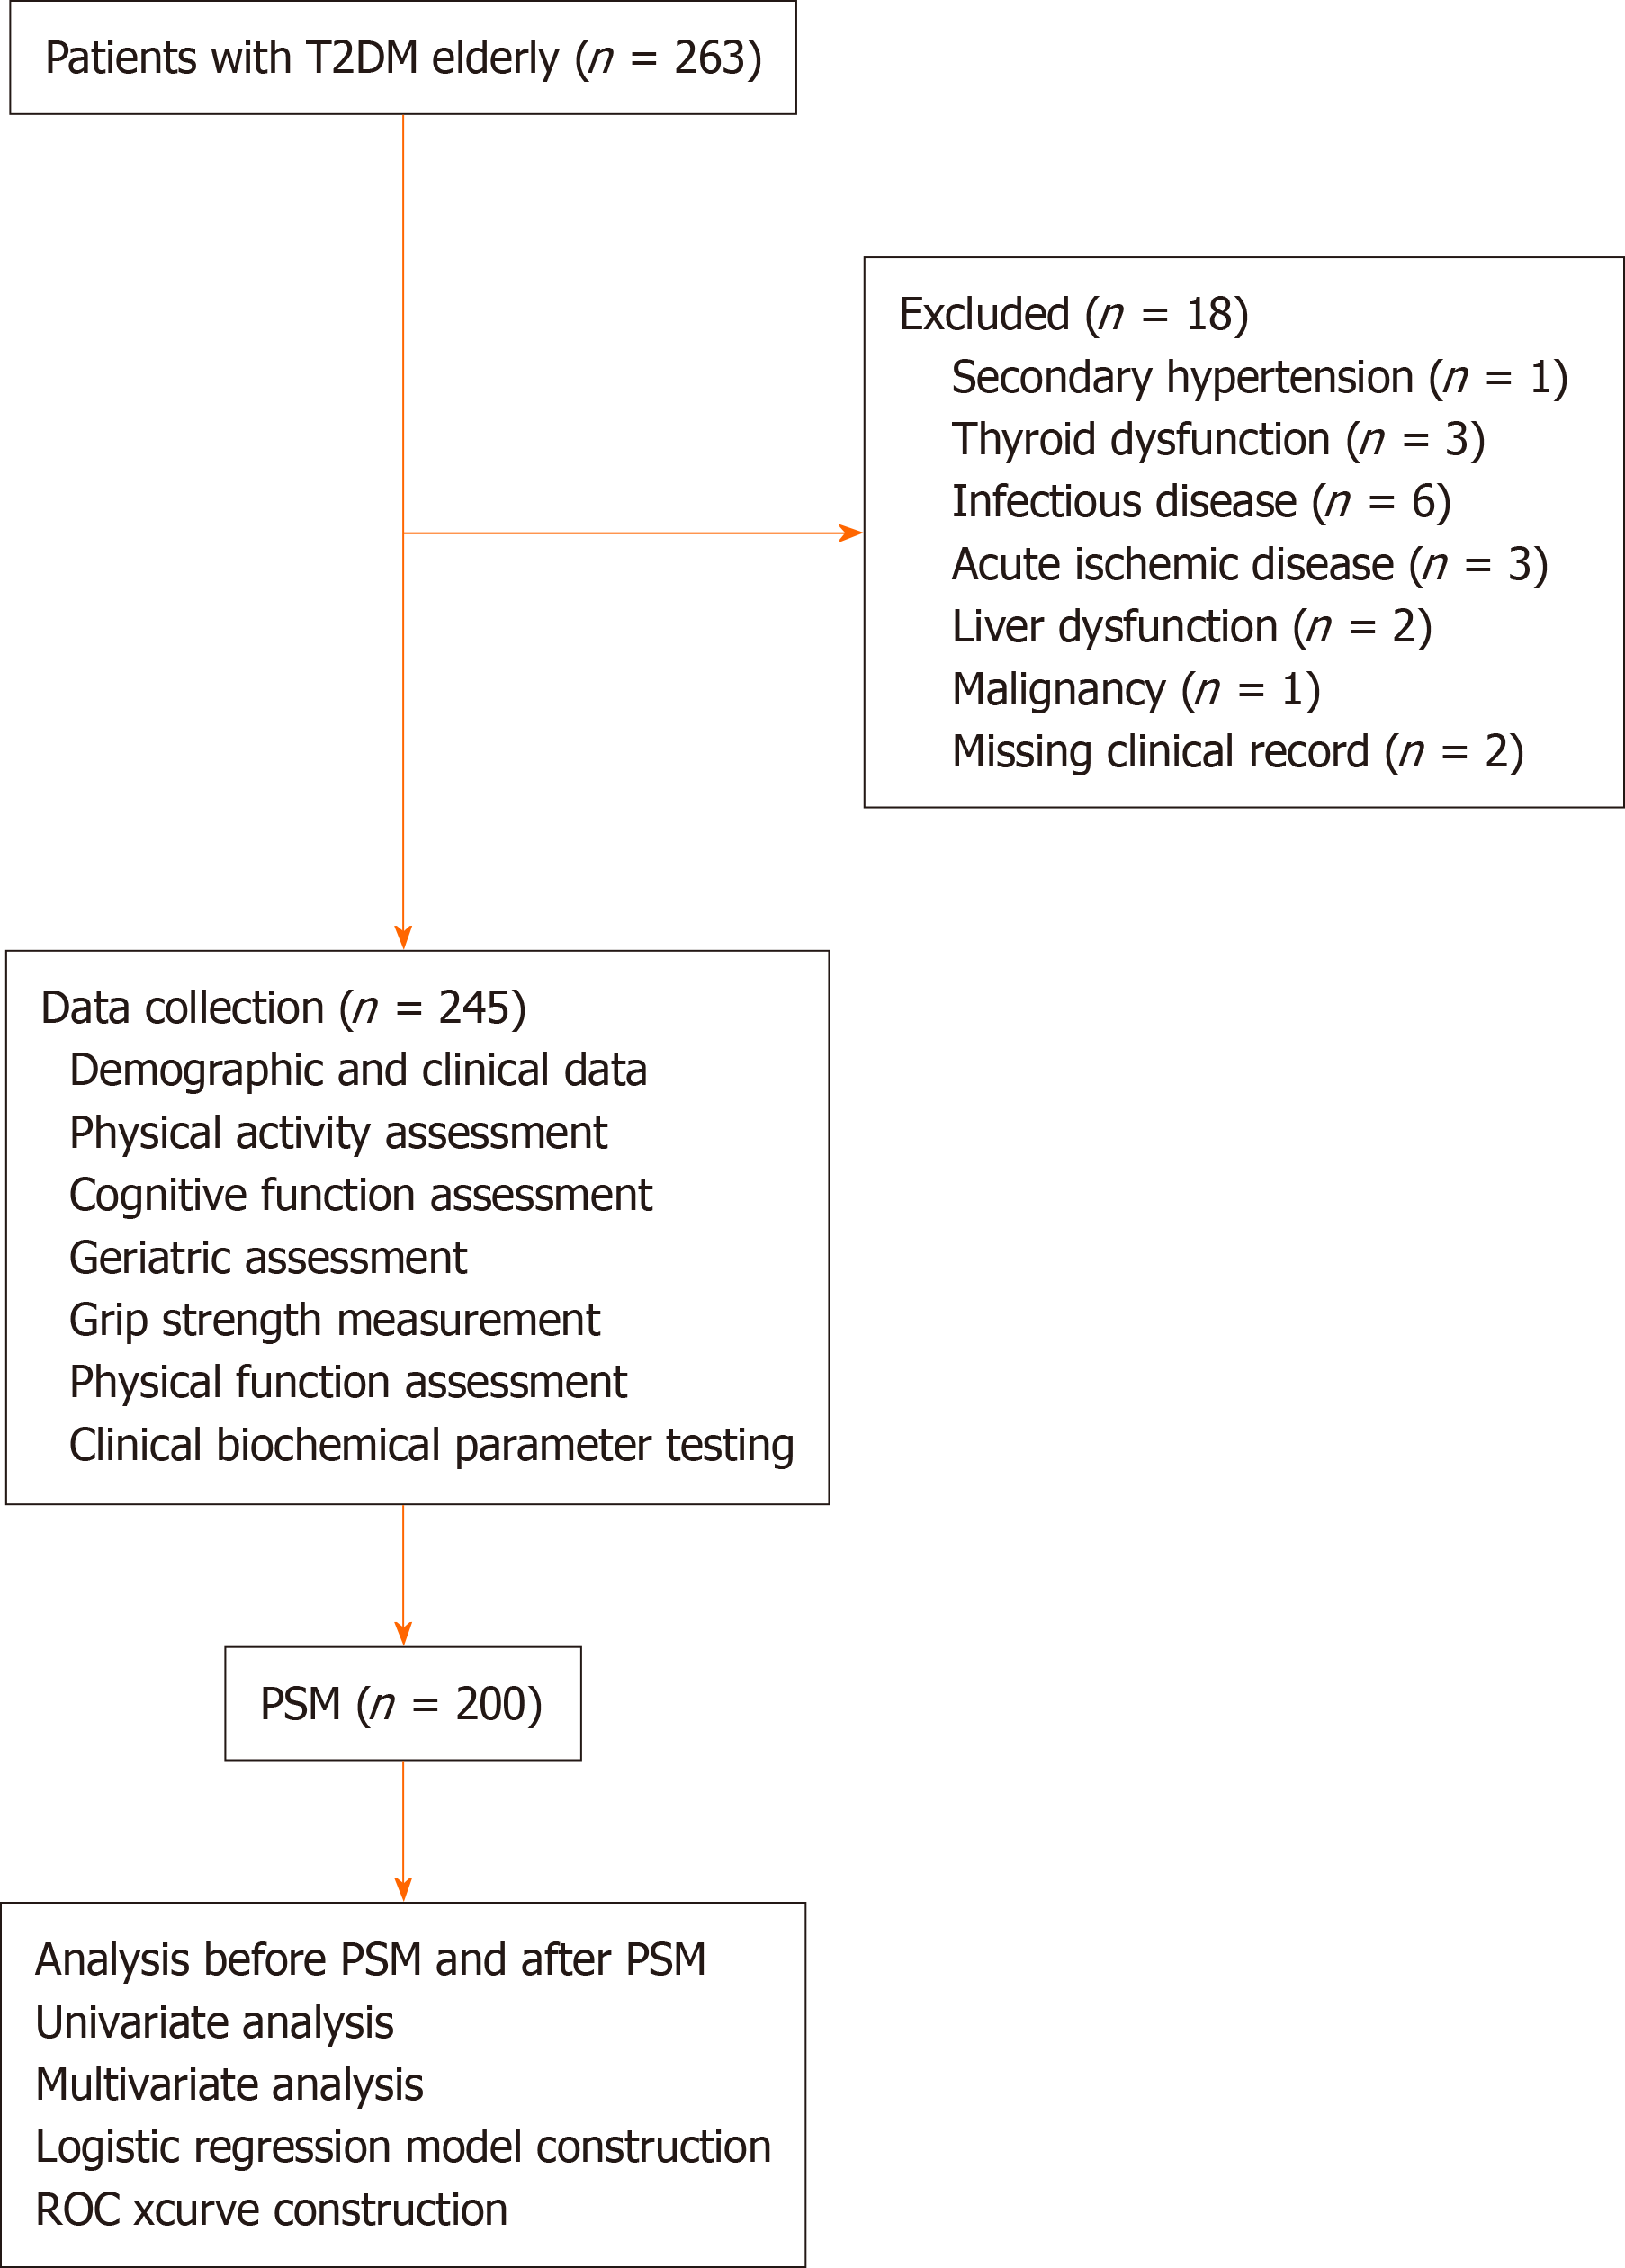
Figure 1 The flow diagram of the study.
T2DM: Type 2 diabetes mellitus; PSM: Propensity score matching; ROC: Receiver operating characteristic.
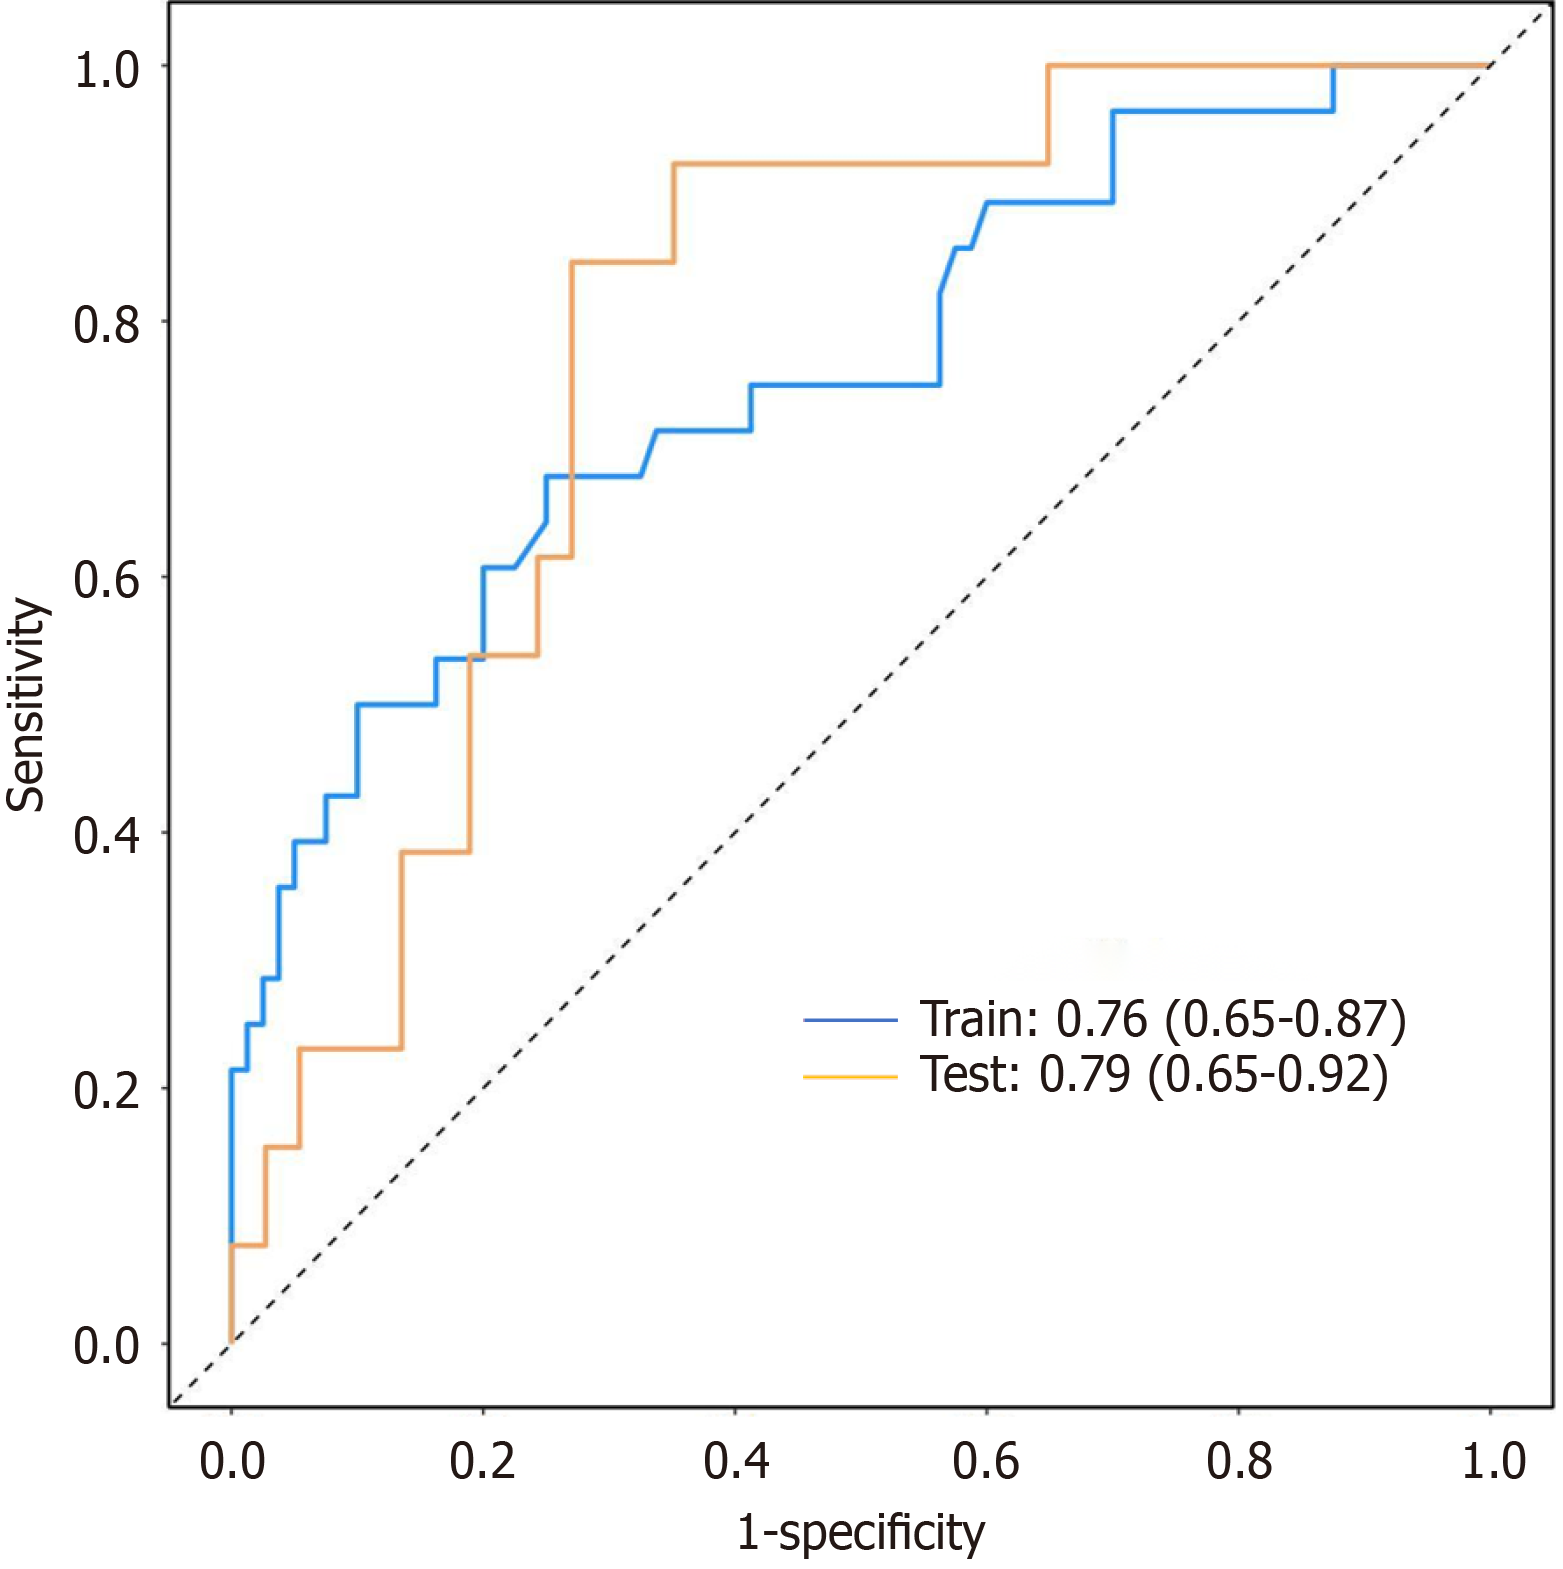
Figure 2 Receiver operating characteristic curve analysis of the performance of the developed risk model for cognitive decline in elderly type 2 diabetes mellitus patients.
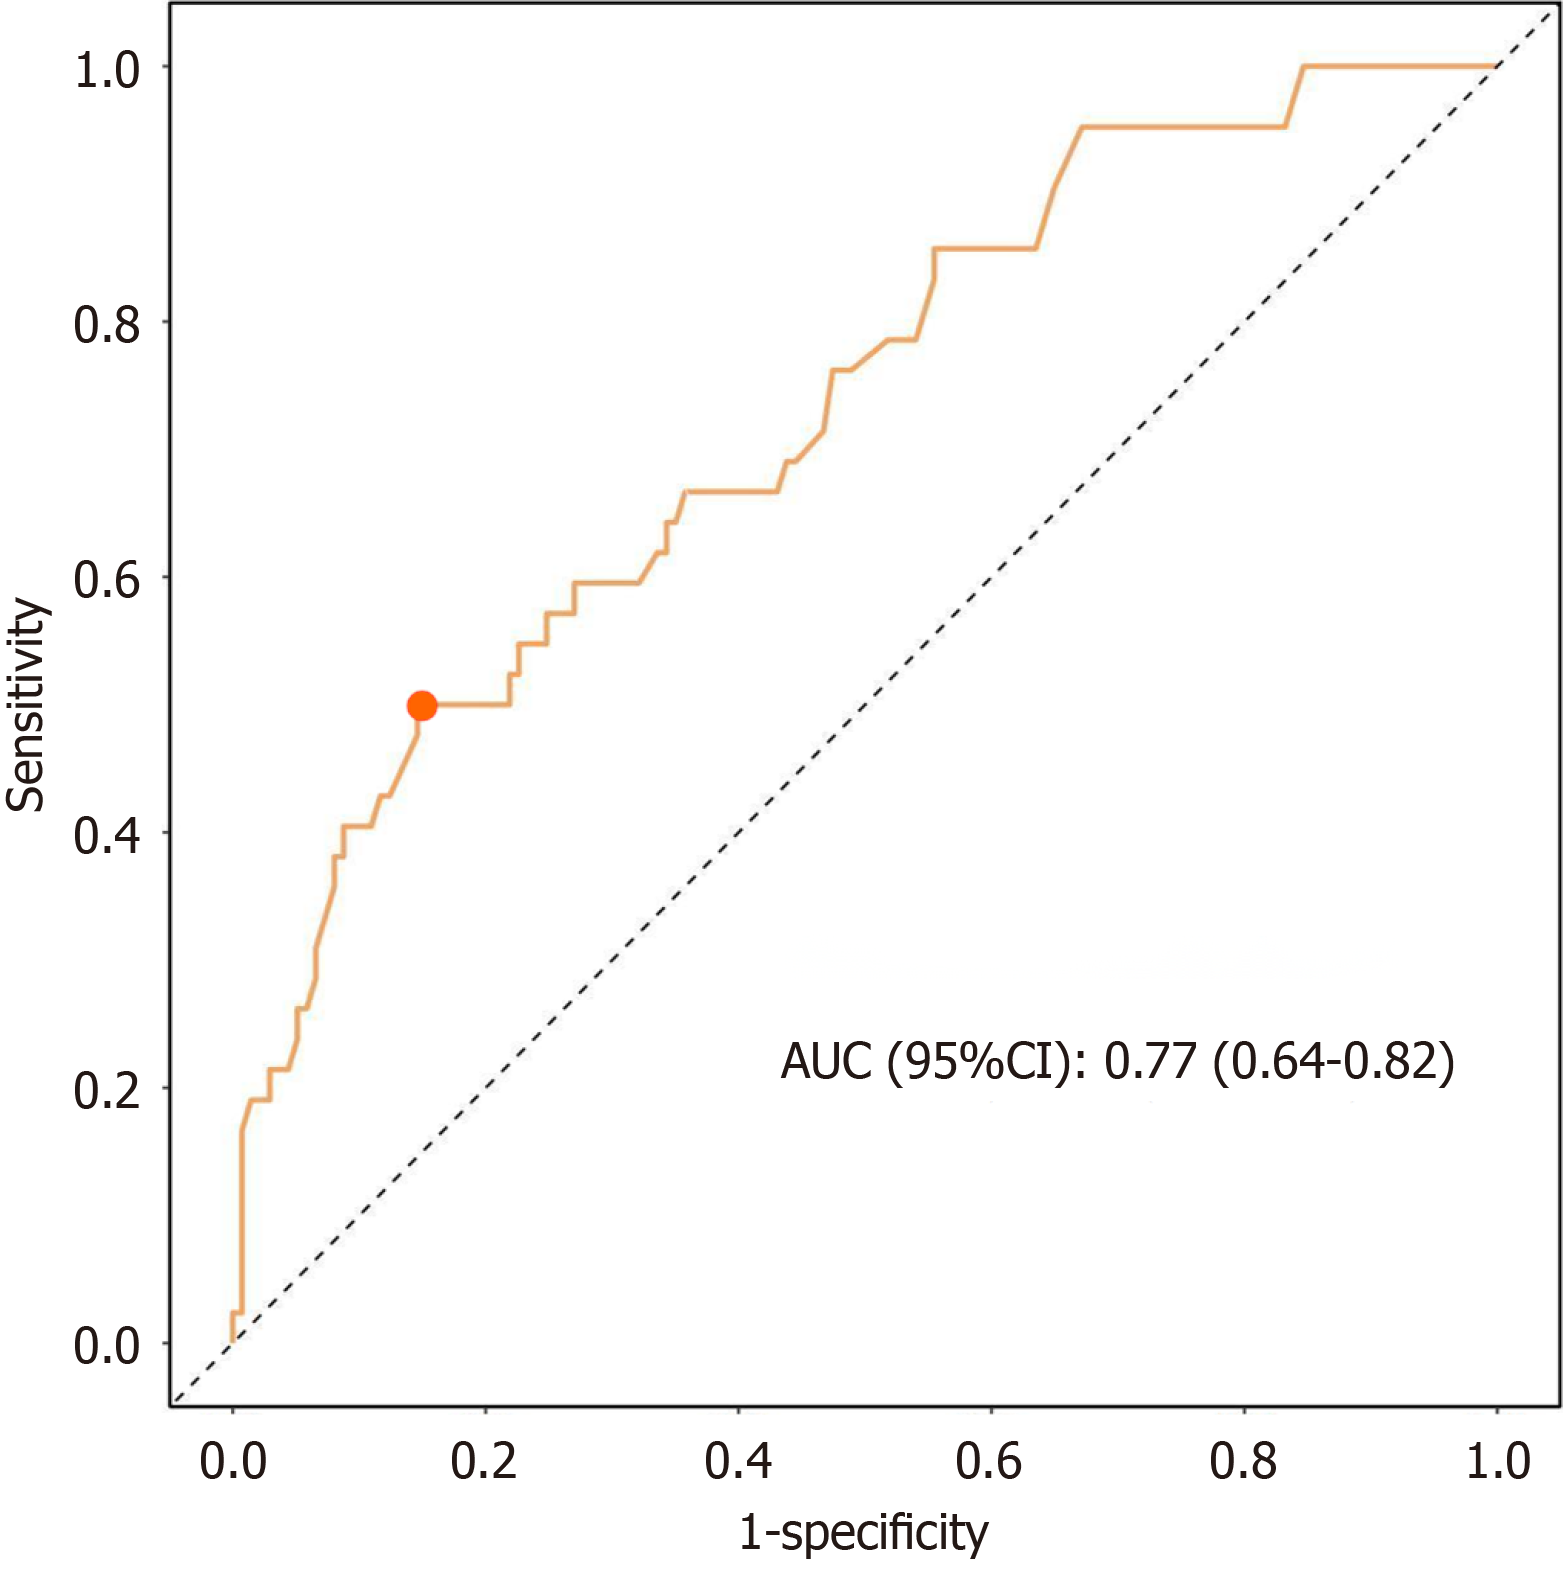
Figure 3 Predictive model for cognitive function using age, occupation type, mini nutritional assessment, instrumental activities of daily living, and stroke history.
AUC: Area under the curve.
- Citation: Ma YX, Li J, Si SC, Zhao H, Liu J, Lv LF, Yang K, Yang W. Does low physical activity cause cognitive decline in elderly type 2 diabetes patients: A propensity score matching analysis. World J Diabetes 2025; 16(6): 105496
- URL: https://www.wjgnet.com/1948-9358/full/v16/i6/105496.htm
- DOI: https://dx.doi.org/10.4239/wjd.v16.i6.105496


