Copyright
©The Author(s) 2025.
World J Diabetes. Jun 15, 2025; 16(6): 104177
Published online Jun 15, 2025. doi: 10.4239/wjd.v16.i6.104177
Published online Jun 15, 2025. doi: 10.4239/wjd.v16.i6.104177
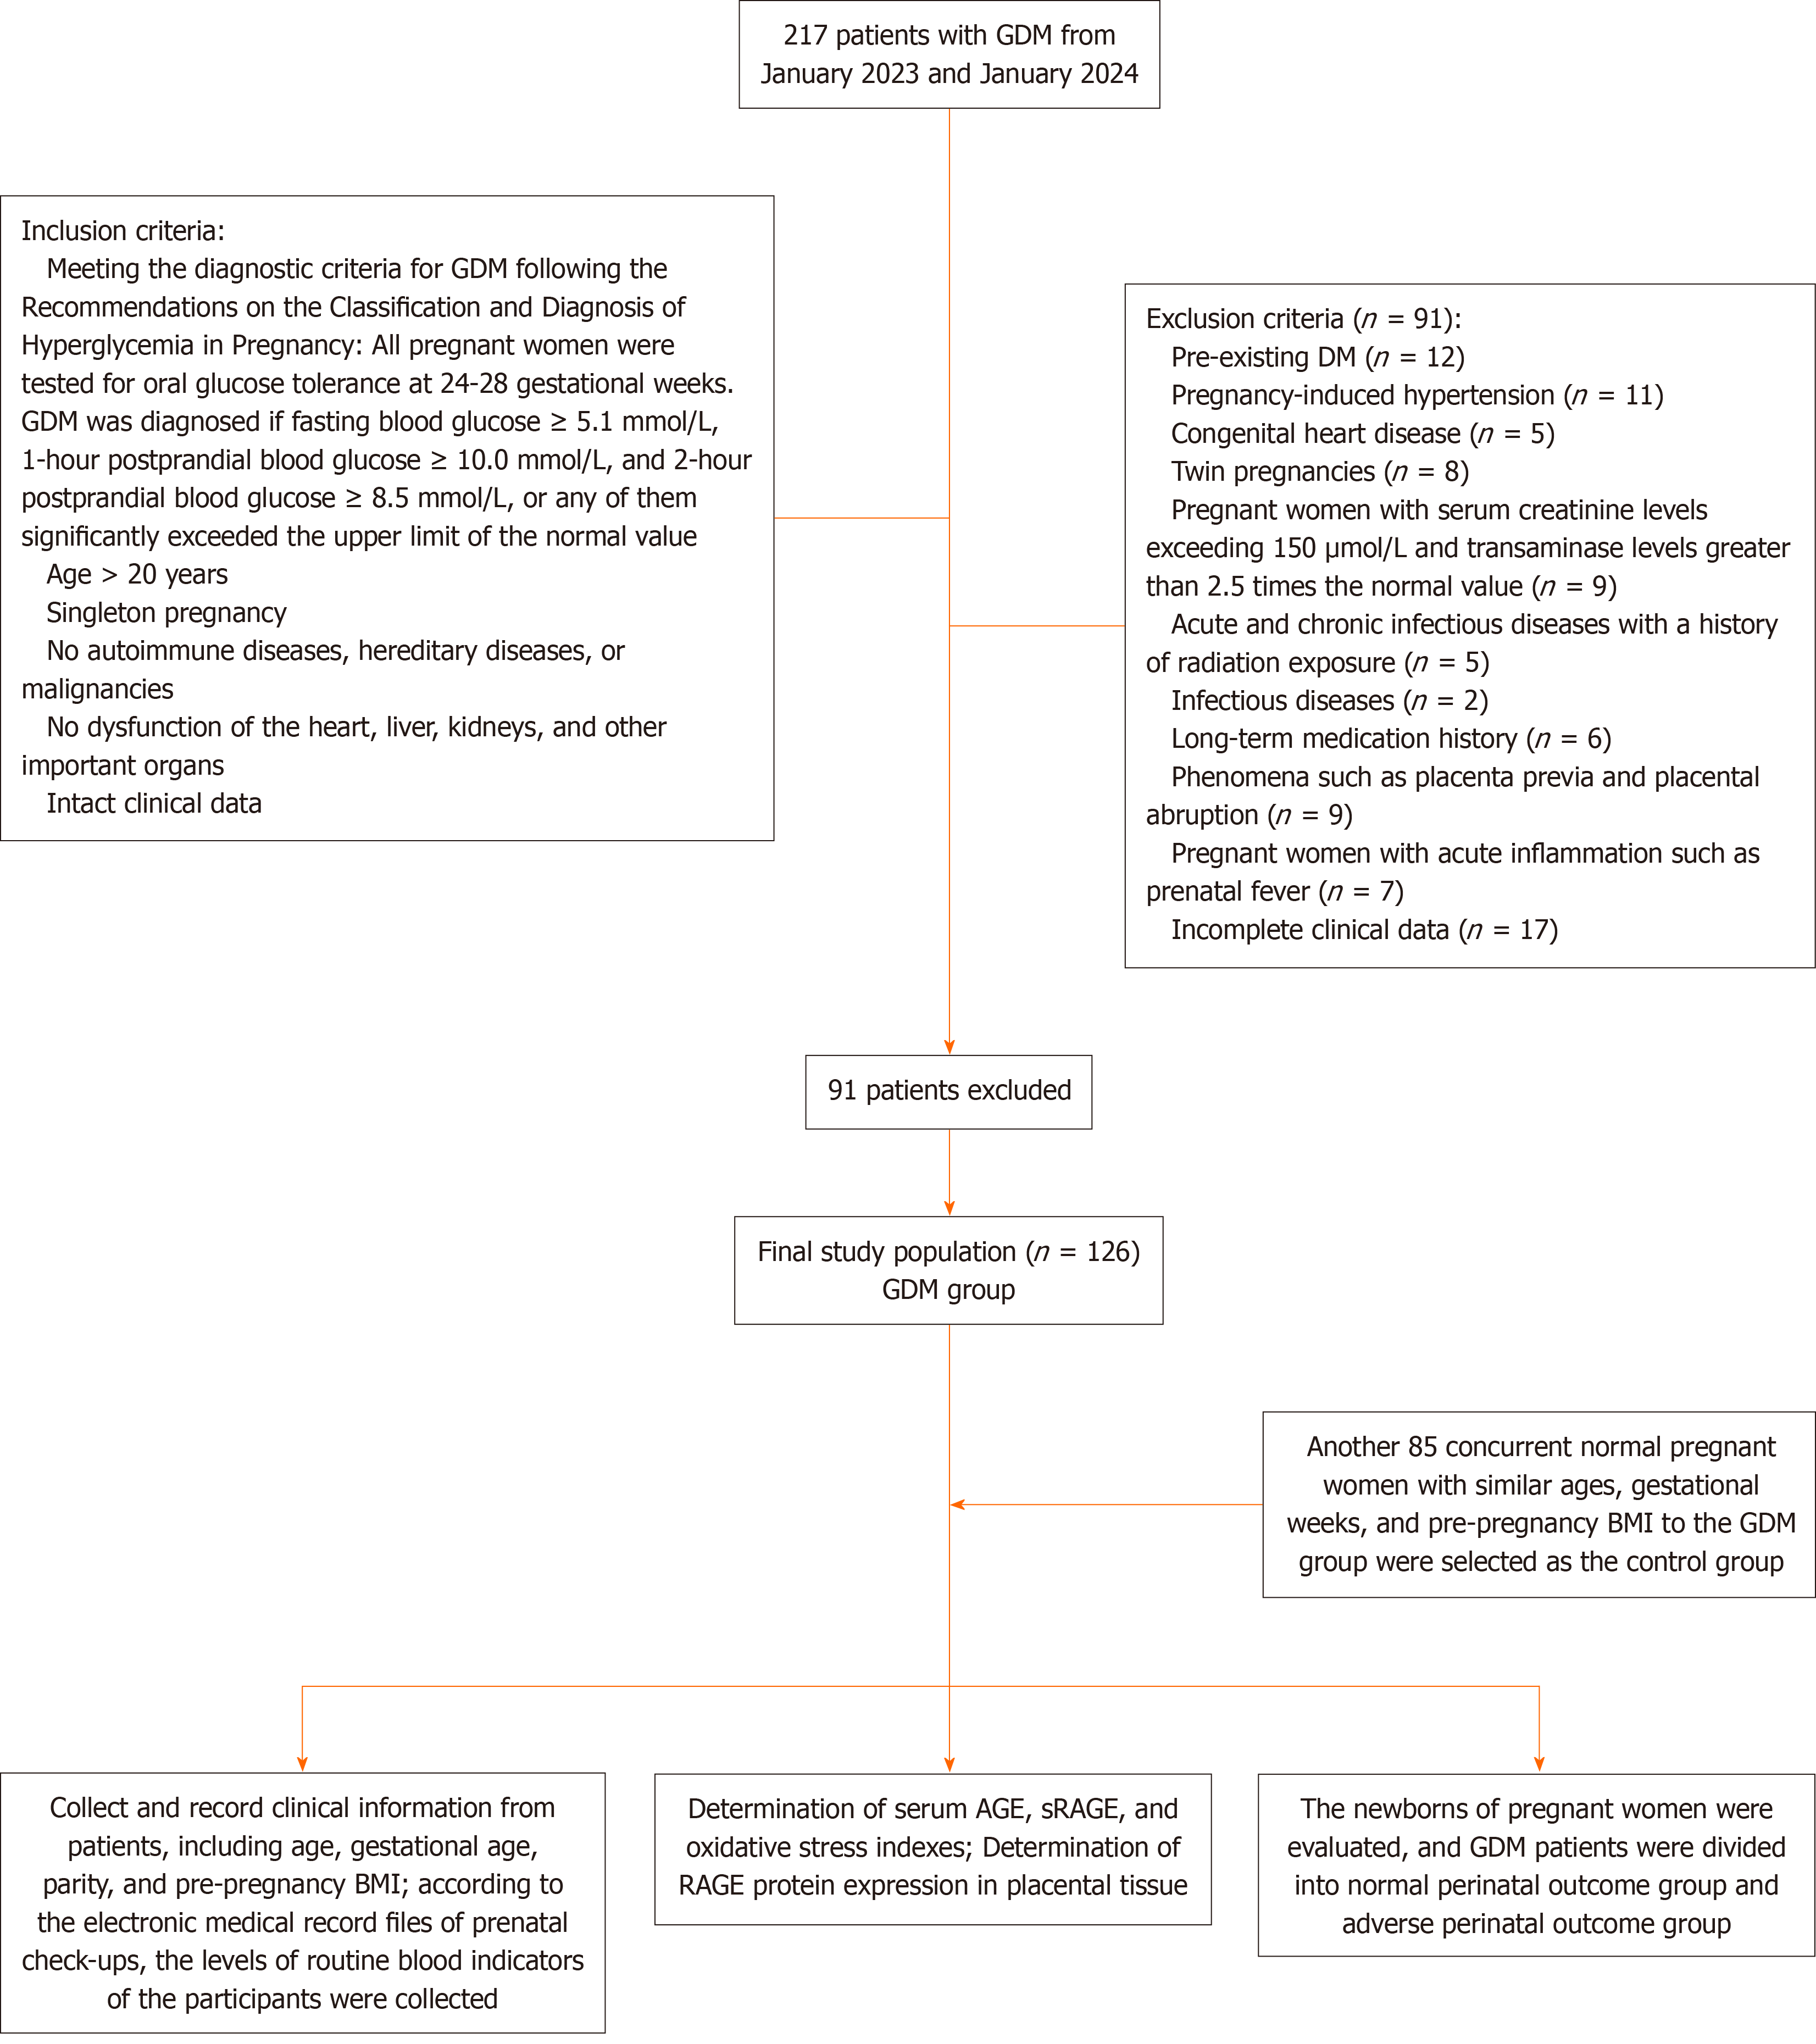
Figure 1 Flow diagram of the patient selection.
GDM: Gestational diabetes mellitus; DM: Diabetes mellitus; BMI: Body mass index; AGE: Advanced glycation end-product; sRAGE: Soluble advanced glycation end-product receptor; RAGE: Advanced glycation end-product receptor.
Figure 2 Receptors for soluble advanced glycation end-product protein expression in placental tissues of pregnant women in the two groups.
GDM: Gestational diabetes mellitus; sRAGE: Soluble advanced glycation end-product receptor; aP < 0.001.
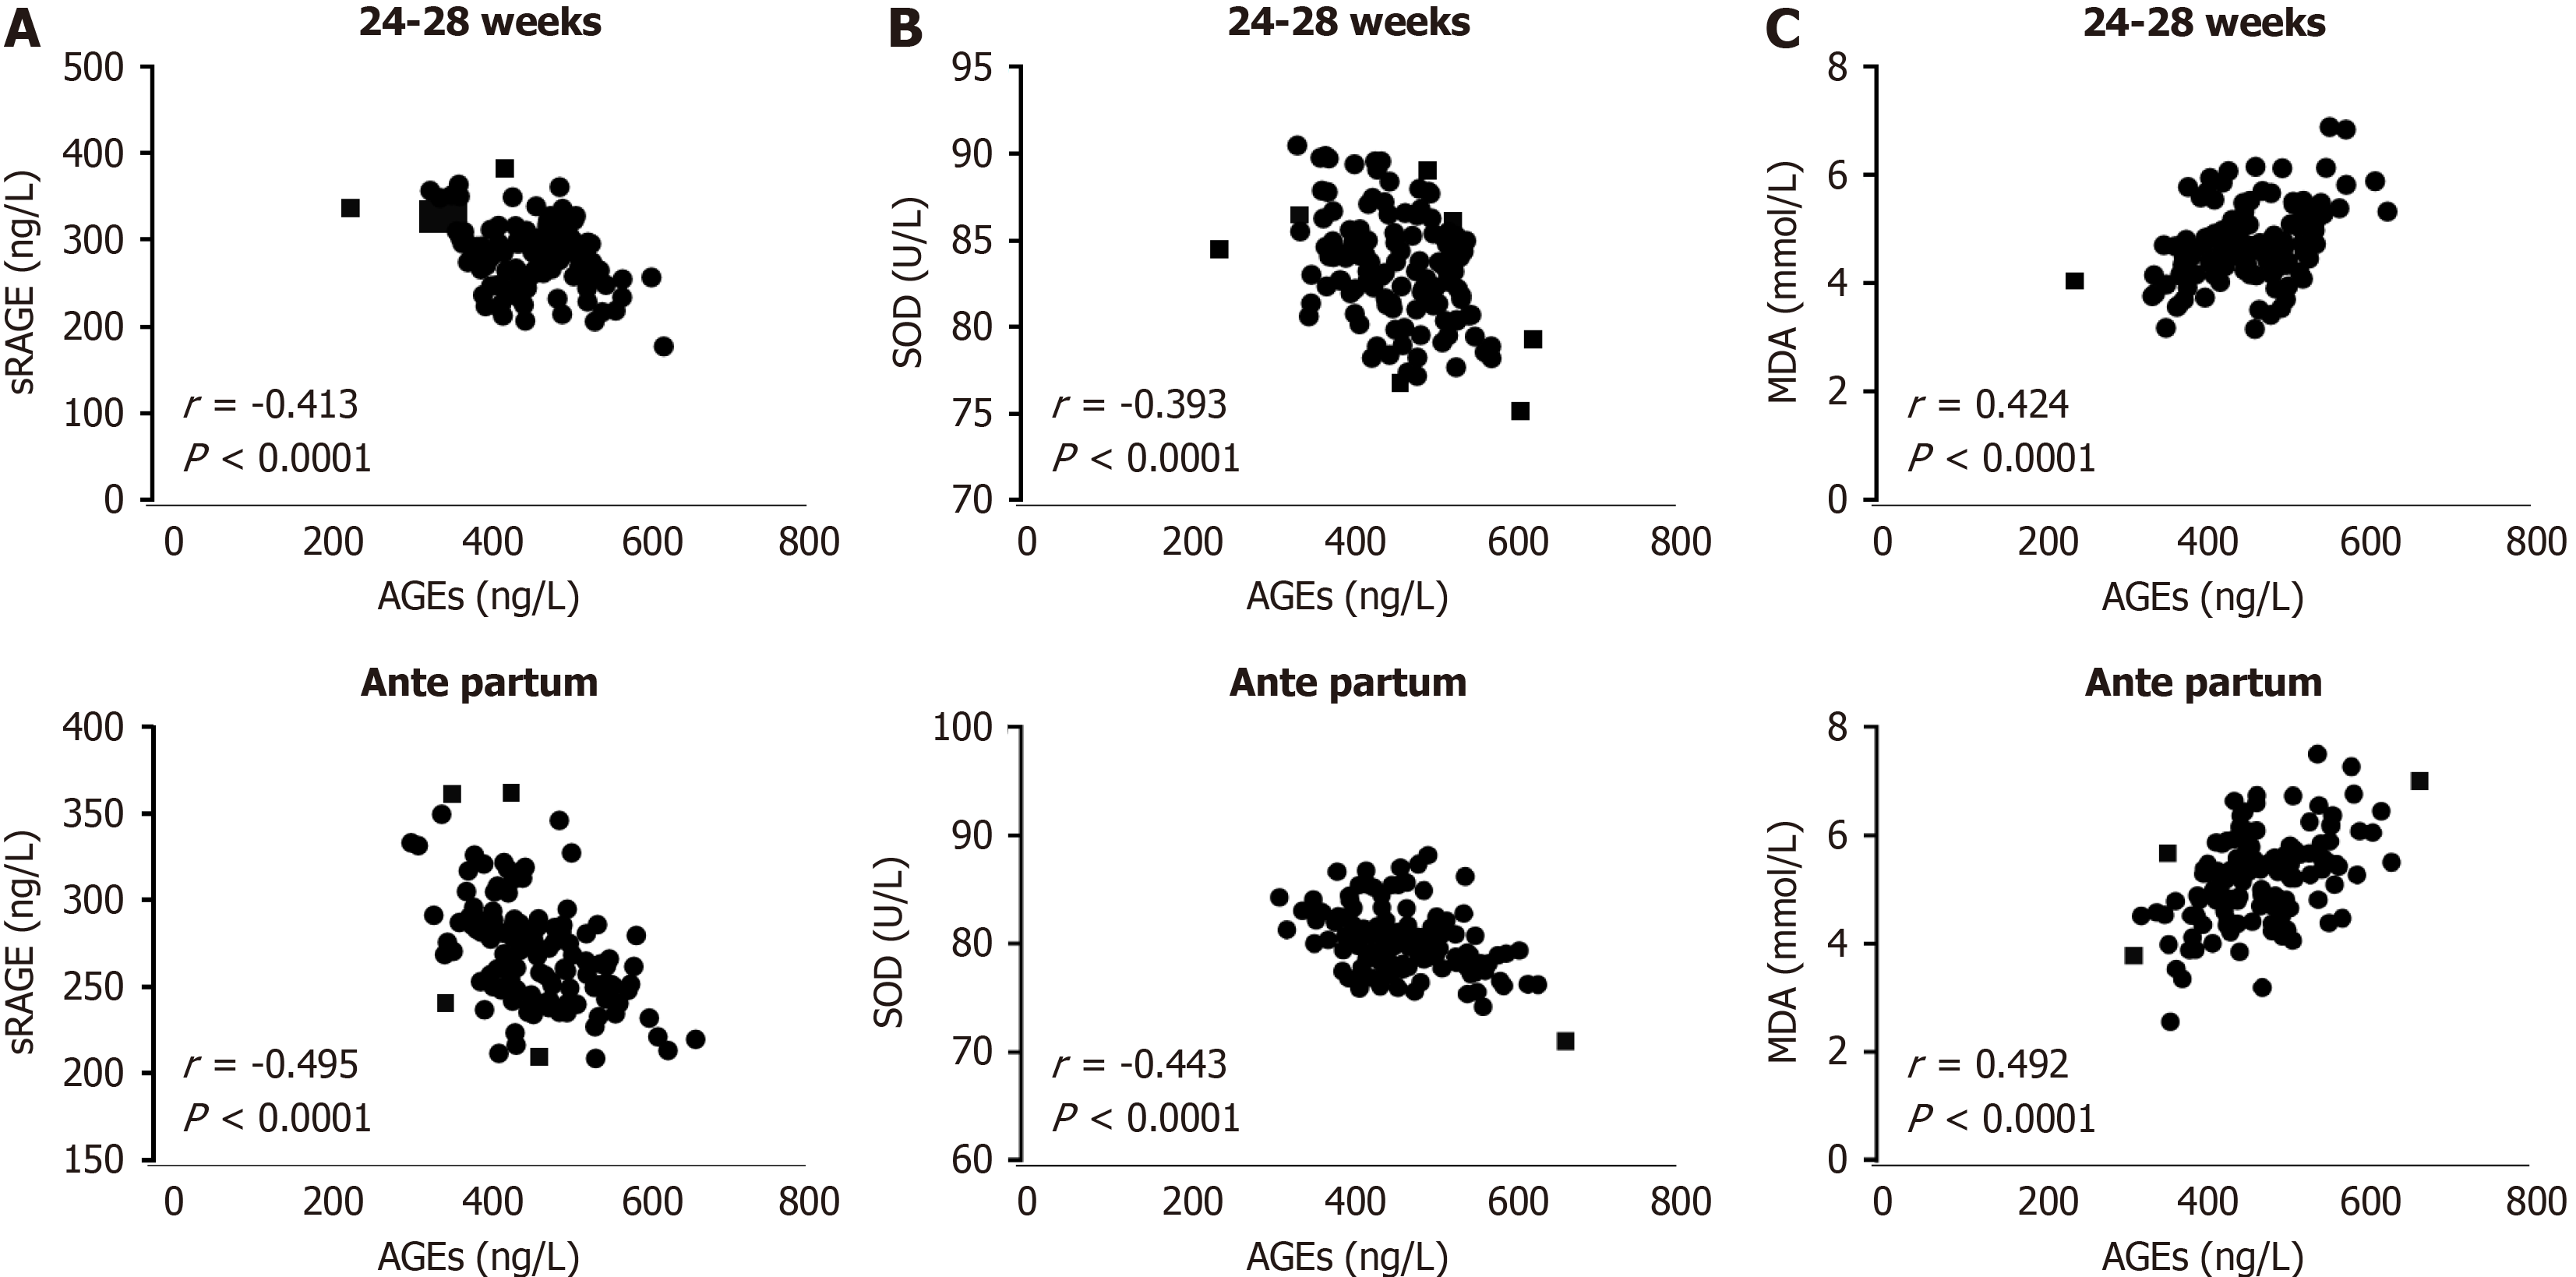
Figure 3 Correlation of serum indicators in pregnant women in the gestational diabetes mellitus group.
A: Correlation between serum advanced glycation end-products (AGEs) and soluble AGE receptor levels at 24-28 weeks of gestation and before delivery; B: Correlation between serum AGEs and superoxide dismutase levels at 24-28 weeks of gestation and before delivery; C: Correlation between serum AGEs and malondialdehyde levels at 24-28 weeks of gestation and before delivery. sRAGE: Soluble advanced glycation end-product receptor; SOD: Superoxide dismutase; MDA: Malondialdehyde; AGEs: Advanced glycation end-products.
- Citation: Zhang Y, Li T, Wang ZH, Liu Y. Correlation between serum advanced glycation end-products and their receptor-mediated oxidative stress and perinatal outcomes in gestational diabetes mellitus. World J Diabetes 2025; 16(6): 104177
- URL: https://www.wjgnet.com/1948-9358/full/v16/i6/104177.htm
- DOI: https://dx.doi.org/10.4239/wjd.v16.i6.104177


