Copyright
©The Author(s) 2025.
World J Diabetes. Jun 15, 2025; 16(6): 103370
Published online Jun 15, 2025. doi: 10.4239/wjd.v16.i6.103370
Published online Jun 15, 2025. doi: 10.4239/wjd.v16.i6.103370
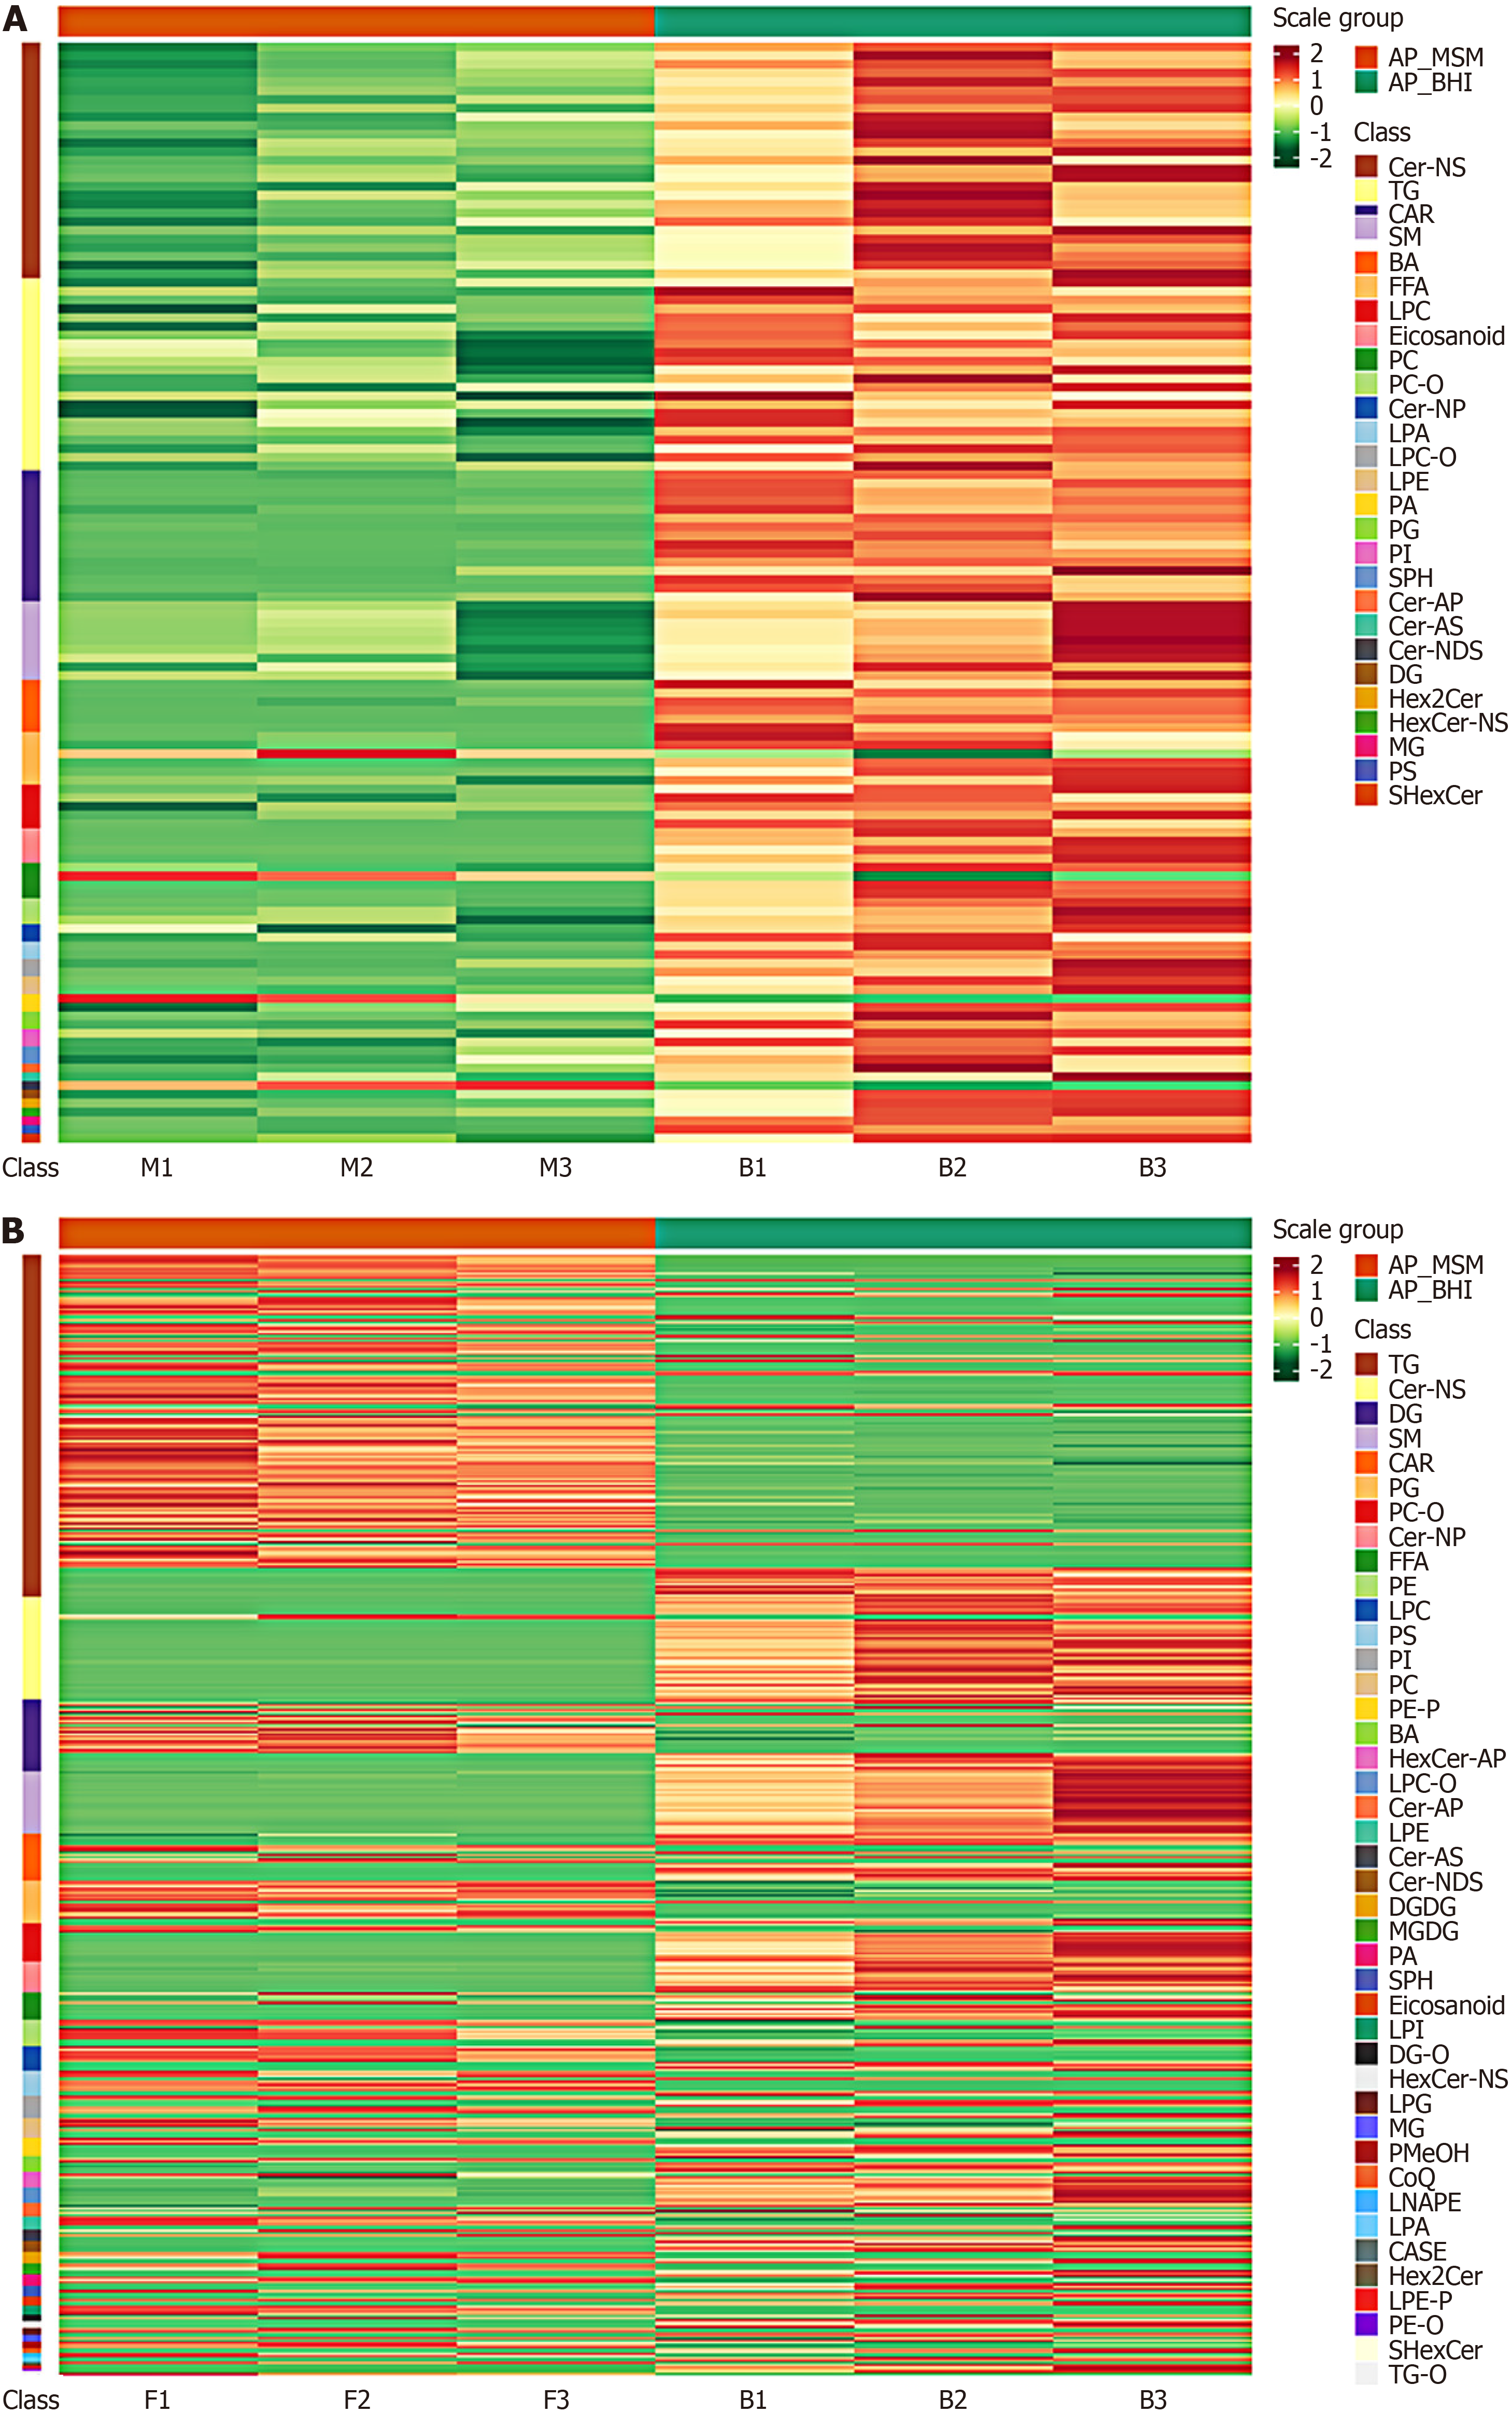
Figure 1 Cluster heatmap of differential lipids between groups.
A: Mineral salt medium (MSM) vs brain heart infusion (BHI); B: FF (i.e. rich in chromium and zinc group) vs BHI. Metabolomics testing was performed on Acetobacter pasteurianus from BHI culture, chromium-rich zinc-rich culture, and MSM culture. After normalization of different contents, red indicates high content and green indicates low content. In the figure, the cluster lines on the left represent lipid clustering, and those on the top represent sample clustering. AP: Alkylphospholipid; BA: Bile acid; CAR: Cardiolipin; CASE: Sitosterol acetate; Cer-AP: Ceramide-1-phosphate; Cer-AS: Ceramide-1-sulfate; Cer-NDS: Ceramide-N-phosphoethanolamine; Cer-NP: Ceramide-N-phosphocholine; CoQ: Coenzyme Q; DG: Diacylglycerol; DGDG: Digalactosyldiacyl glycerol; FFA: Free fatty acid; LPA: Lysophosphatidic acid; LPC-O: Lysophosphatidyl choline-plasmalogen; LPE: Lysophosphatidyl ethanolamine; LPE-P: Lysophosphatidyl ethanolamine-plasmalogen; LPG: Lysophosphatidyl glycerol; LPI: Lysophosphatidyl inositol; MG: Monoacylglycerol; MGDG: Monogalactosyldiacylglycerol; NS: N-sphingomyelin; PA: Phosphatidic acid; PC: Phosphatidylcholine; PC-O: Plasmalogen phosphatidylcholine; PE-O: Plasmalogen phosphatidylethanolamine; PE-P: Phosphatidylethanolamine-plasmalogen; PG: Phosphatidylglycerol; PI: Phosphatidylinositol; PMeOH: Phosphatidyl methanol; PS: Phosphatidylserine; SM: Sphingomyelin; SPH: Sphingosine; TG: Triacylglycerol; TG-O: Triacylglycerol-plasmalogen.
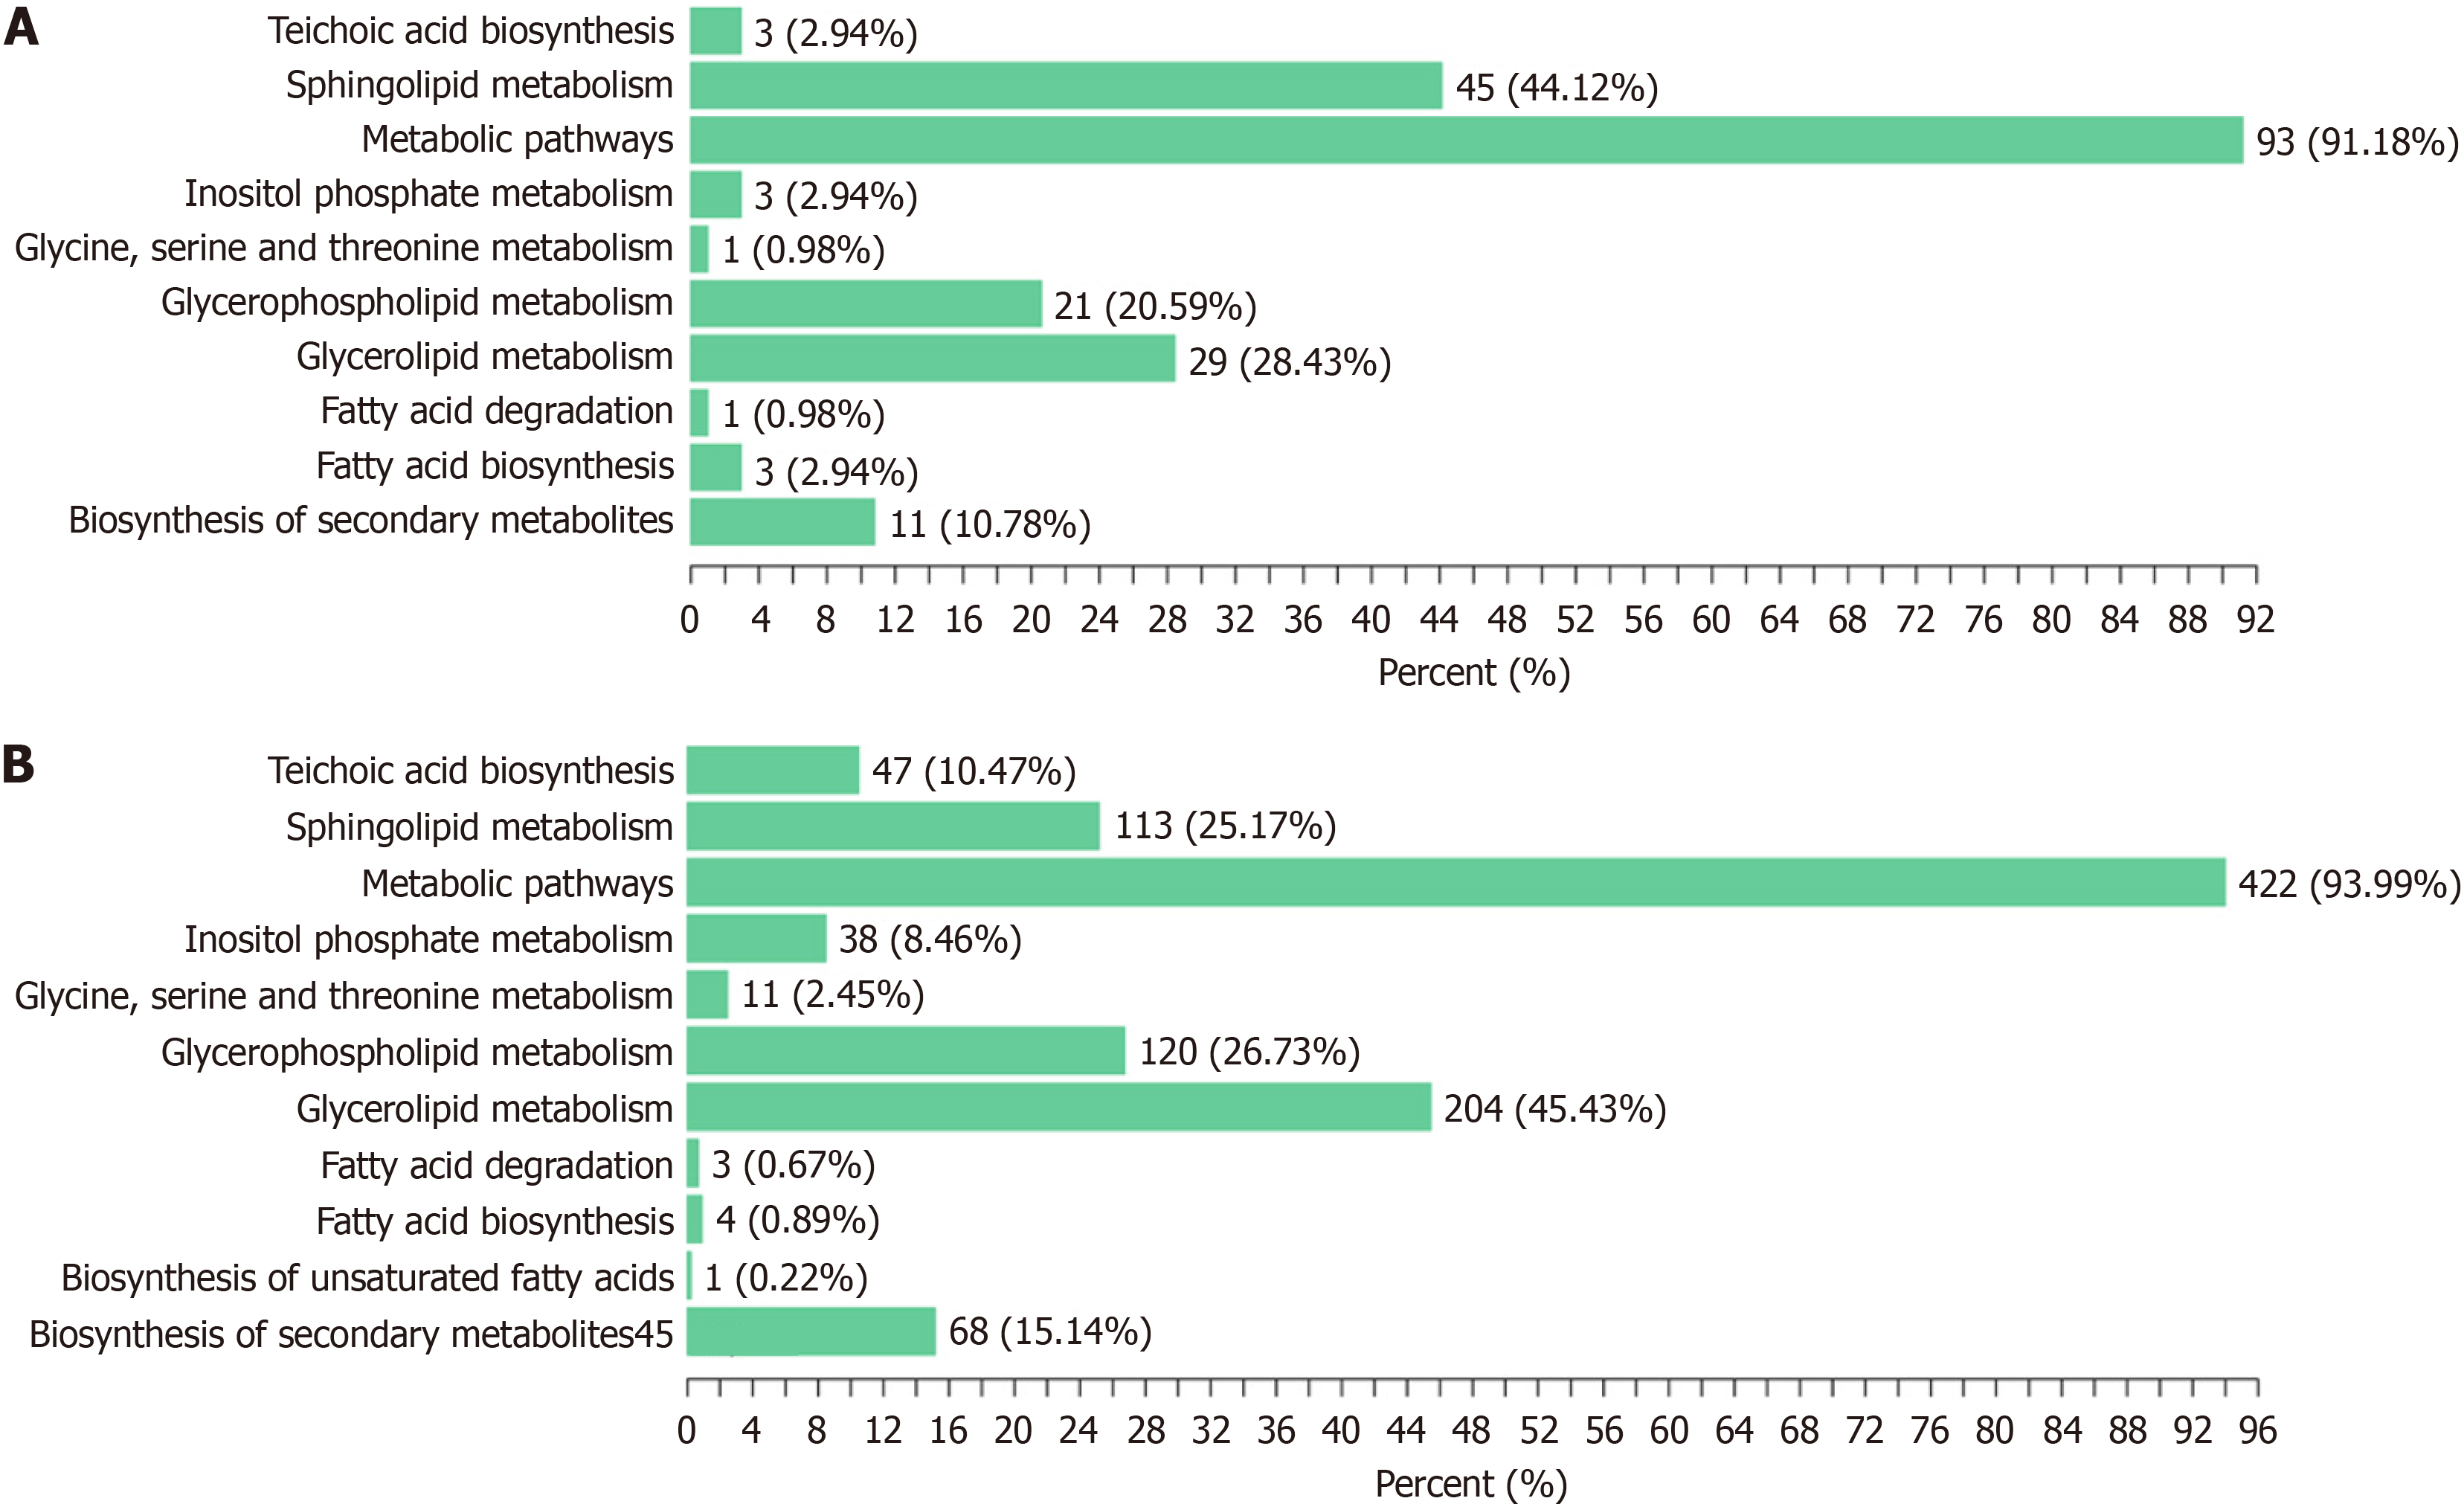
Figure 2 Kyoto Encyclopedia of Genes and Genomes classification chart of differential lipids.
A: Mineral salt medium (MSM) vs brain heart infusion (BHI); B: FF (i.e. rich in chromium and zinc group) vs BHI. Metabolomics testing was performed on Acetobacter pasteurianus from BHI culture, chromium-rich zinc-rich culture, and MSM culture.
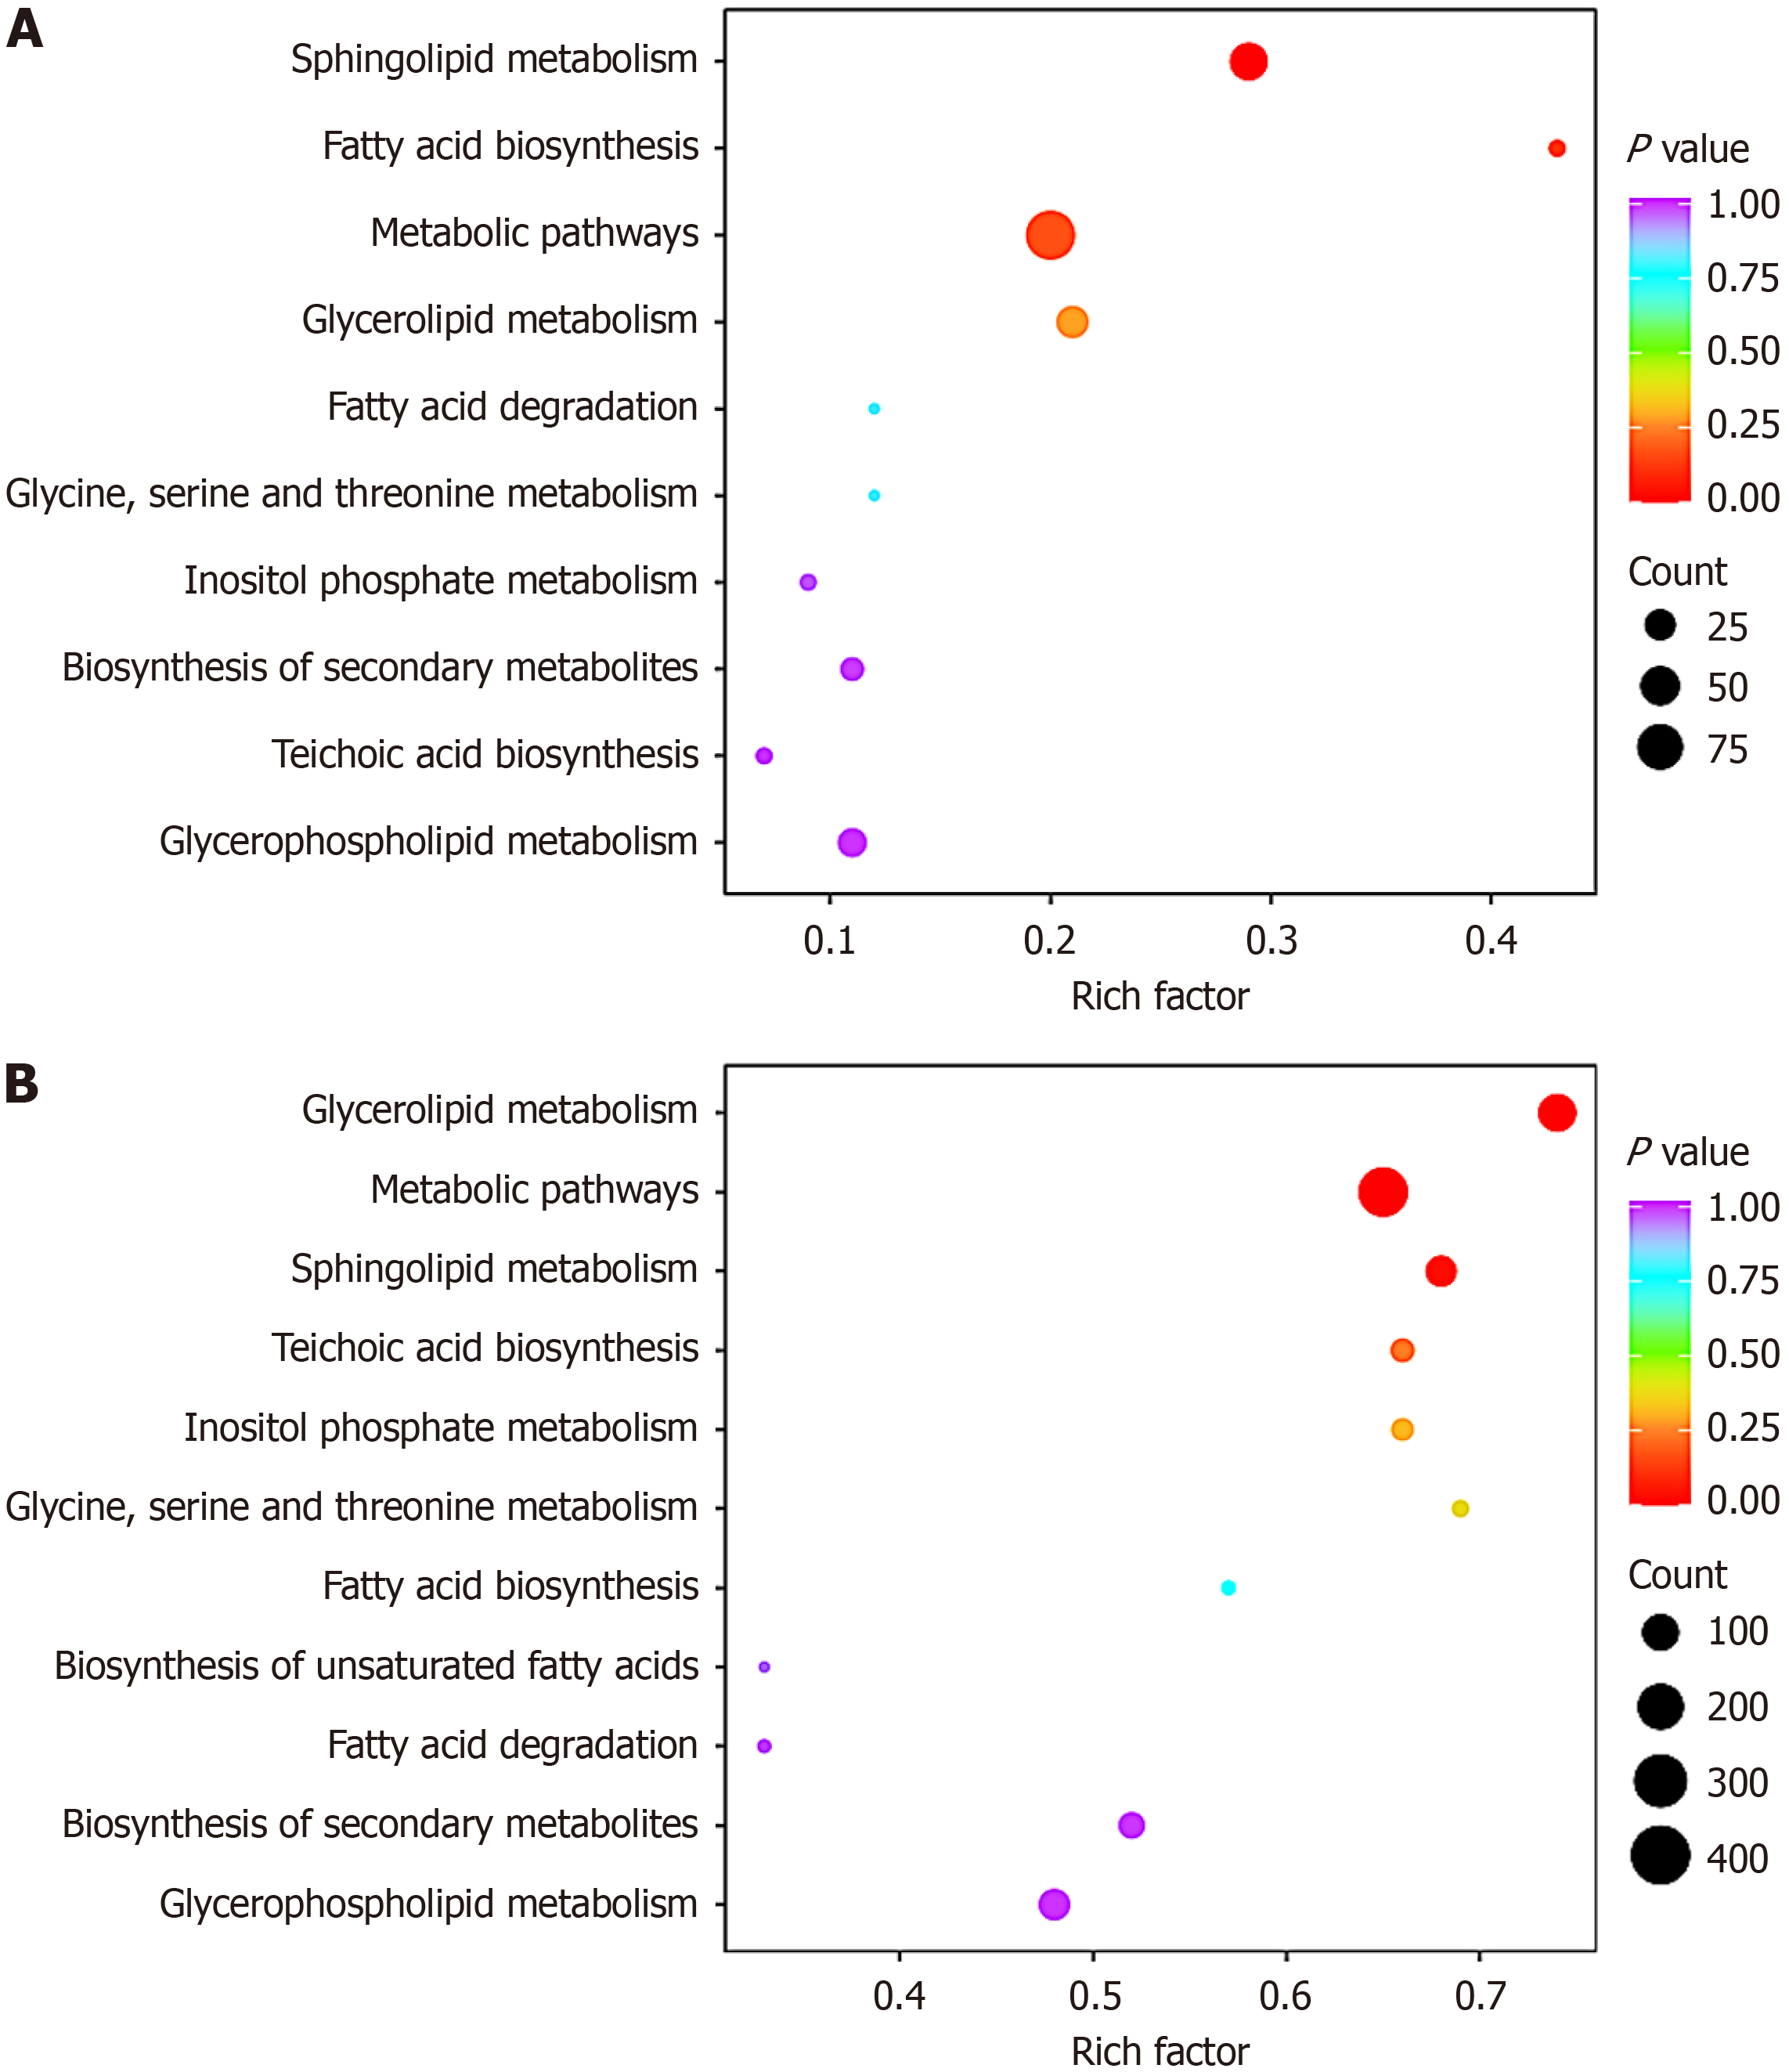
Figure 3 Kyoto Encyclopedia of Genes and Genomes enrichment chart of differential lipids.
A: Mineral salt medium (MSM) vs brain heart infusion (BHI); B: FF (i.e. rich in chromium and zinc group) vs BHI. Metabolomics testing was performed on Acetobacter pasteurianus from BHI culture, chromium-rich zinc-rich culture, and MSM culture.
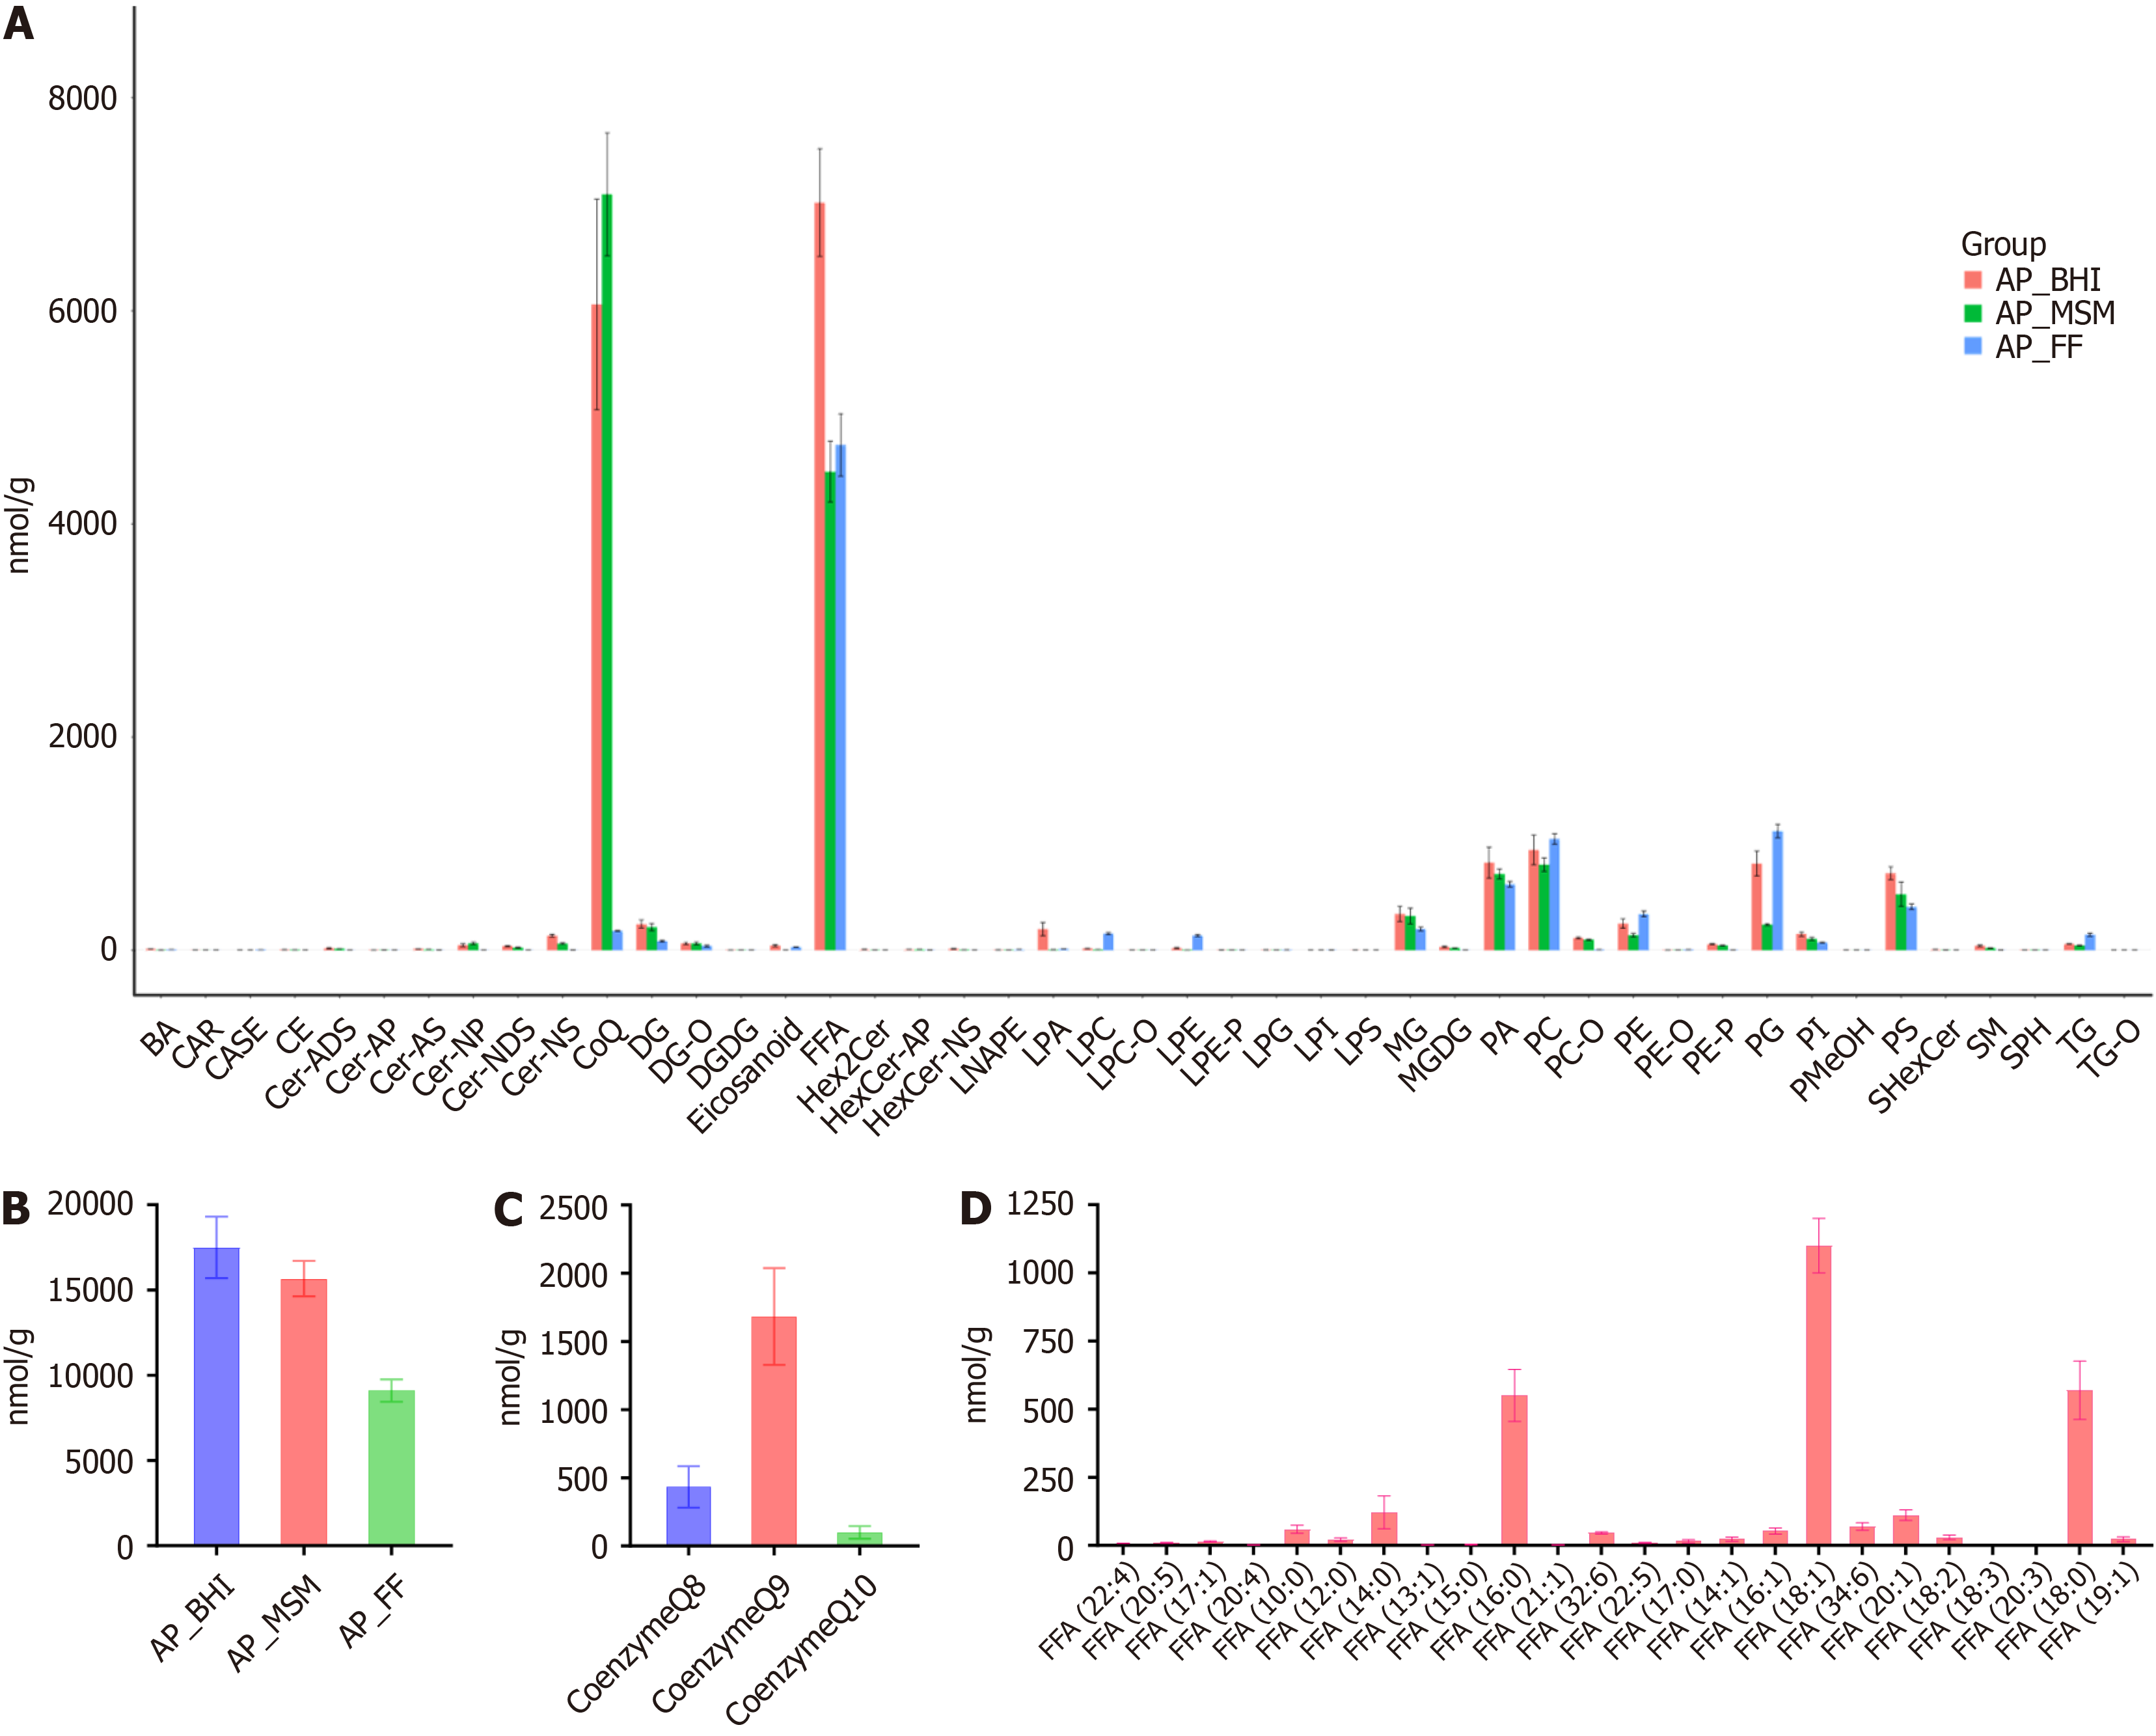
Figure 4 Lipid analysis of Acetobacter pasteurianus.
A: Changes in the content of lipid subclasses; B: Total lipid content variation; C: Comparison of the contents of three types of coenzyme Q; D: Comparison of the contents of 24 types of free fatty acids. Metabolomics testing was performed on Acetobacter pasteurianus from brain heart infusion (BHI) culture, chromium-rich zinc-rich culture, and mineral salt medium culture. AP: Alkylphospholipid; BA: Bile acid; CAR: Cardiolipin; CASE: Sitosterol acetate; CE: Cholesteryl ester; Cer-ADS: Ceramide-1-acetate; Cer-AP: Ceramide-1-phosphate; Cer-AS: Ceramide-1-sulfate; Cer-NP: Ceramide-N-phosphocholine; Cer-NDS: Ceramide-N-phosphoethanolamine; Cer-NS: Ceramide-N-sulfate; CoQ: Coenzyme Q; DG: Diacylglycerol; DGDG: Digalactosyldiacyl glycerol; DG-O: Diacylglycerol-plasmalogen; FFA: Free fatty acid; LPA: Lysophosphatidic acid; LPC: Lysophosphatidyl choline; LPC-O: Lysophosphatidyl choline-plasmalogen; LPE: Lysophosphatidyl ethanolamine; LPE-P: Lysophosphatidyl ethanolamine-plasmalogen; LPG: Lysophosphatidyl glycerol; LPI: Lysophosphatidyl inositol; LPS: Lipopolysaccharide; MG: Monoacylglycerol; MGDG: Monogalactosyldiacylglycerol; MSM: Mineral salt medium; PA: Phosphatidic acid; PC: Phosphatidylcholine; PE: Phosphatidylethanolamine; PE-O: Plasmalogen phosphatidylethanolamine; PE-P: Phosphatidylethanolamine-plasmalogen; PG: Phosphatidylglycerol; PI: Phosphatidylinositol; PMeOH: Phosphatidyl methanol; PS: Phosphatidylserine; SM: Sphingomyelin; SPH: Sphingosine; TG: Triacylglycerol; TG-O: Triacylglycerol-plasmalogen.
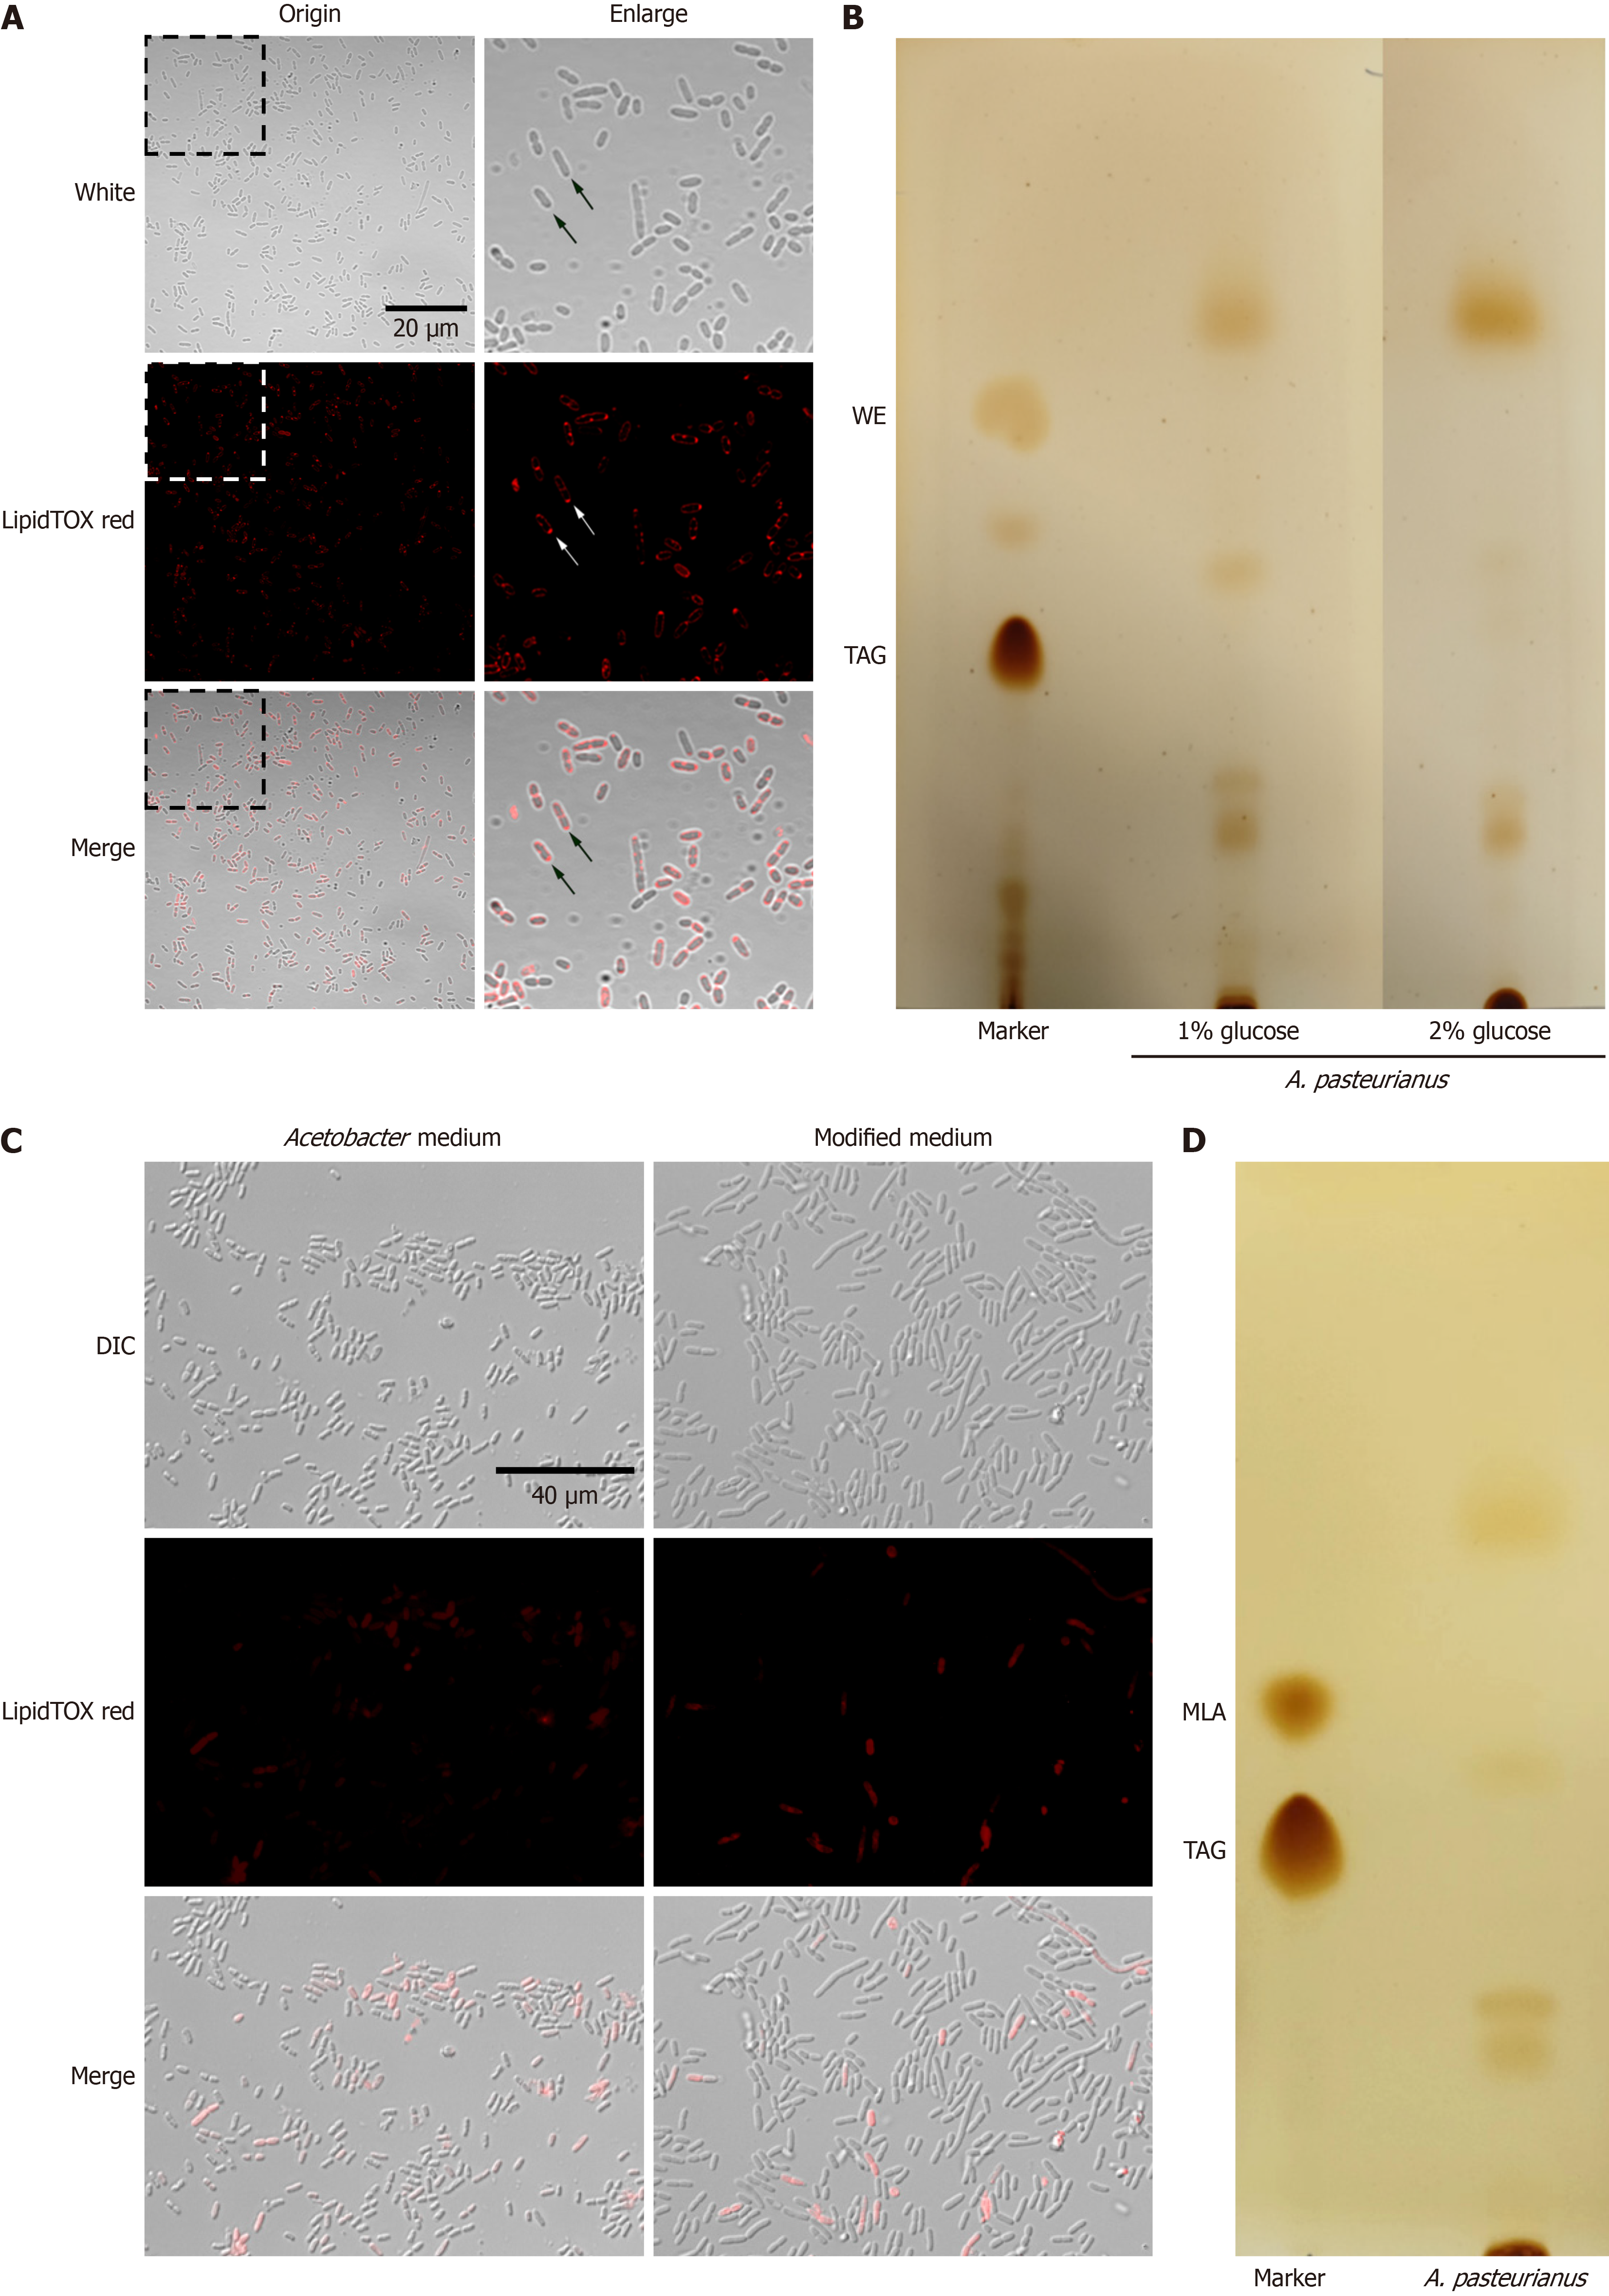
Figure 5 Detection of neutral lipids in Acetobacter pasteurianus under different nutritional conditions.
A: Acetobacter pasteurianus cells were stained using neutral lipid dye LipidTOX red (100 ×); B: Thin layer chromatography (TLC) results of A. pasteurianus in media with different glucose concentrations; C: Comparison of the state and staining of A. pasteurianus before and after medium adjustment (100 ×); D: TLC results of A. pasteurianus after medium adjustment. DIC: Differential interference contrast; MLA: Monoacylglycerol; TAG: Triacylglycerol; WE: Wax ester.
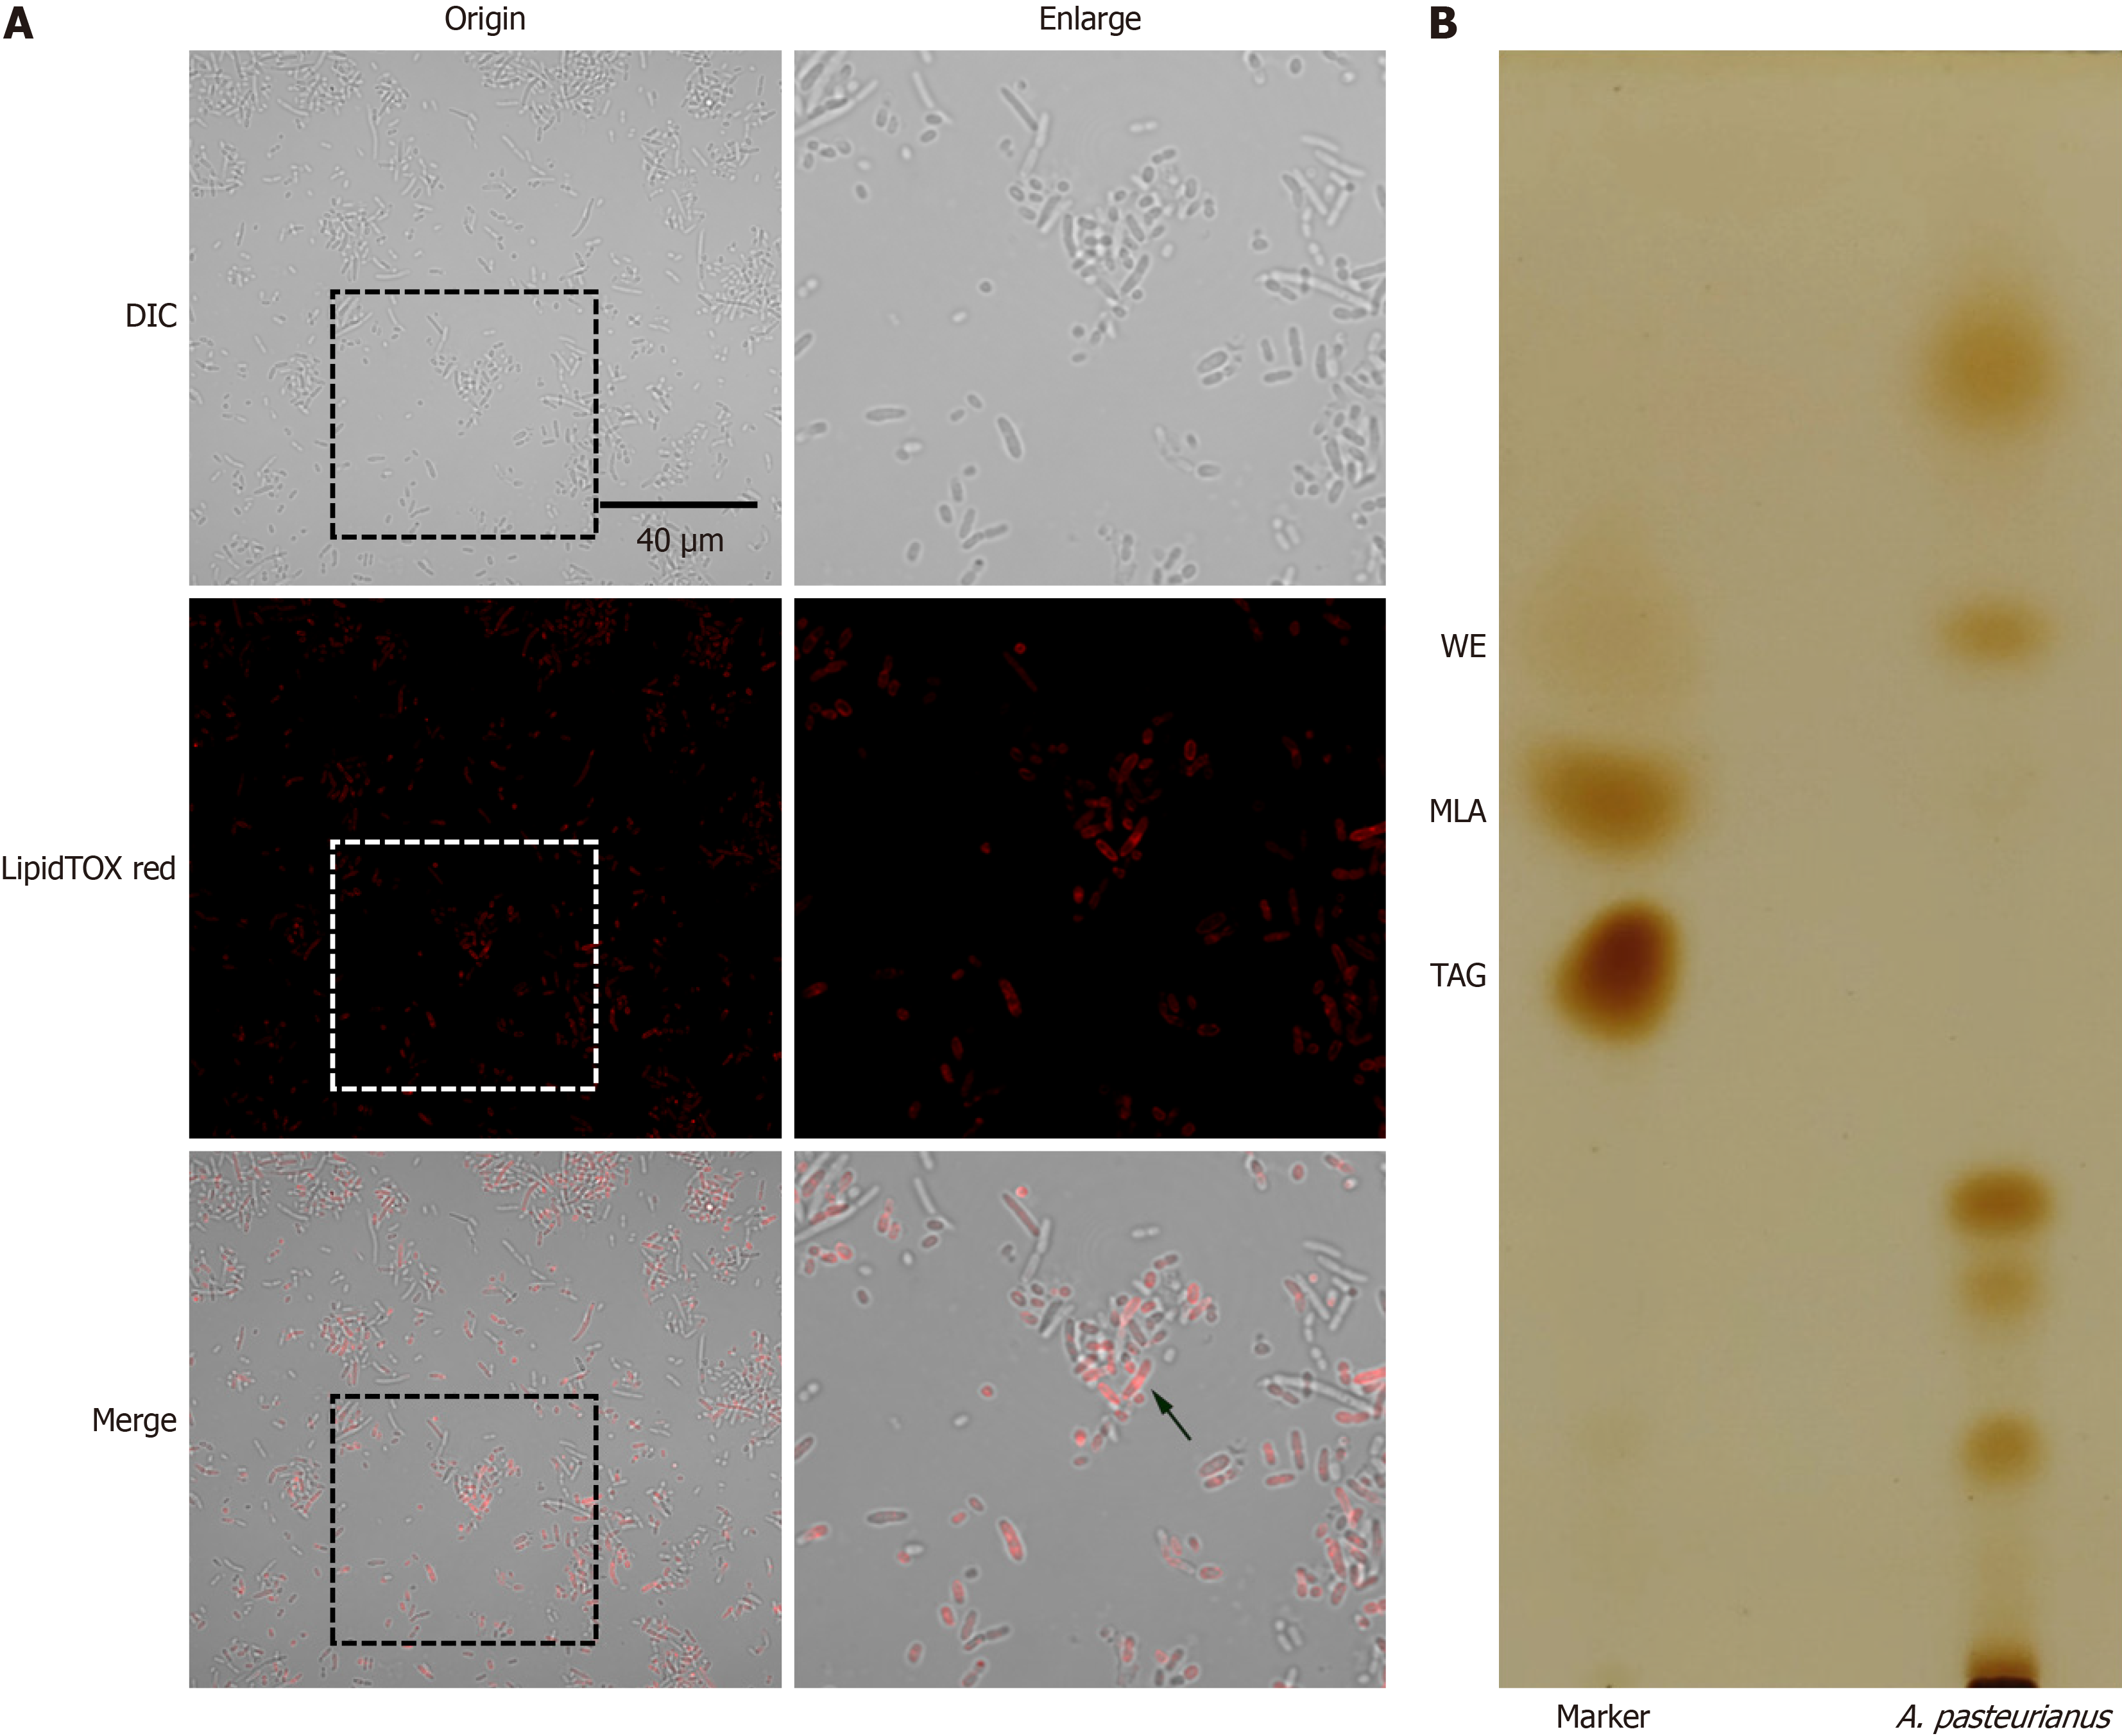
Figure 6 Detection of neutral lipids in Acetobacter pasteurianus cultured in mineral salt medium.
A: Acetobacter pasteurianus observed using neutral lipid staining (100 ×, spherical fluorescent sites indicated by arrows may contain lipid droplets); B: Thin layer chromatography results for the lipids of A. pasteurianus. DIC: Differential interference contrast; MLA: Monoacylglycerol; TAG: Triacylglycerol; WE: Wax ester.
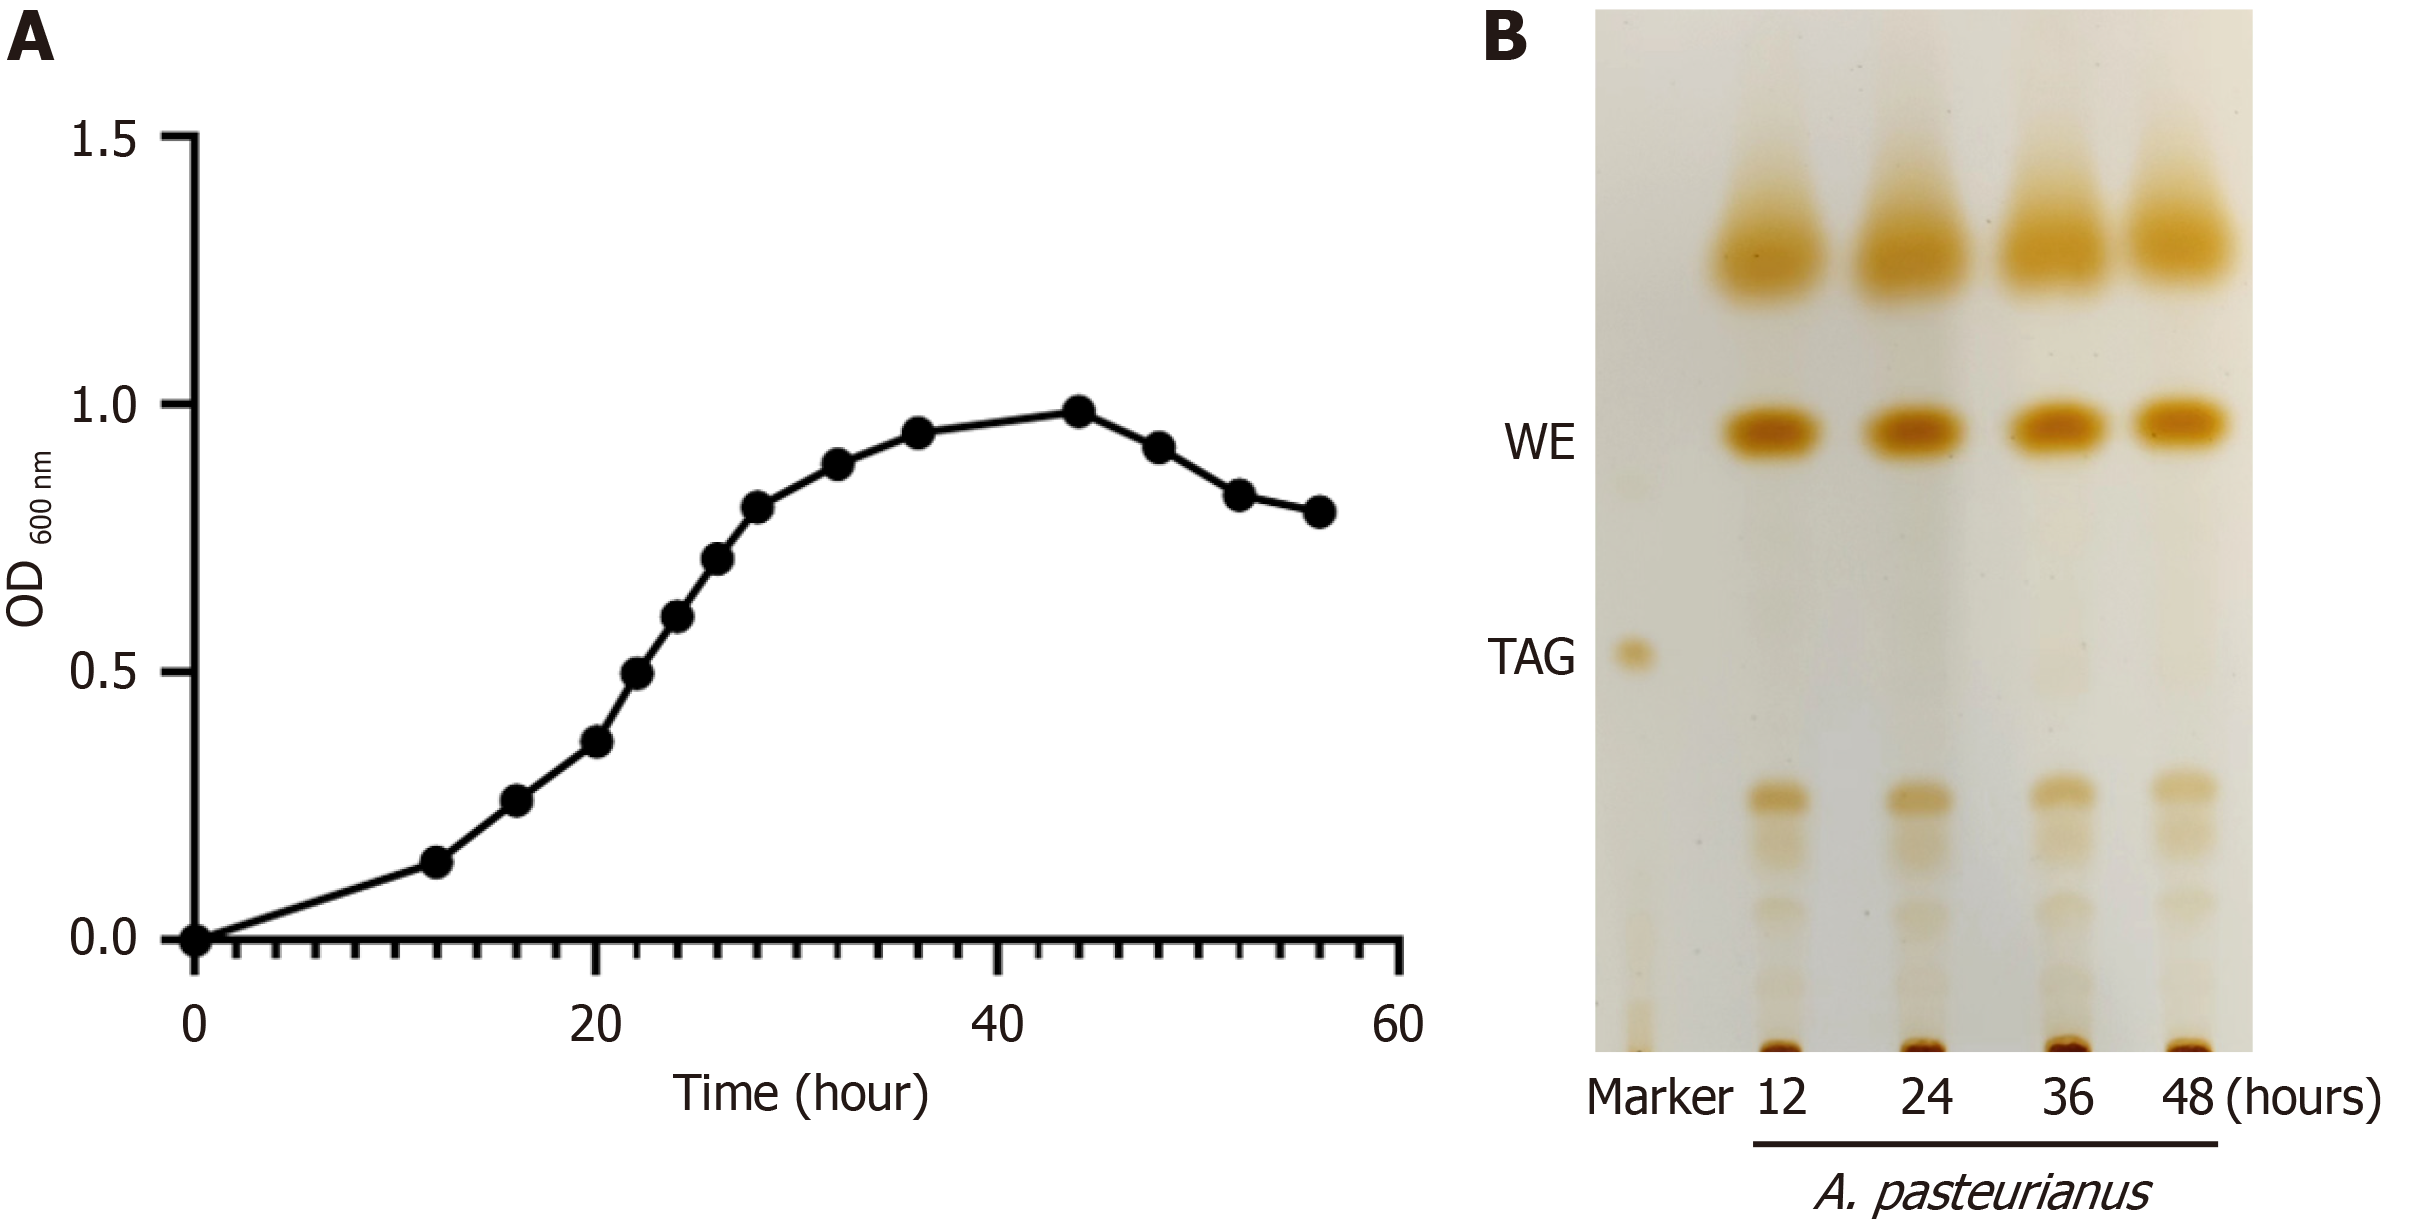
Figure 7 Detection of lipid droplets in Acetobacter pasteurianus.
A: Growth curve; B: Lipid analysis at various time points during culture in mineral salt medium. OD: Optical density; TAG: Triacylglycerol; WE: Wax ester.
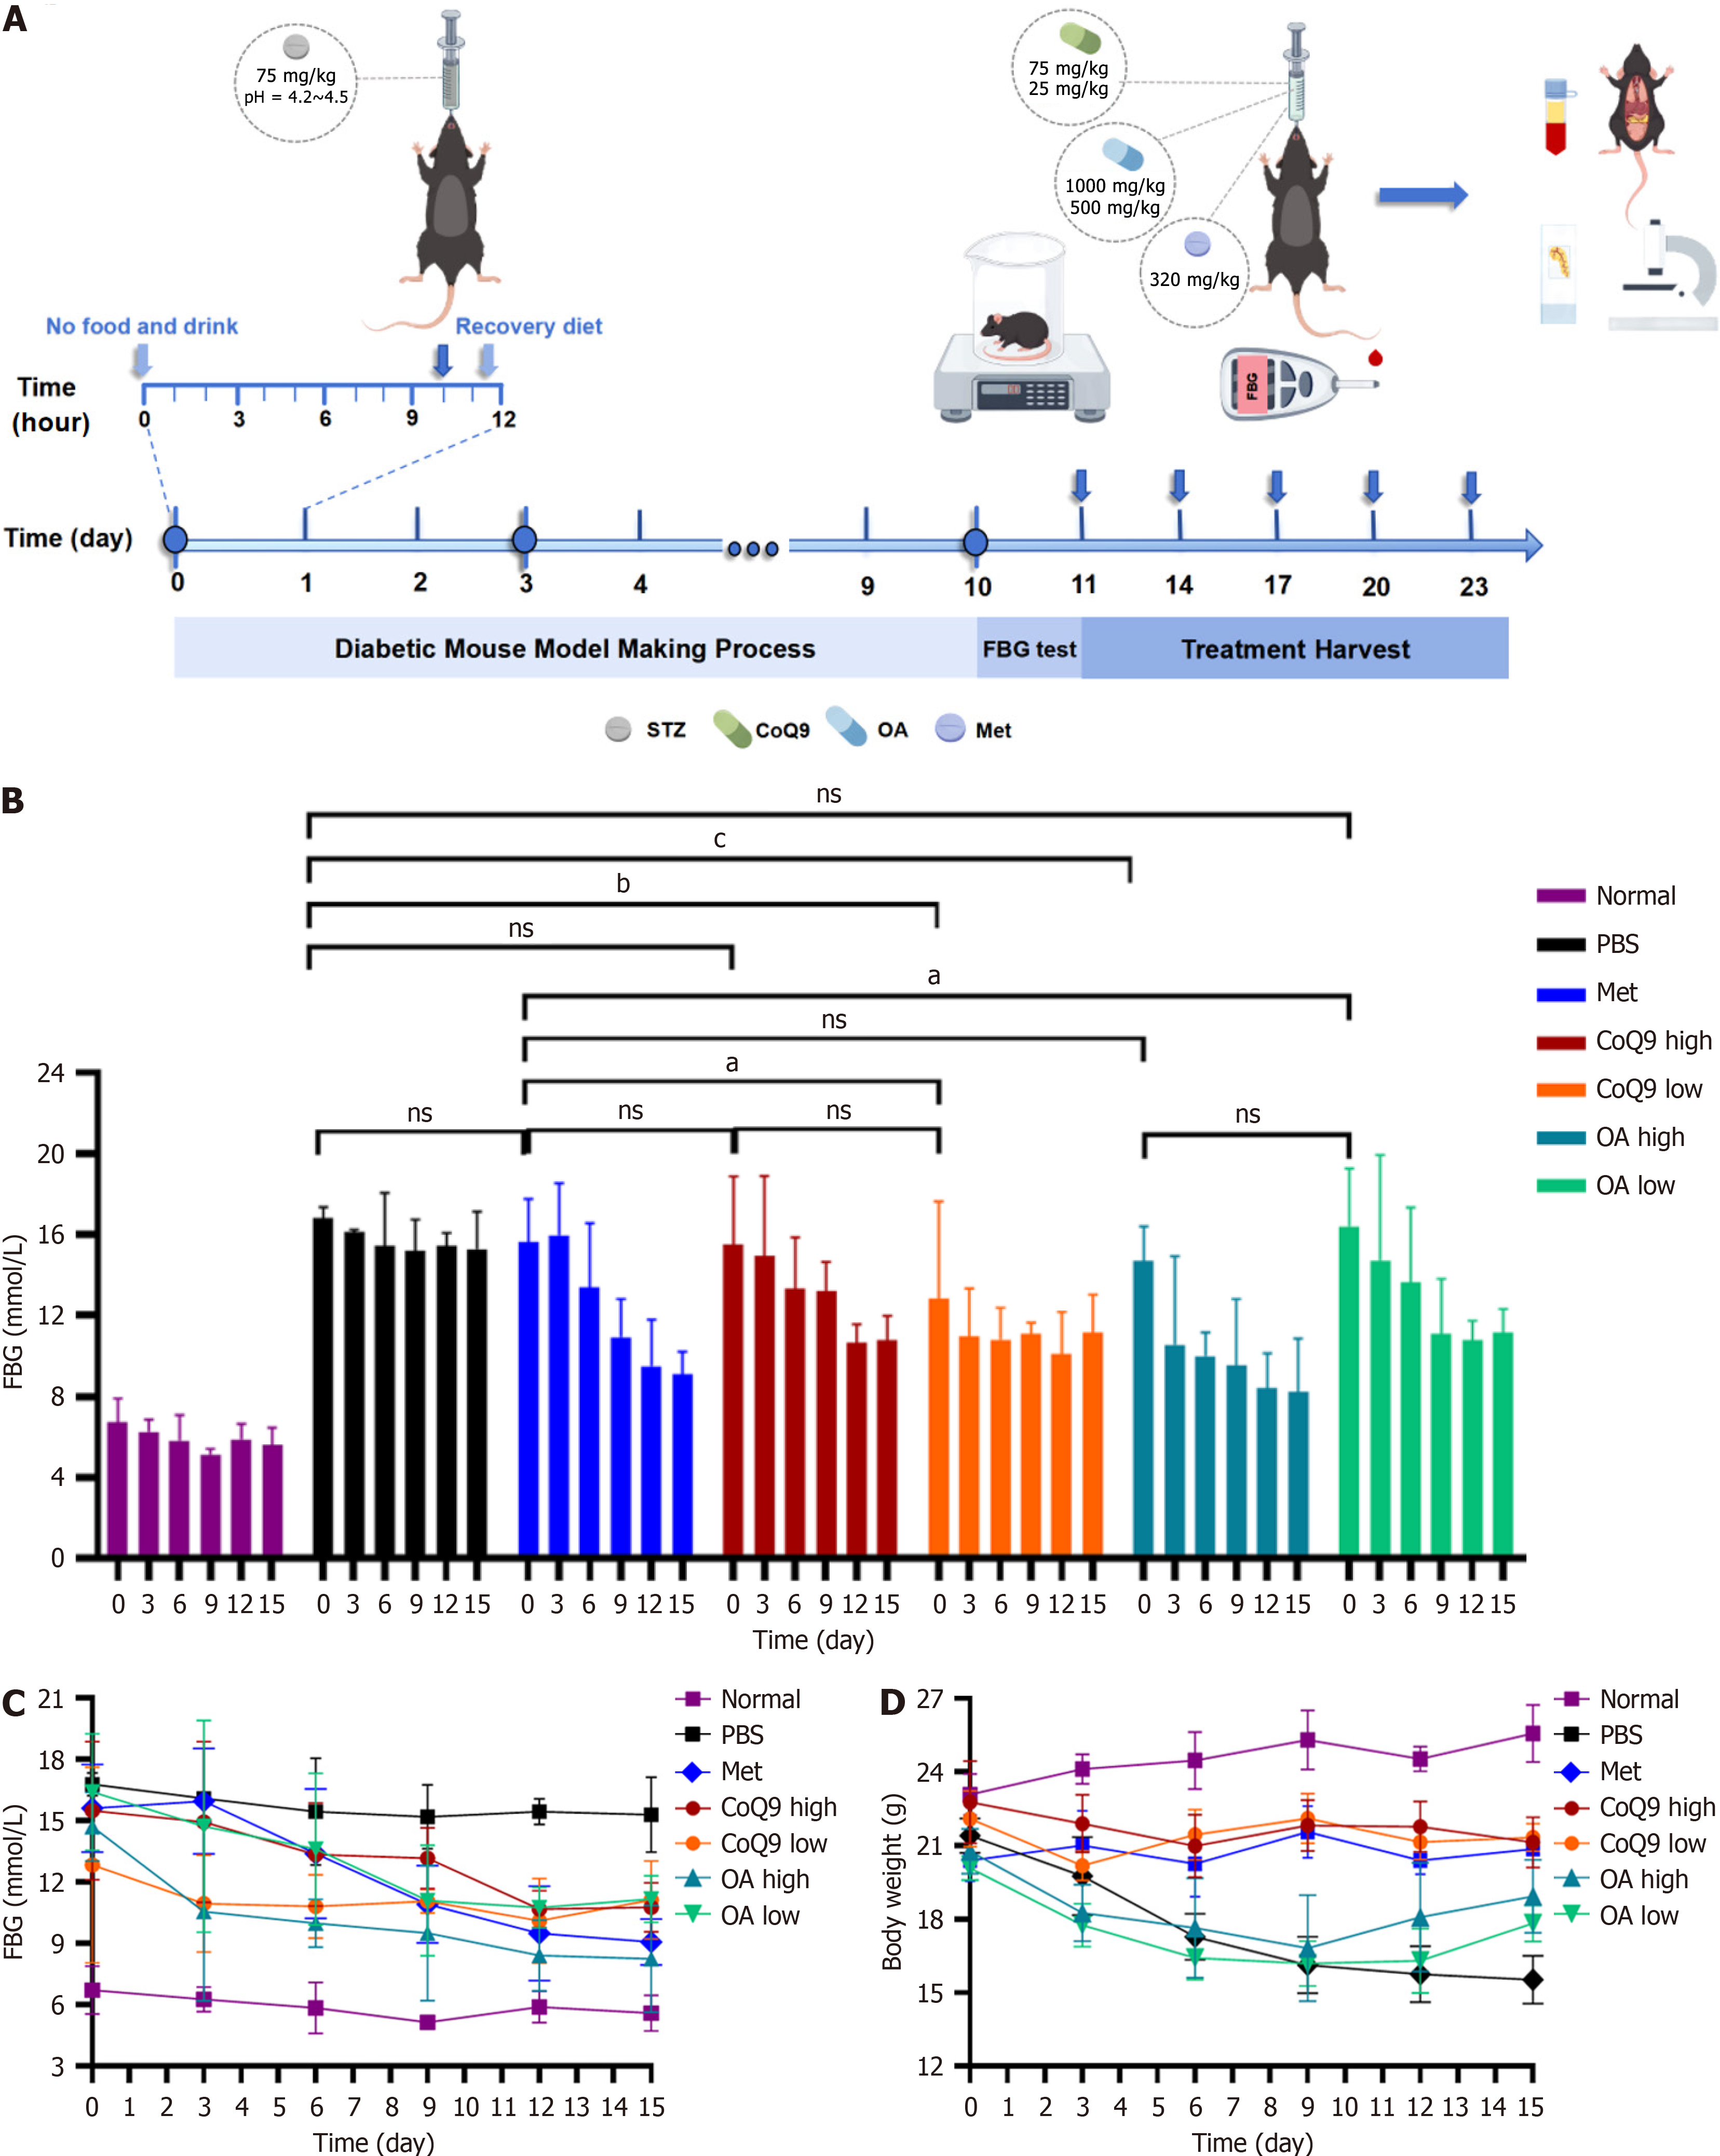
Figure 8 Changes in blood glucose and body weight during medication administration in diabetic mice.
A: Diabetic mouse treatment model; B: Bar chart of changes in blood glucose levels; C: Line graph of changes in blood glucose levels; D: Chart of changes in body weight. nsP > 0.05. aP < 0.05. bP < 0.01. cP < 0.001. CoQ9: Coenzyme Q9; FBG: Fasting blood glucose; Met: Metformin; OA: Oleic acid; PBS: Phosphate-buffered saline; pH: Potential of hydrogen; STZ: Streptozotocin.
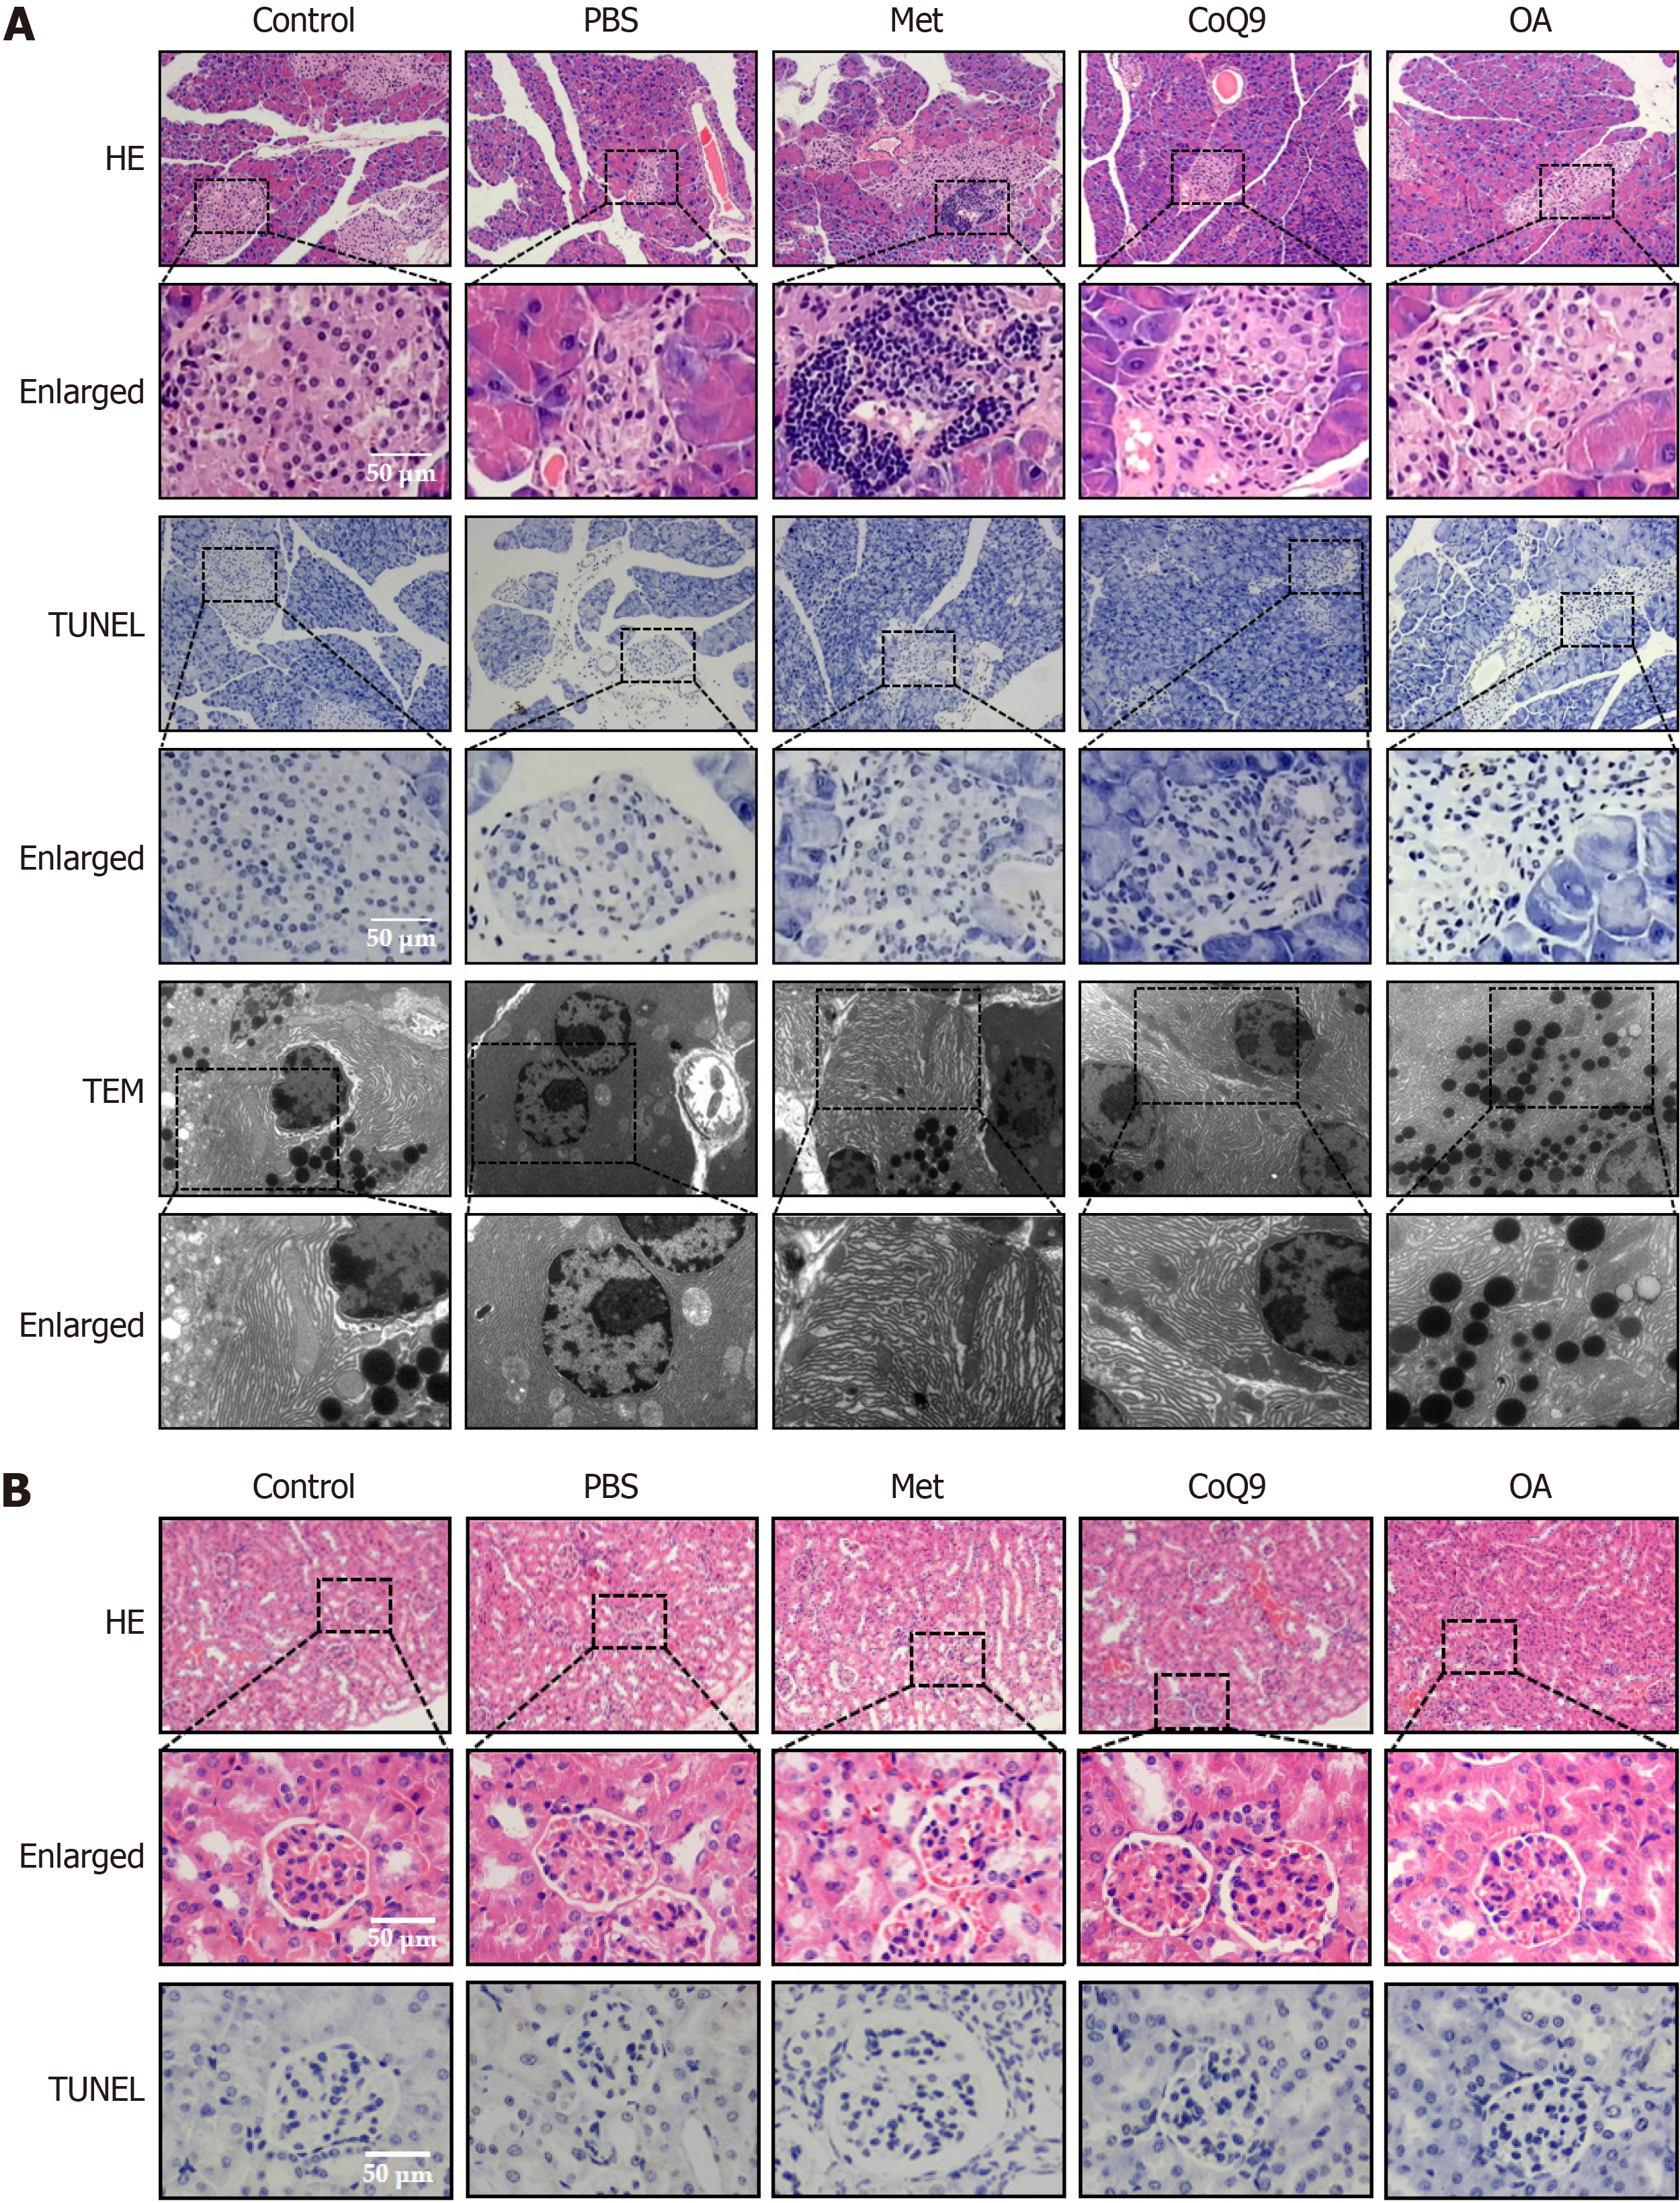
Figure 9 Role of Acetobacter pasteurianus lipids in promoting pancreatic and renal tissue repair.
A: Images of pancreatic tissue observed using hematoxylin and eosin (H&E) staining, terminal deoxynucleotidyl transferase dUTP nick end labeling (TUNEL) staining, and electron microscopy; B: Images of renal tissue observed using H&E staining and TUNEL staining. The green arrows indicate the thickening of the glomerular basement membrane. CoQ9: Coenzyme Q9; Met: Metformin; OA: Oleic acid; PBS: Phosphate-buffered saline; TEM: Transmission electron microscopy.
- Citation: Xu WY, Zhou WT, Luo JZ, Jiang YY, Zhang K, Zhang SY, Liu PS, Wei HY, Huang YQ. Lipid metabolism of Acetobacter pasteurianus and its main components with hypoglycemic effects. World J Diabetes 2025; 16(6): 103370
- URL: https://www.wjgnet.com/1948-9358/full/v16/i6/103370.htm
- DOI: https://dx.doi.org/10.4239/wjd.v16.i6.103370


