Copyright
©The Author(s) 2025.
World J Diabetes. Jun 15, 2025; 16(6): 101173
Published online Jun 15, 2025. doi: 10.4239/wjd.v16.i6.101173
Published online Jun 15, 2025. doi: 10.4239/wjd.v16.i6.101173
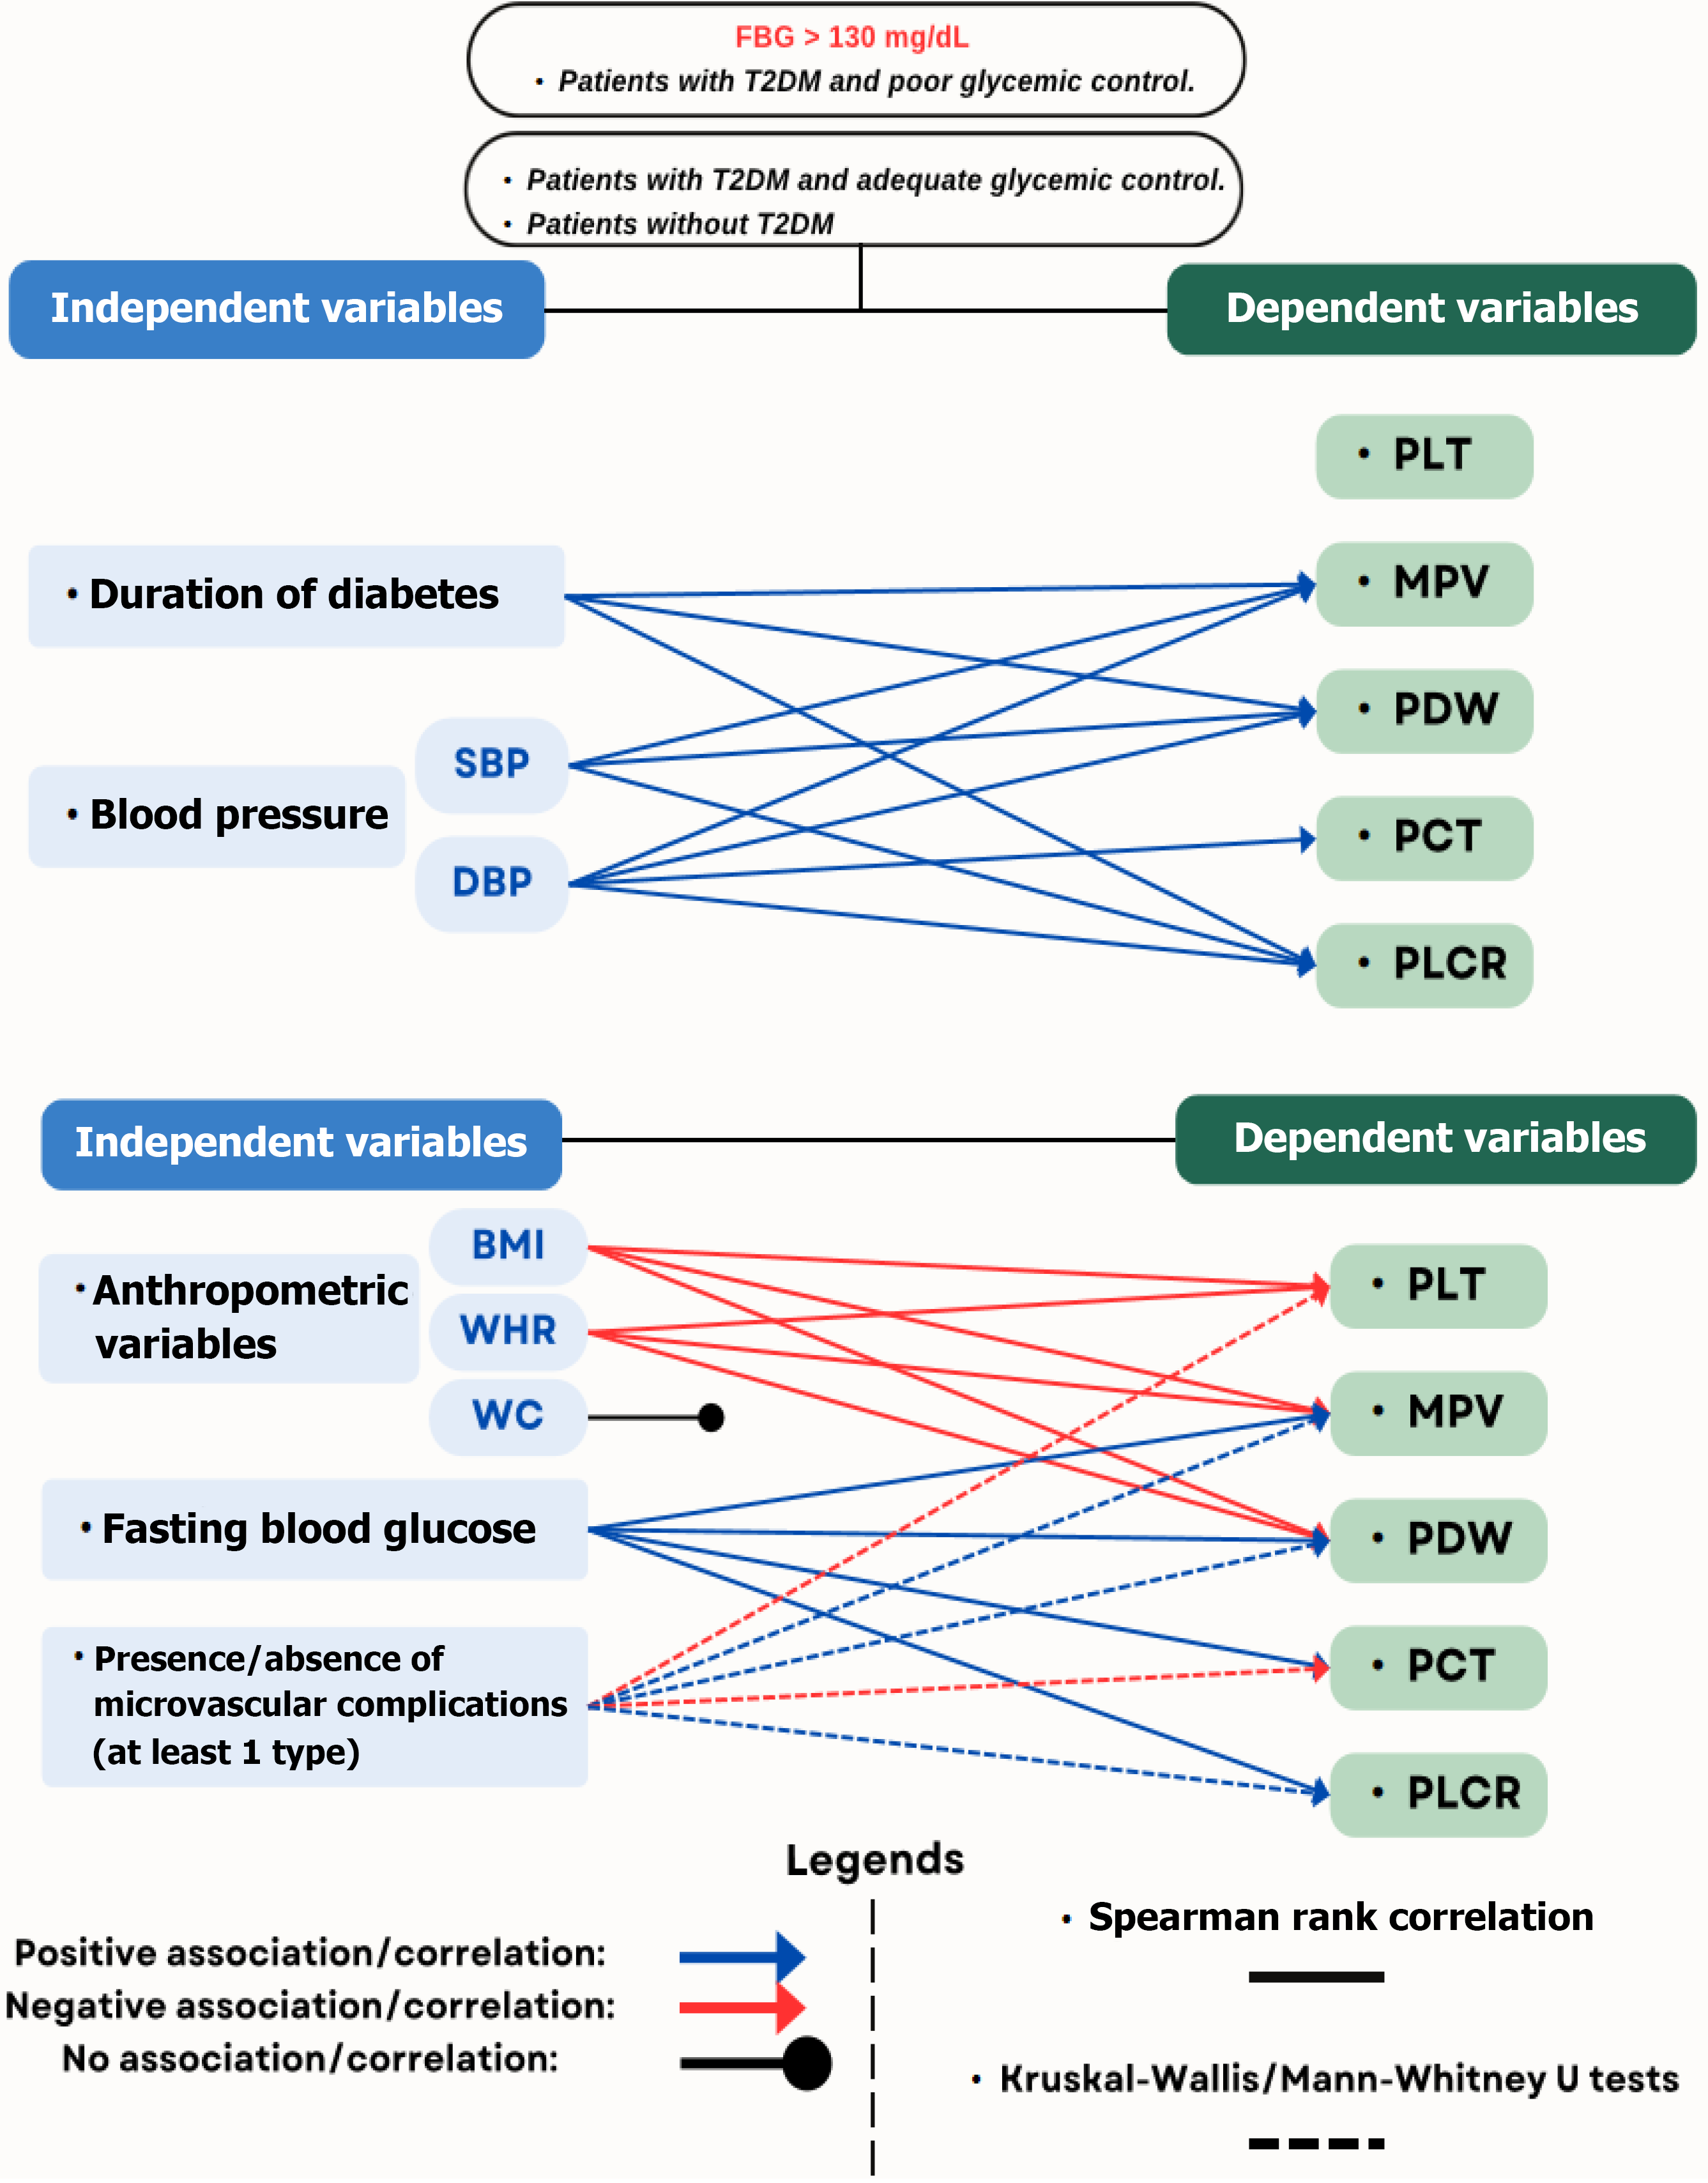
Figure 1 Relationship between dependent and independent variables is included in the study by Regassa et al[3].
Solid blue line represents a positive correlation between variables; Solid red line represents a negative correlation between variables; Blue dashed line indicates a positive association between variables; Red dashed line indicates a negative association between variables. BMI: Body mass index; DBP: Diastolic blood pressure; FBG: Fasting blood glucose; MPV: Mean platelet volume; PCT: Plateletcrit; PDW: Platelet distribution width; PLCR: Platelet large cell ratio; PLT: Platelet count; SBP: Systolic blood pressure; T2DM: Type 2 diabetes mellitus; WC: Waist circumference; WHR: Waist-hip ratio.
- Citation: Medeiros GA, de Santana JBF, Zajdenverg L, Negrato CA. Is there a role for platelet indices in predicting poor glucoregulation in type 2 diabetes mellitus? World J Diabetes 2025; 16(6): 101173
- URL: https://www.wjgnet.com/1948-9358/full/v16/i6/101173.htm
- DOI: https://dx.doi.org/10.4239/wjd.v16.i6.101173


