Copyright
©The Author(s) 2025.
World J Diabetes. Mar 15, 2025; 16(3): 102526
Published online Mar 15, 2025. doi: 10.4239/wjd.v16.i3.102526
Published online Mar 15, 2025. doi: 10.4239/wjd.v16.i3.102526
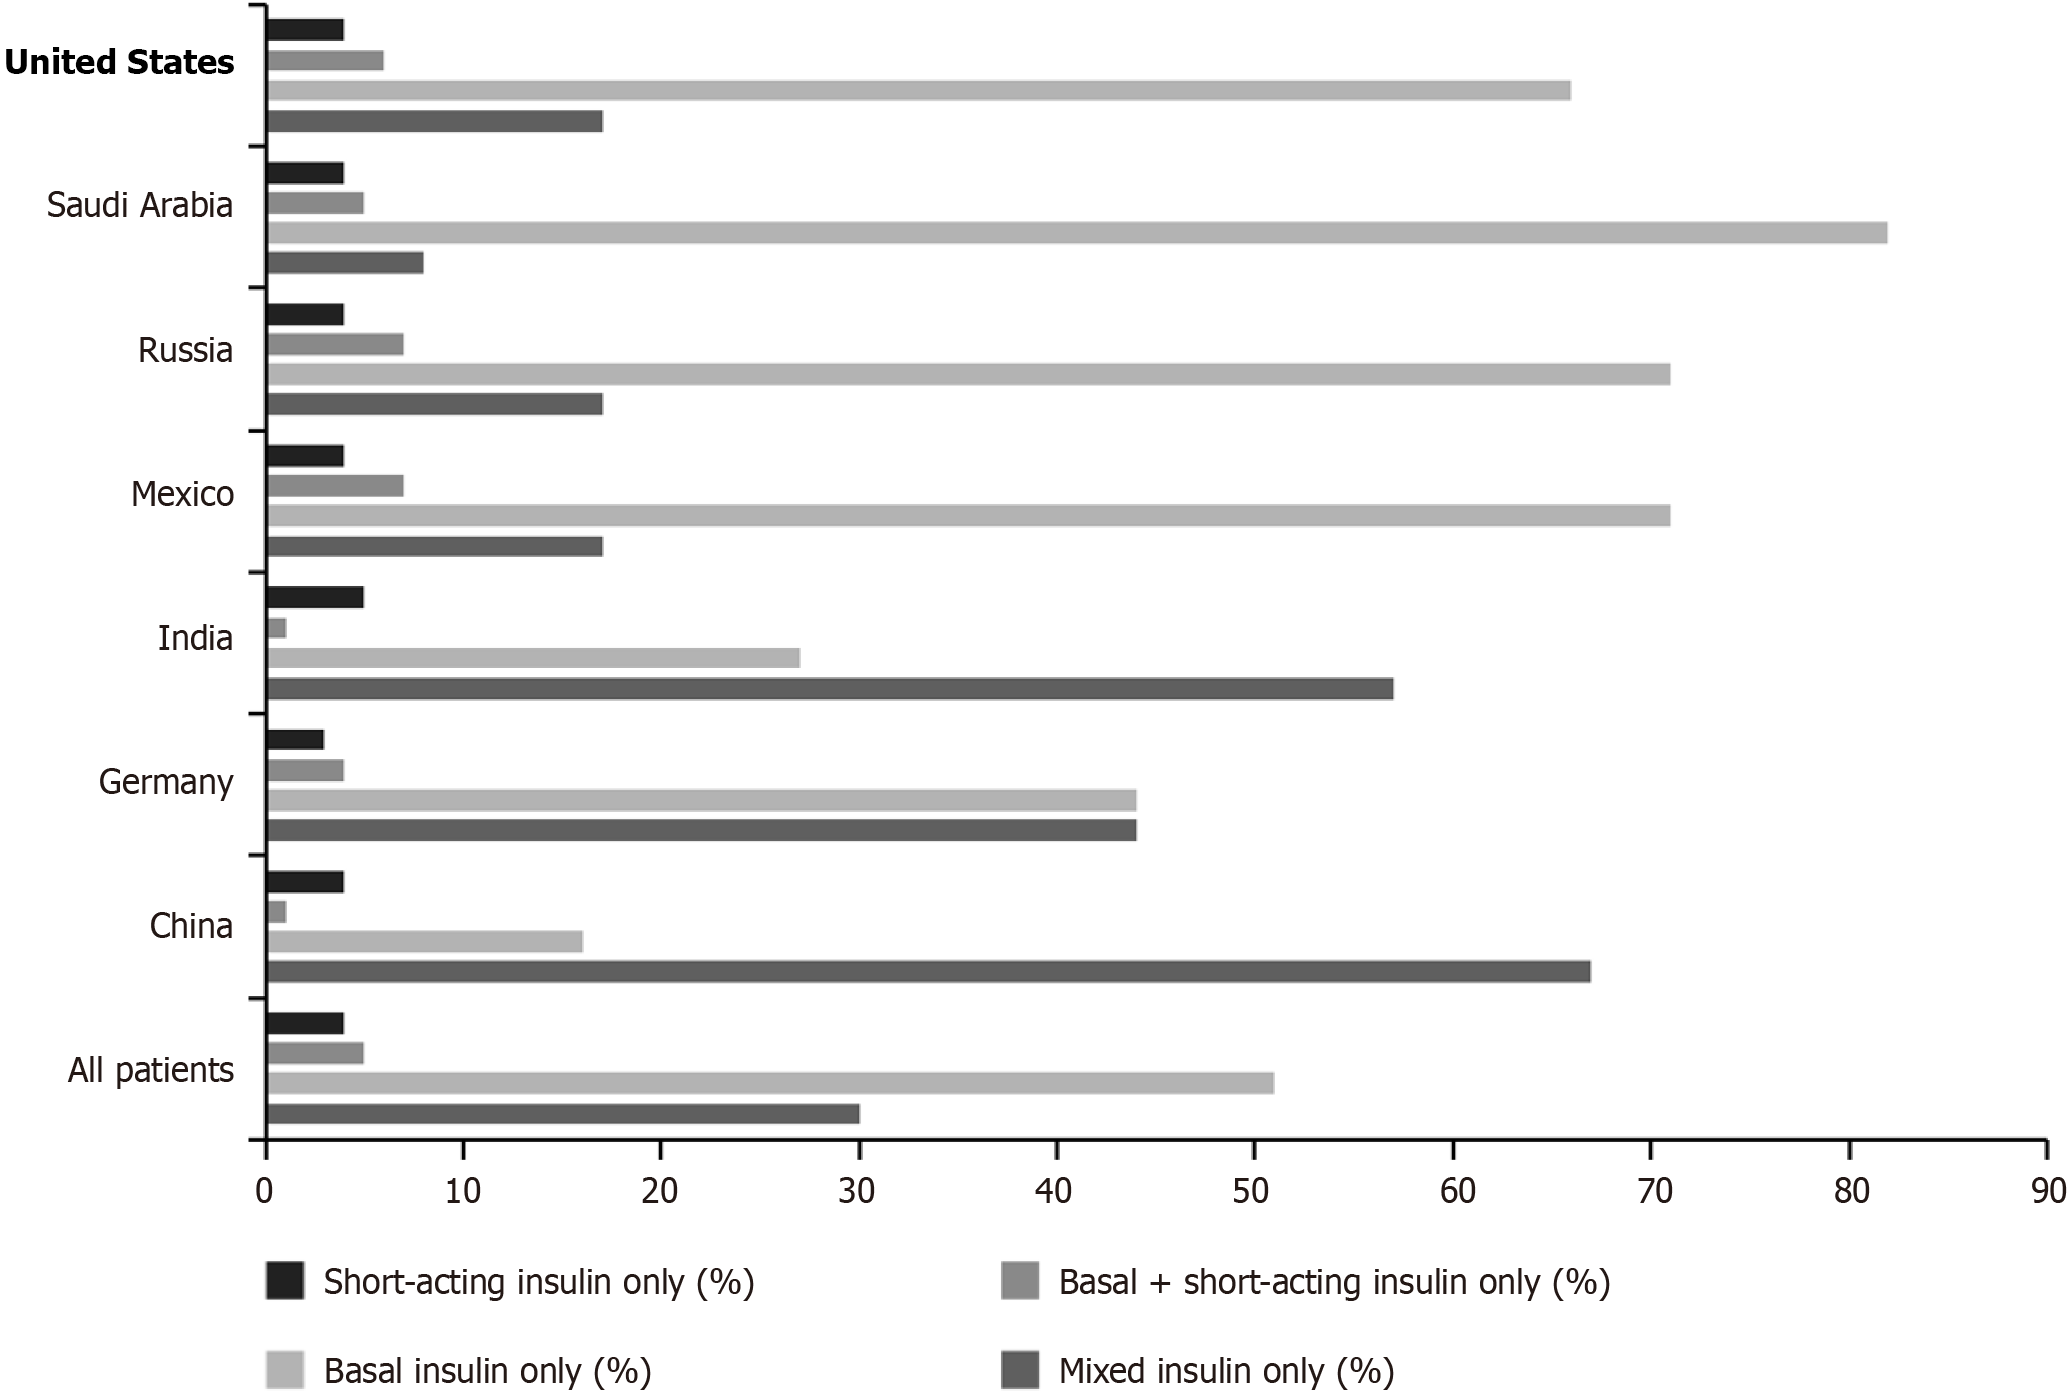
Figure 1
Insulin usage patterns in patients with type 2 diabetes mellitus in different countries.
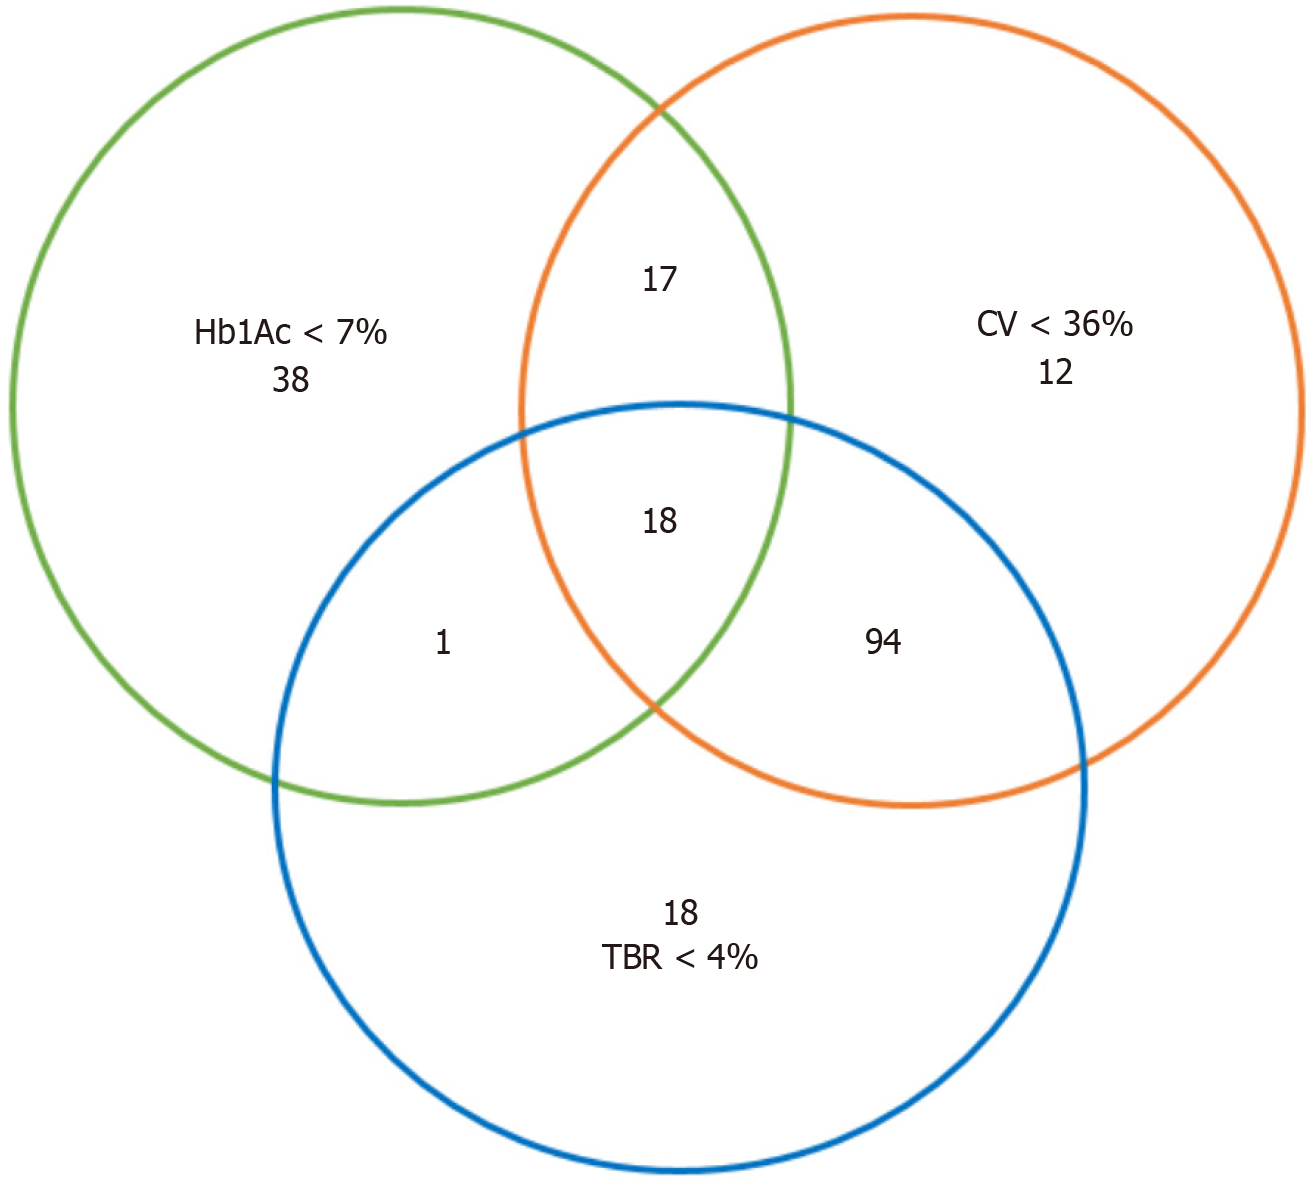
Figure 2 Comprehensive glycemic control achievement rates in patients using premixed insulin.
The Venn diagram shows the distribution of patients meeting the criteria for glycated hemoglobin < 7%, coefficient of variation < 36%, and time below range < 4%. HbA1c: Glycated hemoglobin; CV: Coefficient of variation; TBR: Time below range.
- Citation: Xia Y, Hu Y, Ma JH. Premixed insulin: Advantages, disadvantages, and future. World J Diabetes 2025; 16(3): 102526
- URL: https://www.wjgnet.com/1948-9358/full/v16/i3/102526.htm
- DOI: https://dx.doi.org/10.4239/wjd.v16.i3.102526


