Copyright
©The Author(s) 2025.
World J Diabetes. Mar 15, 2025; 16(3): 102277
Published online Mar 15, 2025. doi: 10.4239/wjd.v16.i3.102277
Published online Mar 15, 2025. doi: 10.4239/wjd.v16.i3.102277
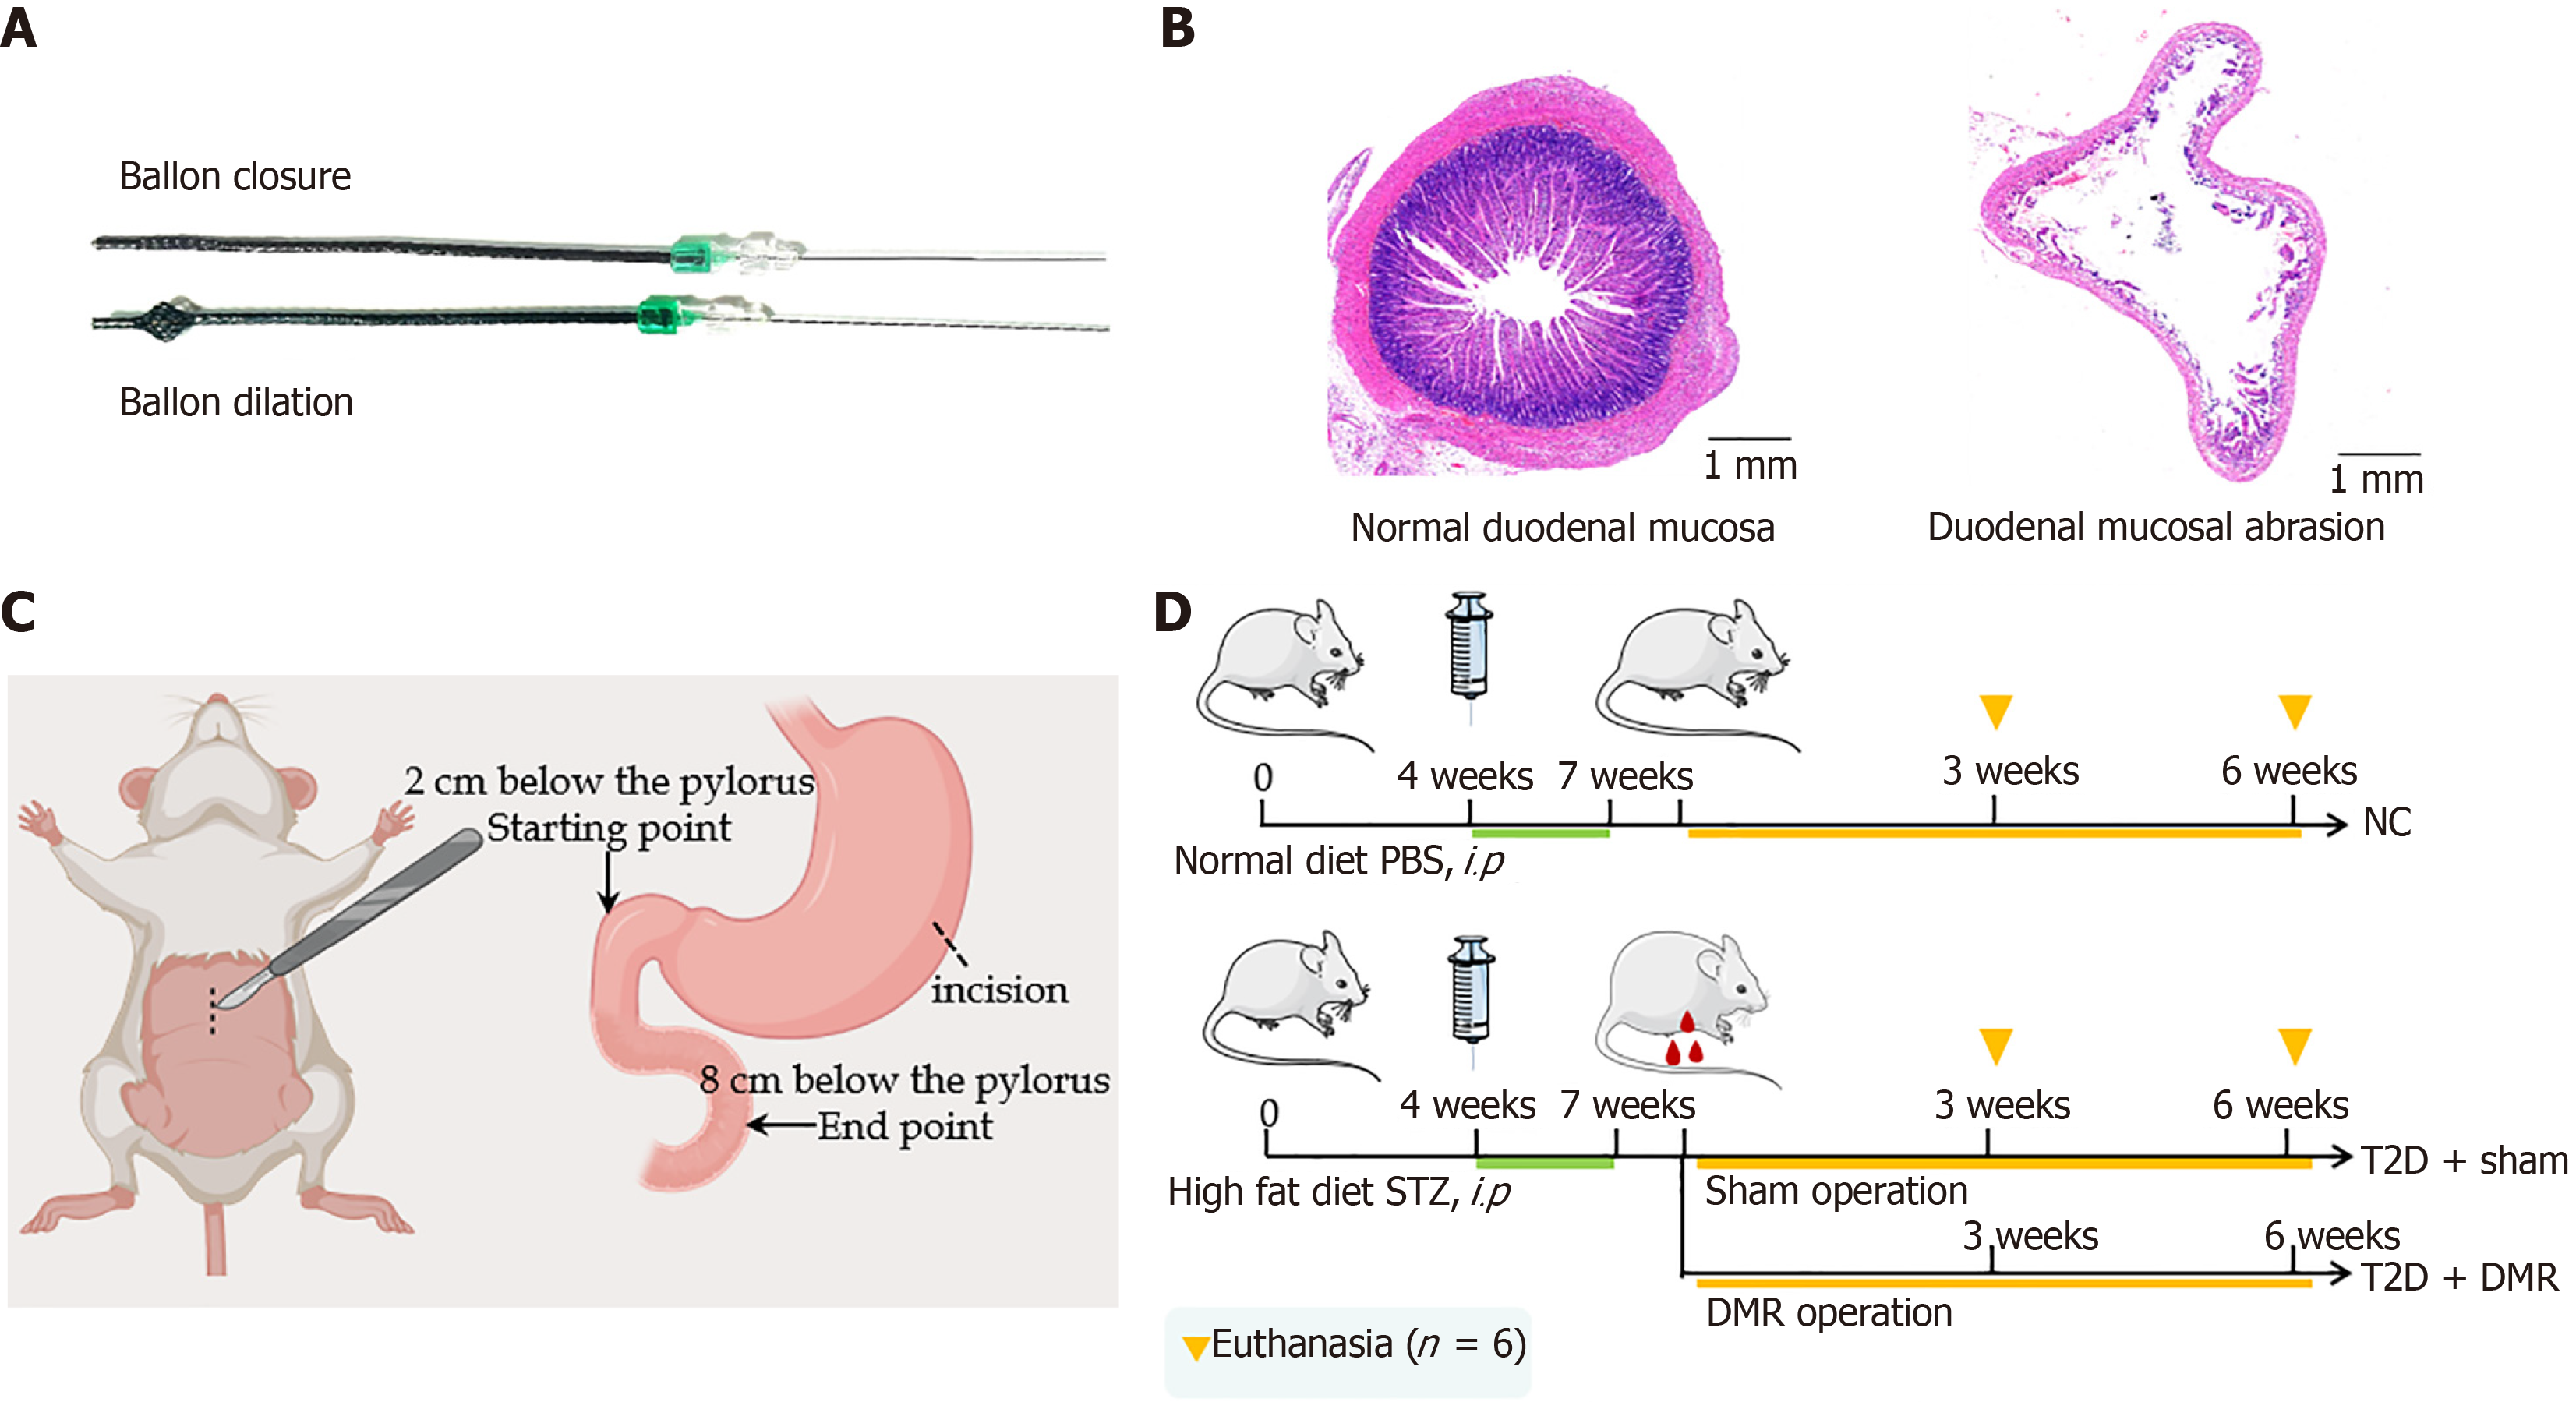
Figure 1 Design and procedure of the duodenal mucosal resurfacing experiment.
A: Duodenal mucosal resurfacing (DMR) catheter under normal and balloon expansion conditions; B: Hematoxylin and eosin staining of normal duodenum and duodenum after mucosal abrasion (scale bar = 1 mm); C: Diagram of the DMR procedure; D: Animal experiment flow chart of the DMR procedure. DMR: Duodenal mucosal resurfacing; NC: Normal control; STZ: Streptozotocin; T2D: Type 2 diabetes; PBS: Phosphate buffer solution.
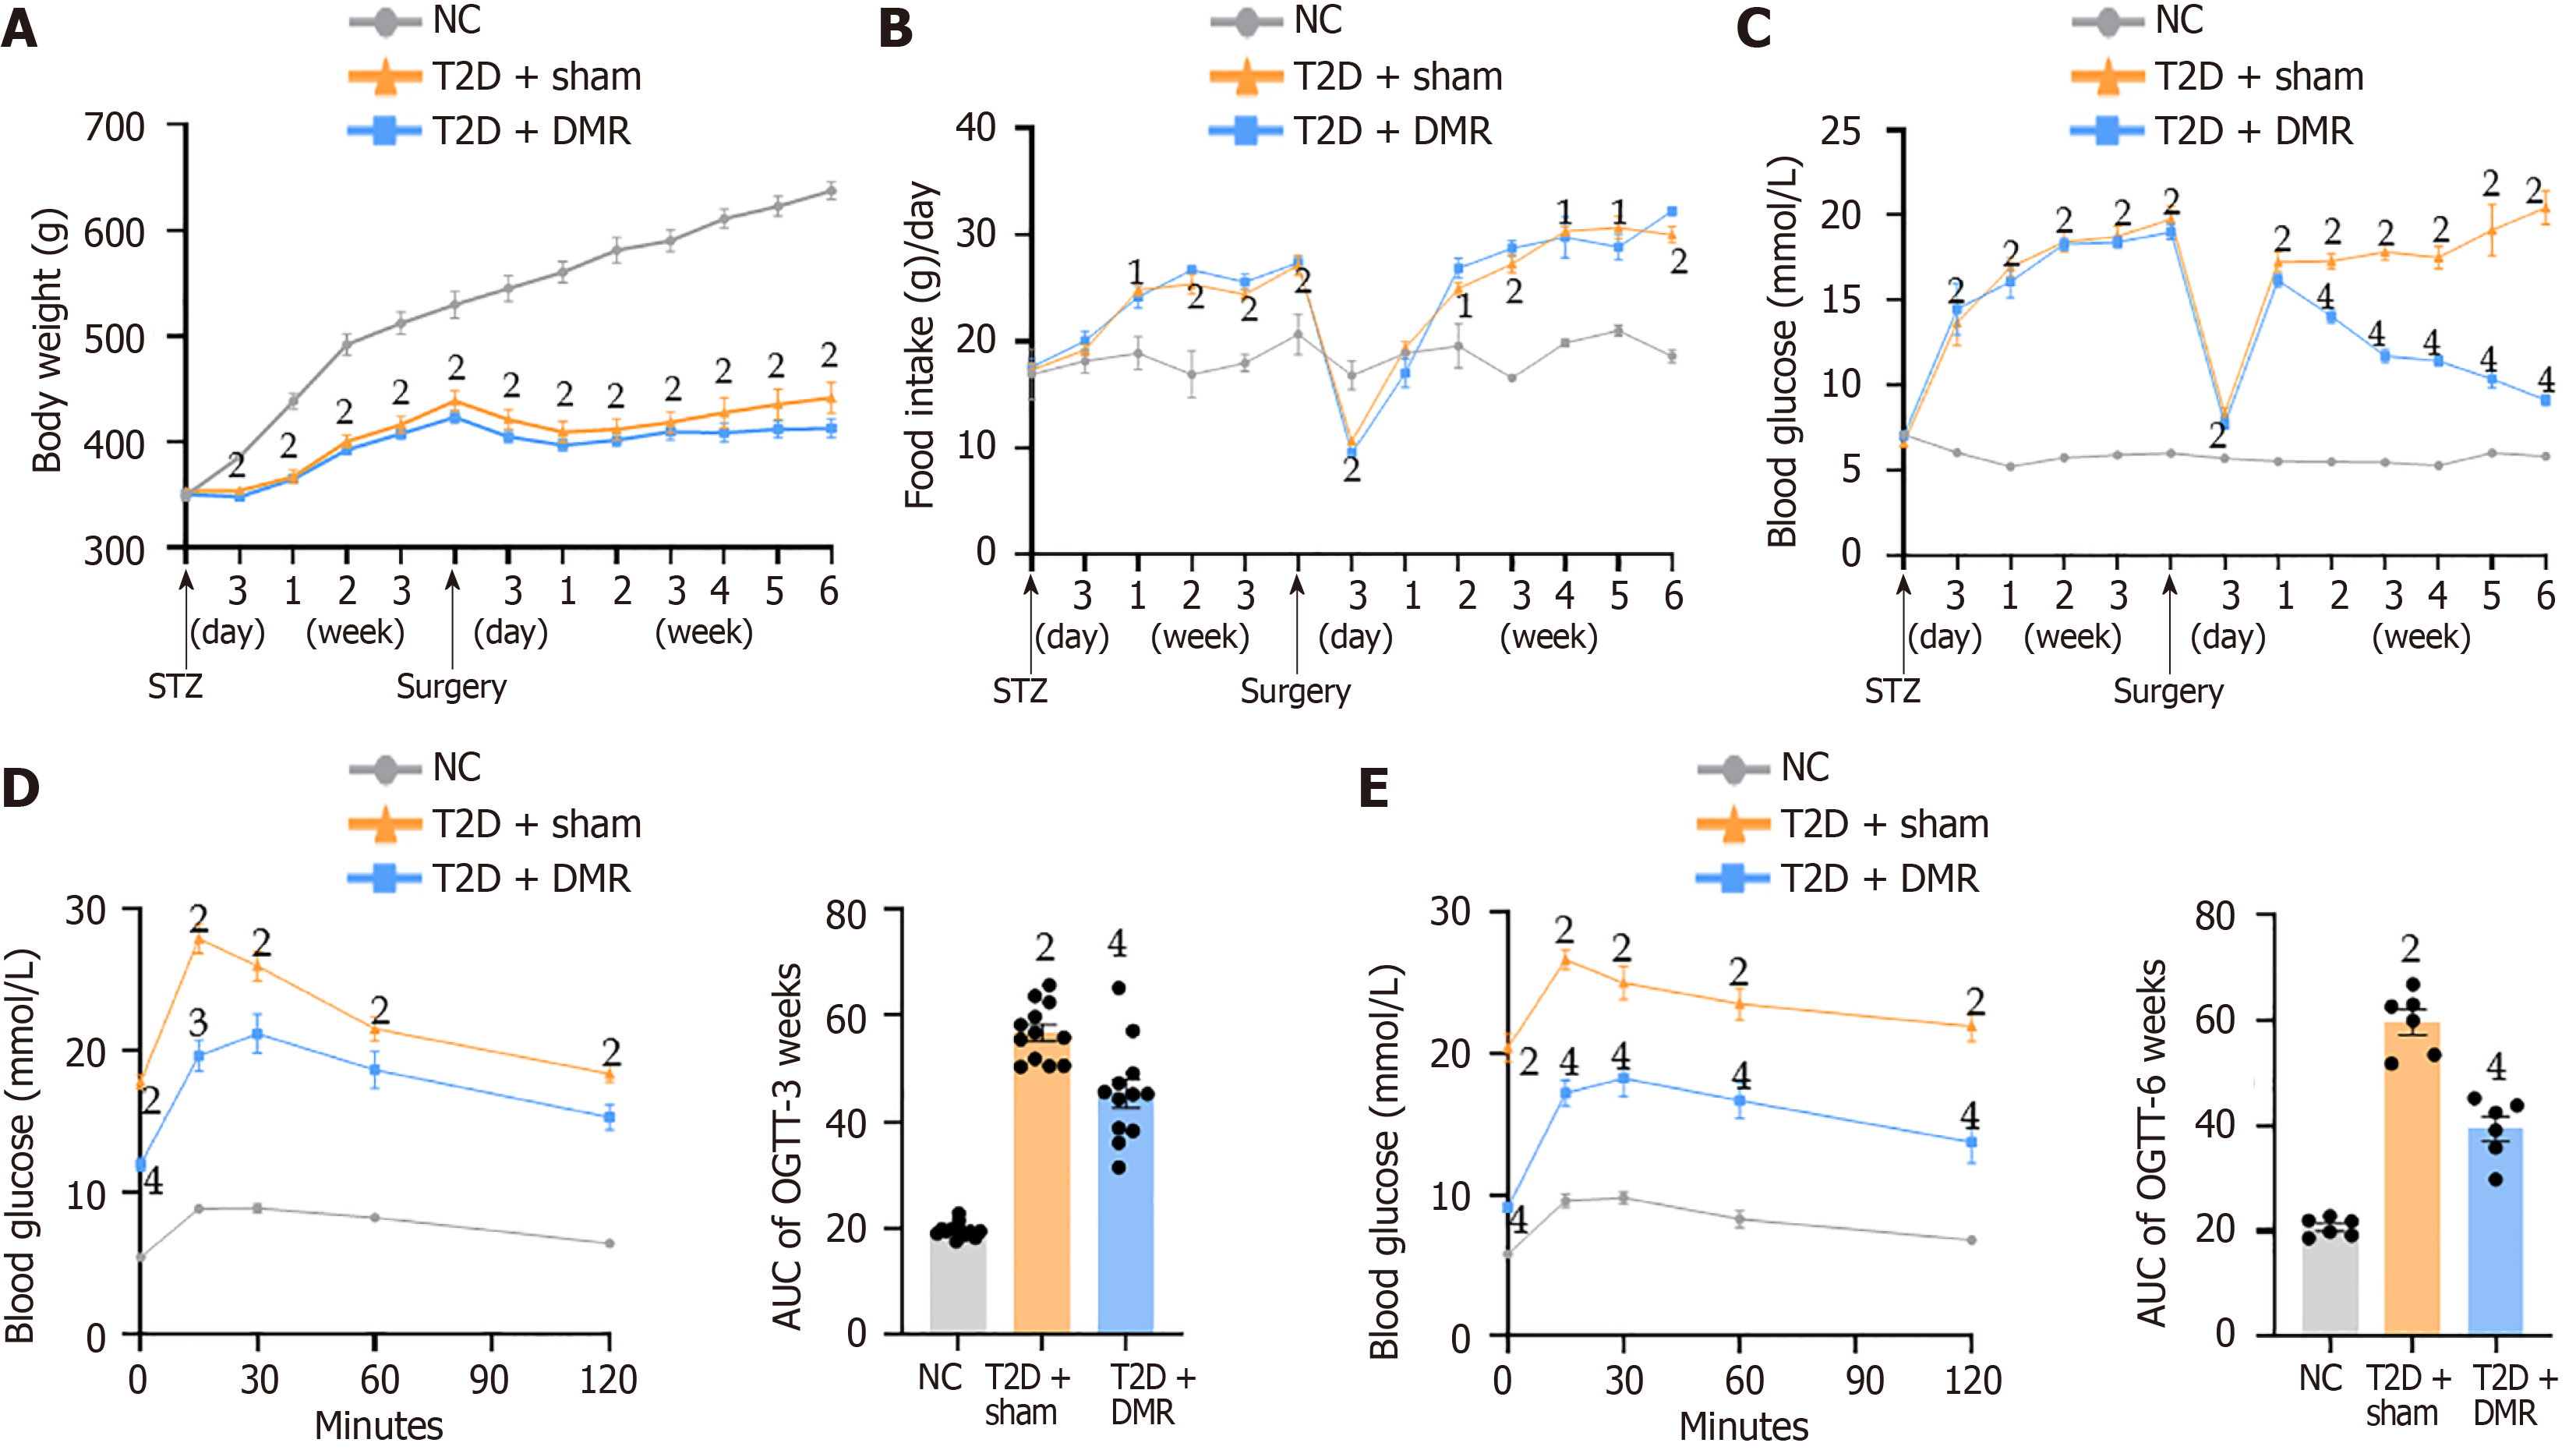
Figure 2 Effects of the duodenal mucosal resurfacing procedure on phenotypic changes in type 2 diabetes rats.
A-C: Body weight, food intake and fasting blood glucose throughout the experimental period after intraperitoneal injection of streptozotocin (n = 6 or 12 mice per group); D and E: Glucose excursion curves and the area under curve of oral glucose tolerance tests performed at postoperative weeks 3 (n = 12 mice per group) and 6 (n = 6 mice per group). Data are presented as mean ± SE. 1P < 0.01 vs normal control group. 2P < 0.001 vs normal control group. 3P < 0.01 vs type 2 diabetes-sham group. 4P < 0.001 vs type 2 diabetes-sham group. DMR: Duodenal mucosal resurfacing; T2D: Type 2 diabetes; NC: Normal control; STZ: Streptozotocin; OGTT: Oral glucose tolerance test; AUC: Area under curve.
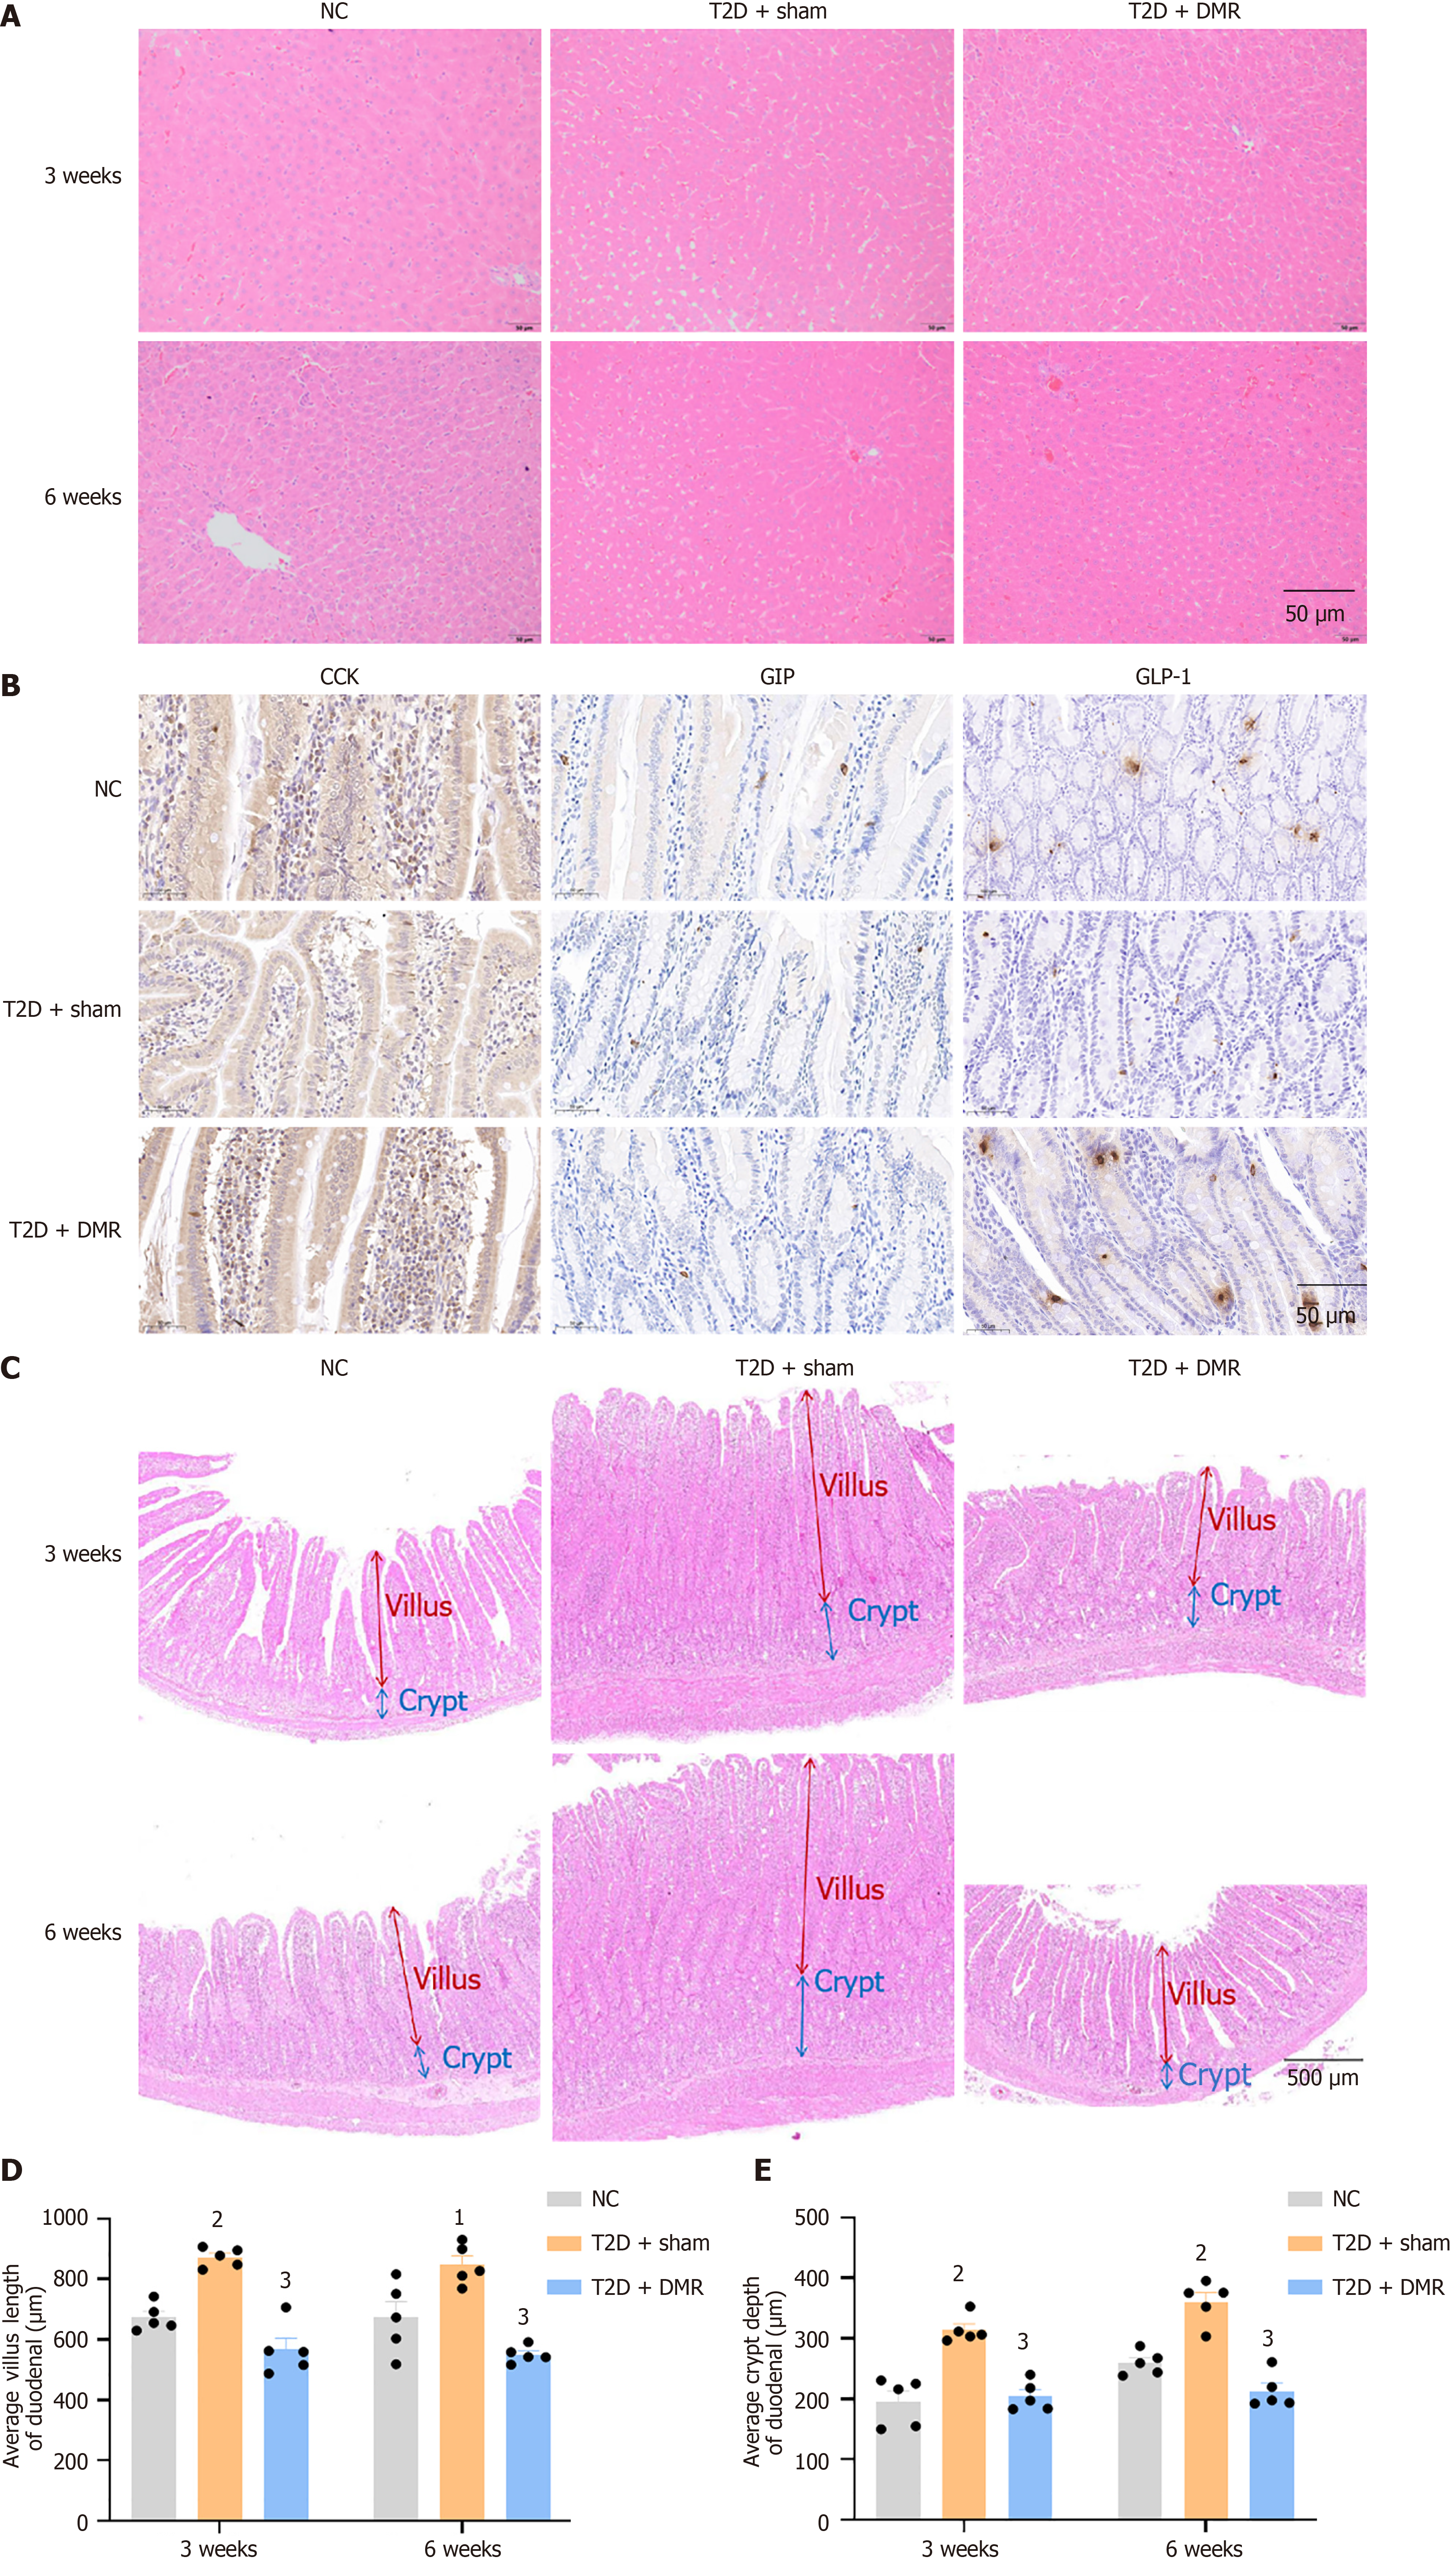
Figure 3 Effects of duodenal mucosal resurfacing procedure on liver, enteroendocrine cells, duodenal villi, and crypts in type 2 diabetes rats.
A: Hematoxylin and eosin (HE) staining of the liver in normal control (NC), type 2 diabetes (T2D) + sham and T2D + duodenal mucosal resurfacing (DMR) rats at postoperative weeks 3 and 6 (n = 5 mice per group, Scale bar = 50 μm); B: Immunohistochemical analyses of duodenal cholecystokinin, gastric inhibitory peptide, glucagon-like peptide 1 in NC, T2D + sham and T2D + DMR rats at postoperative weeks 6 (n = 4 mice per group, Scale bar = 50 μm); C: HE staining of the duodenum in NC, T2D + sham and T2D + DMR rats at postoperative weeks 3 and 6 (n = 5 mice per group, Scale bar = 500 μm); D and E: The villus length and crypt depth in NC, T2D + sham and T2D + DMR rats at postoperative weeks 3 and 6 (n = 5 mice per group). Data are presented as mean ± SE. 1P < 0.01 vs normal control group. 2P < 0.001 vs normal control group. 3P < 0.001 vs type 2 diabetes-sham group. DMR: Duodenal mucosal resurfacing; T2D: Type 2 diabetes; NC: Normal control; CCK: Cholecystokinin; GIP: Gastric inhibitory peptide; GLP-1: Glucagon-like peptide 1.
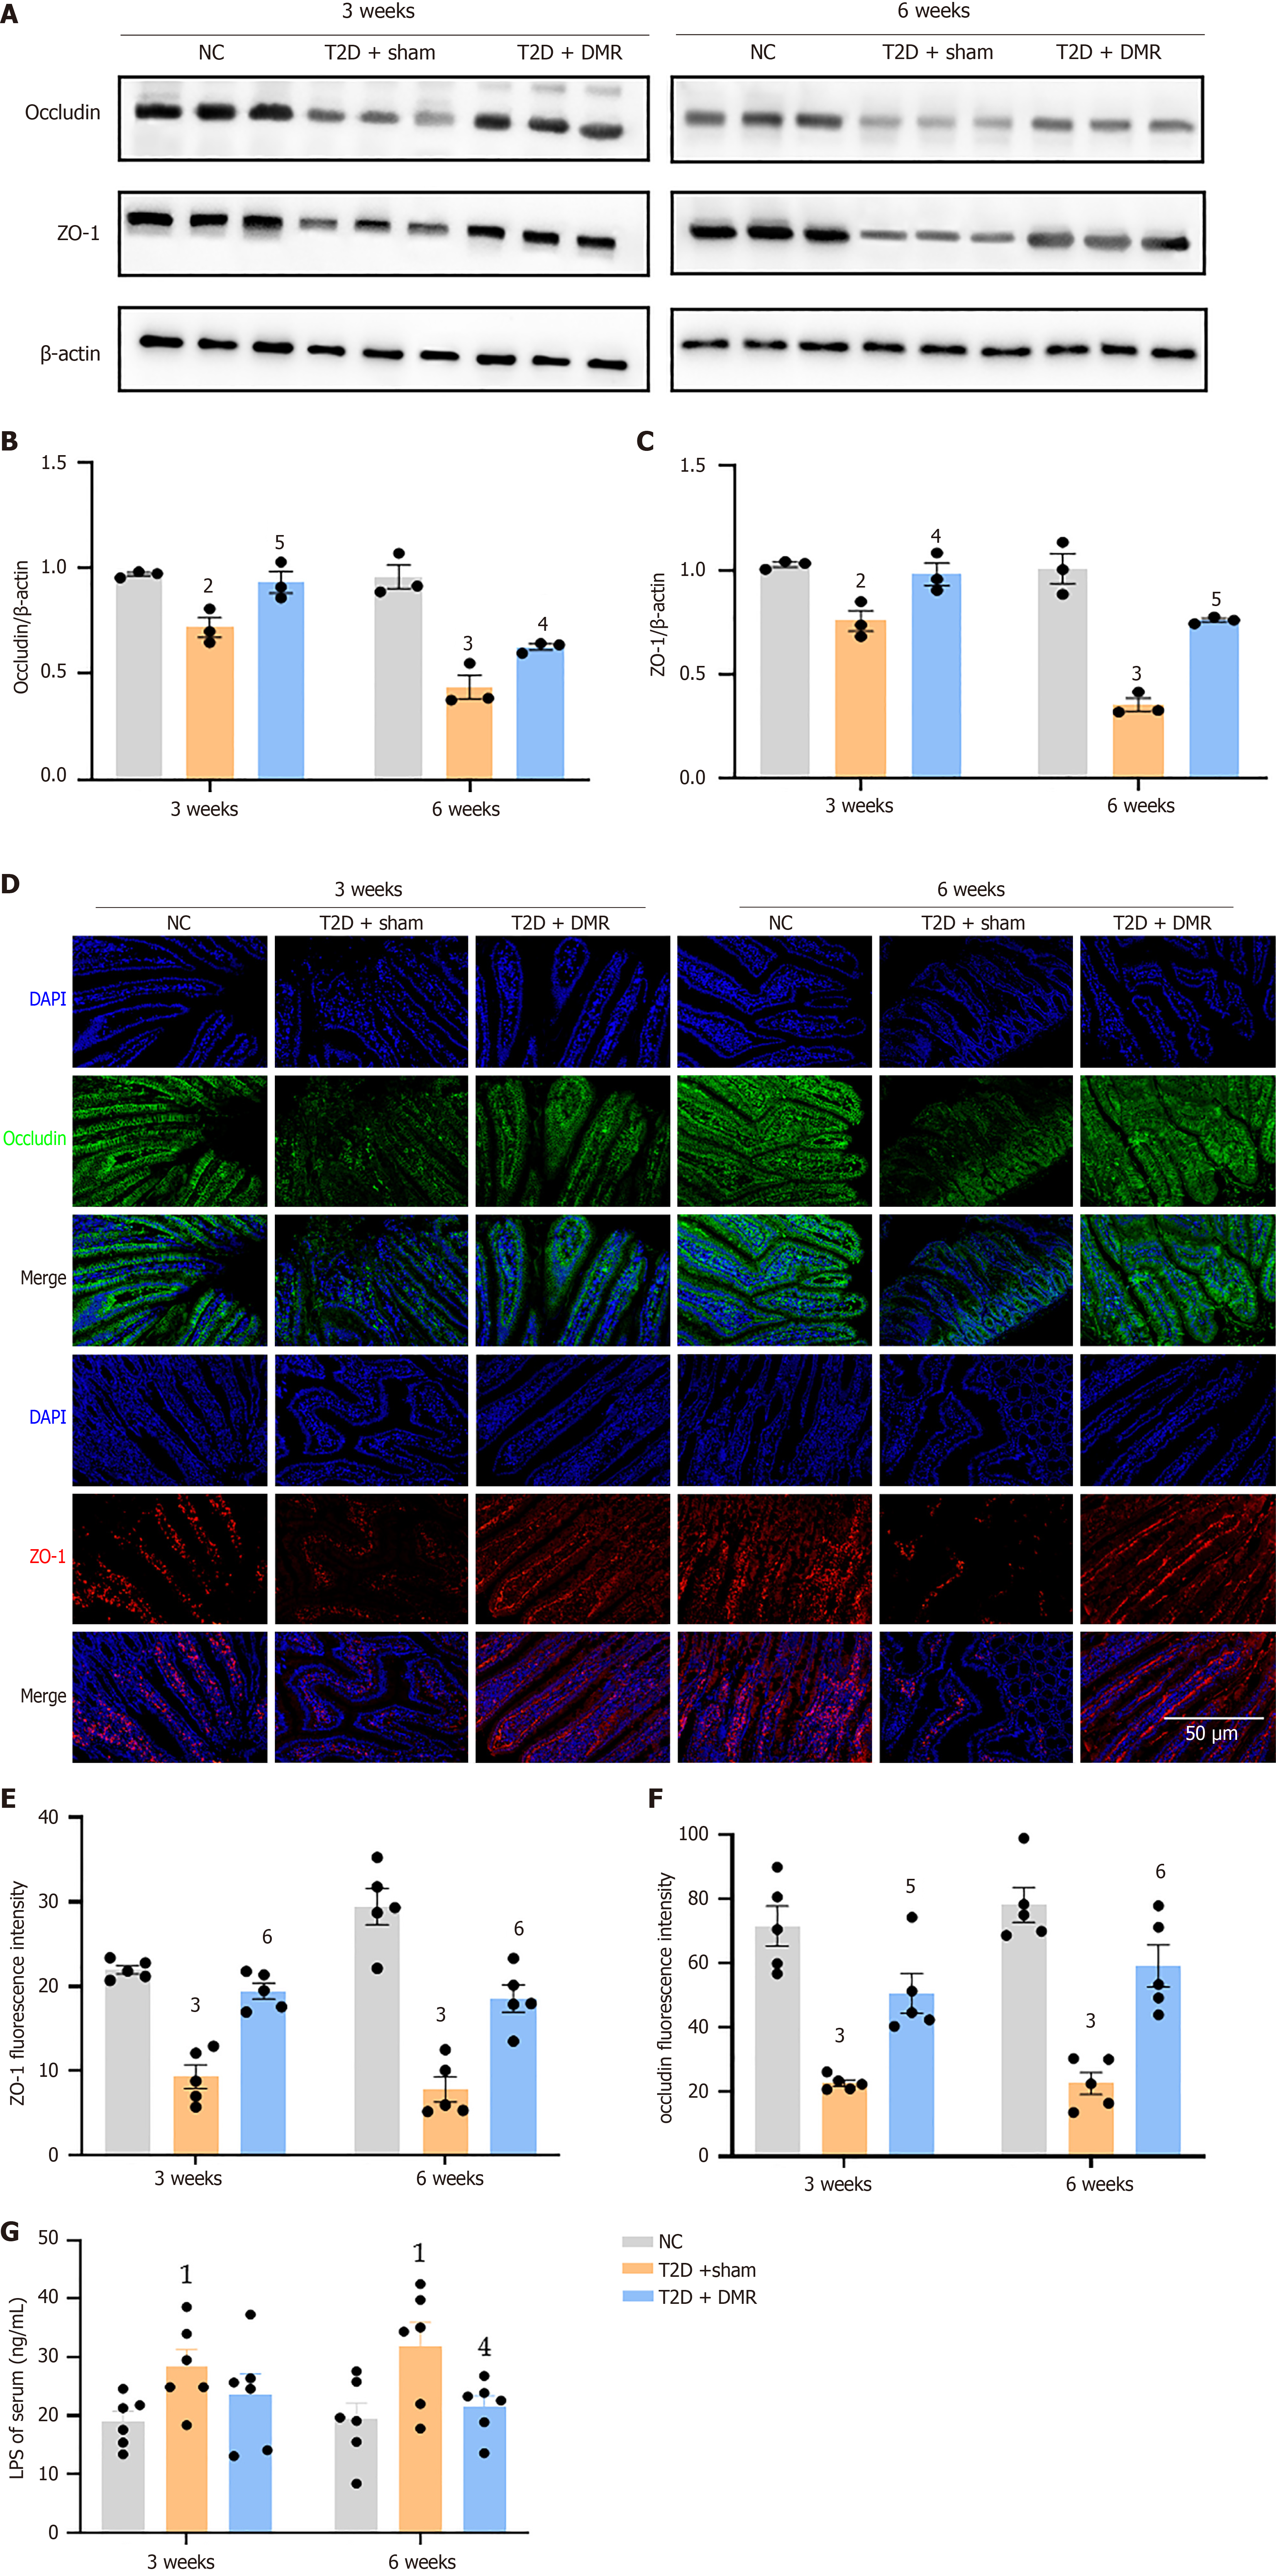
Figure 4 Effects of the duodenal mucosal resurfacing procedure on the duodenal mucosal barrier function in type 2 diabetes rats.
A: Protein extracts of duodenum were subjected to western blot analysis with antibodies to occludin, zonula occludens-1 (ZO-1) or β-actin; B and C: The blots of occludin and ZO-1 were quantified using image J software and normalized to β-actin levels (n = 3 mice per group); D: Representative images of immunofluorescence staining for occludin (green), ZO-1 (red) and 4’,6-diamidino-2-phenylindole (blue) of duodenum (Scale bar = 50 μm); E and F: The relative fluorescence intensity of occludin and ZO-1 (n = 5 mice per group); G: Serum lipopolysaccharide levels of rats at postoperative weeks 3 and 6 (n = 6 mice per group). Data are presented as mean ± SE. 1P < 0.05 vs normal control group. 2P < 0.01 vs normal control group. 3P < 0.001 vs normal control group. 4P < 0.05 vs type 2 diabetes-sham group. 5P < 0.01 vs type 2 diabetes-sham group. 6P < 0.001 vs type 2 diabetes-sham group. DMR: Duodenal mucosal resurfacing; T2D: Type 2 diabetes; NC: Normal control; LPS: Lipopolysaccharide; ZO-1: Zonula occludens-1; DAPI: 4’,6-diamidino-2-phenylindole.
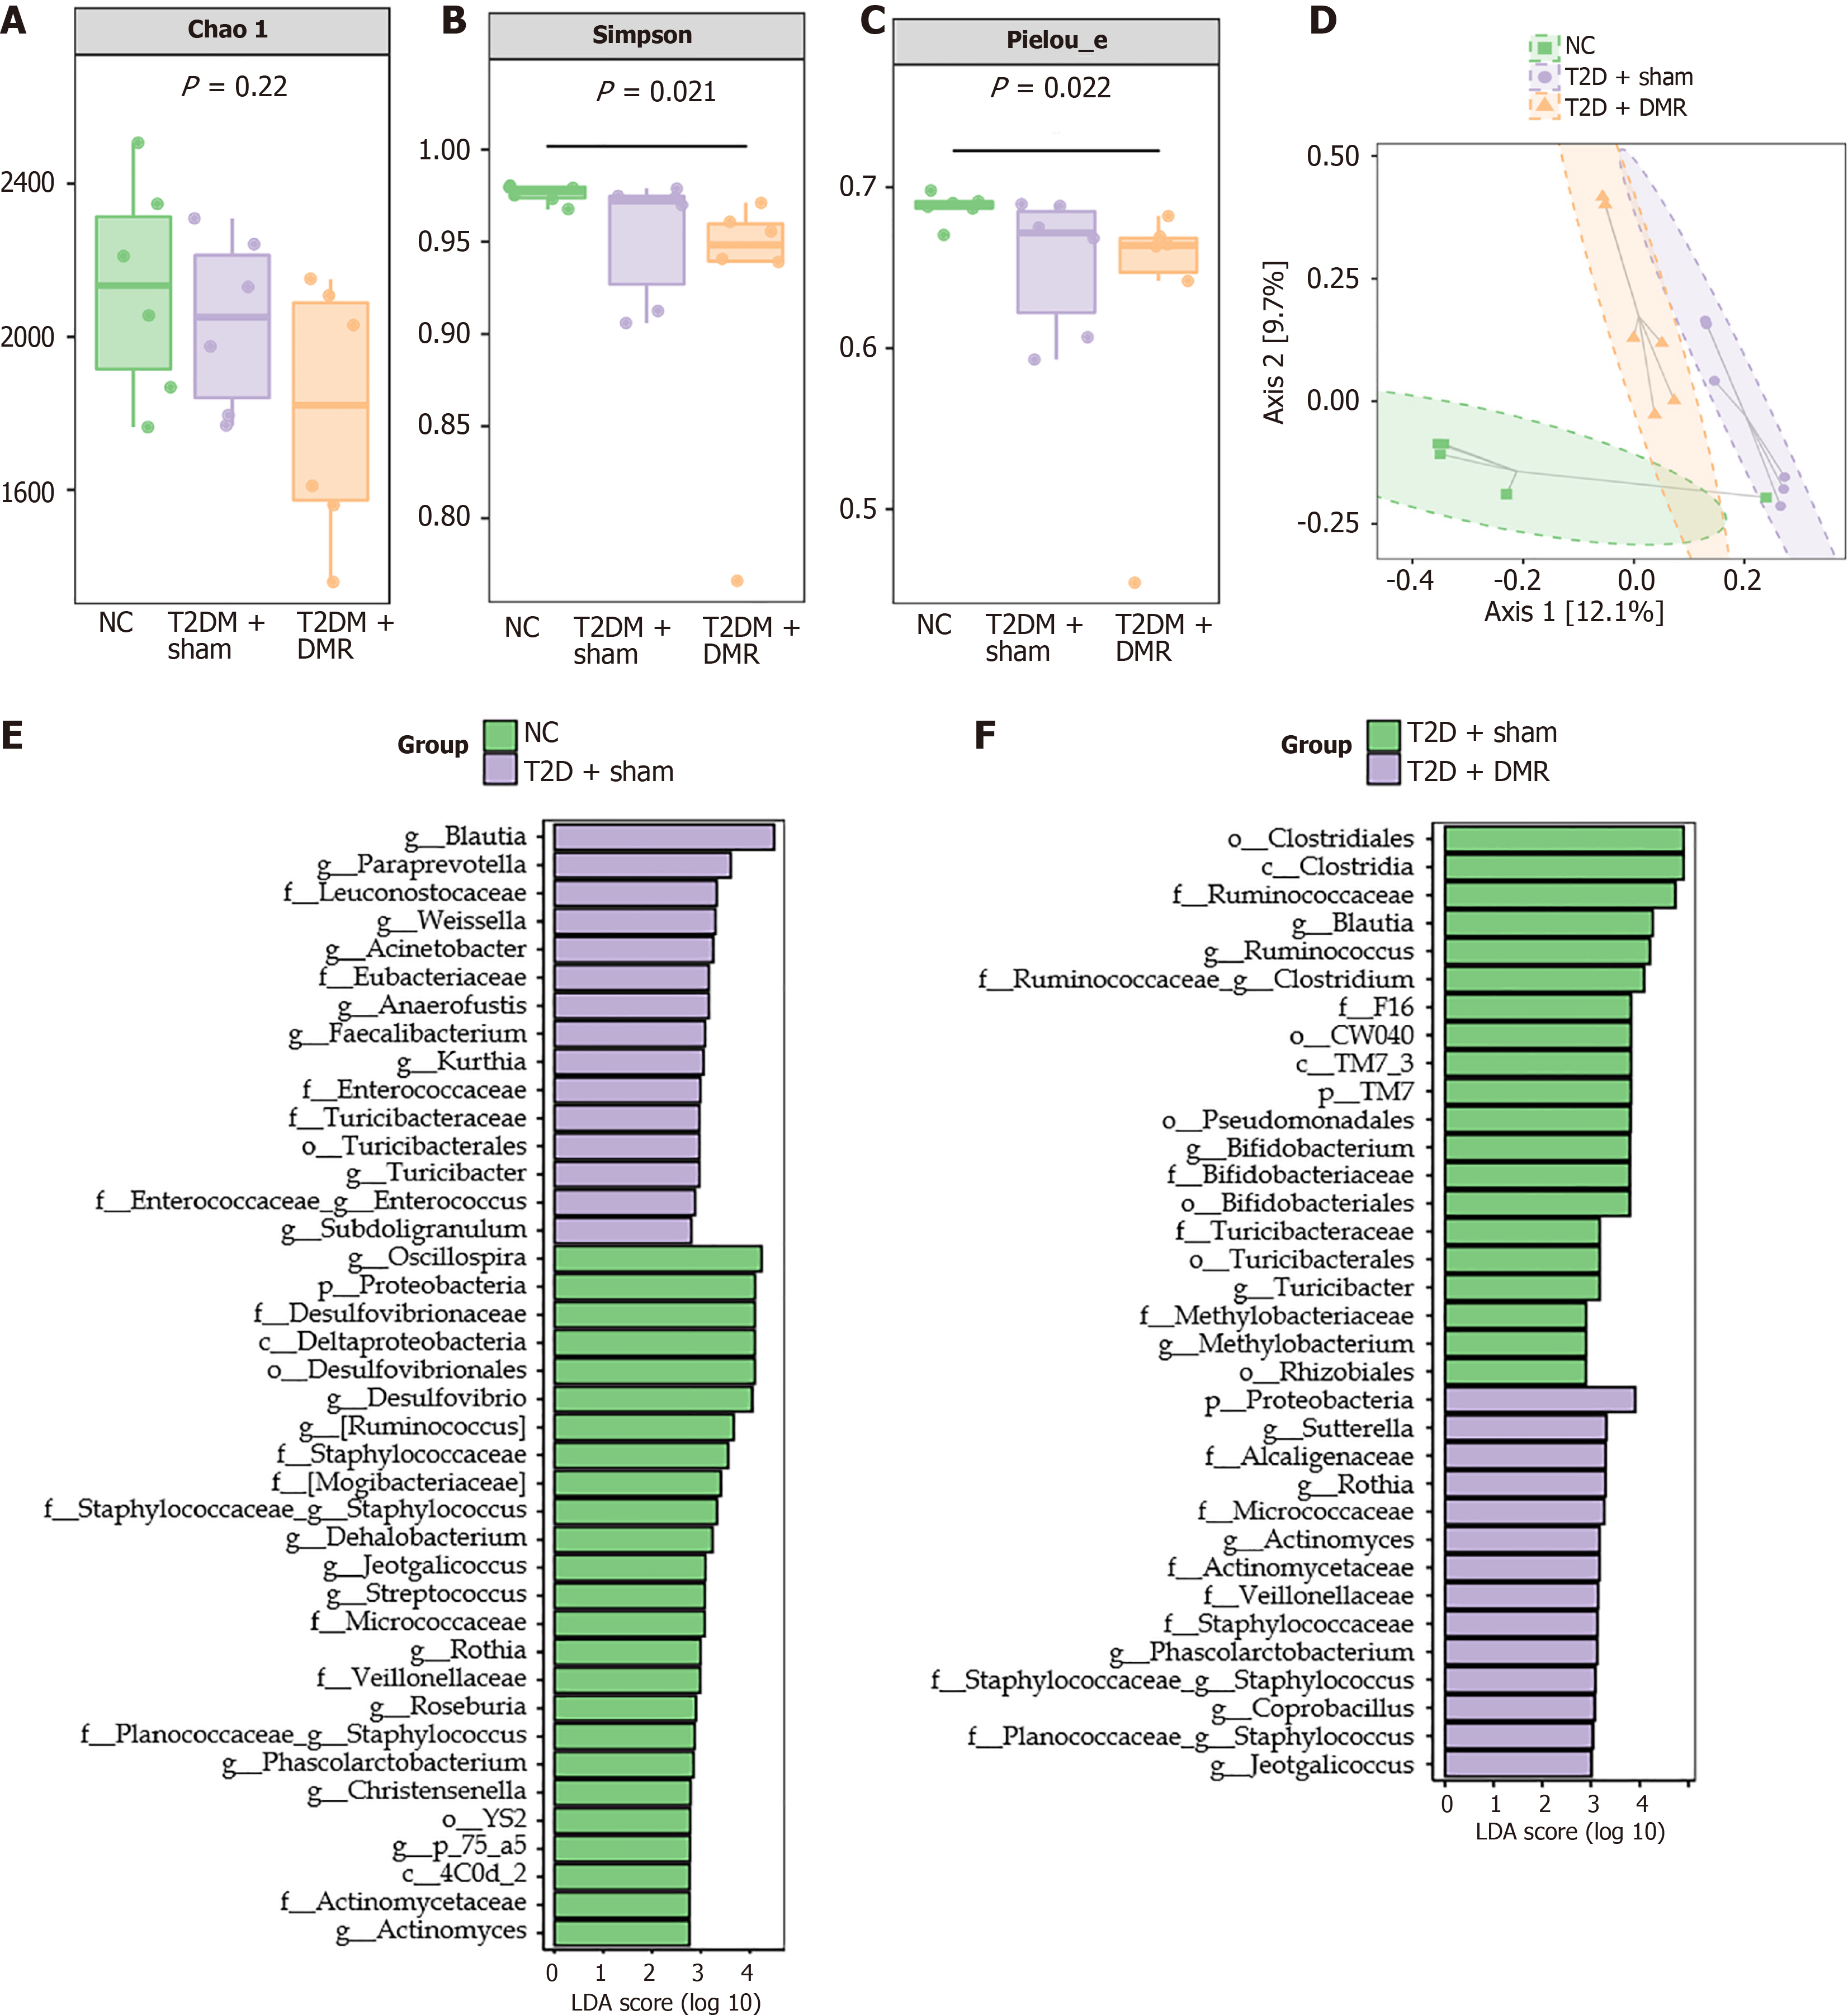
Figure 5 Effects of the duodenal mucosal resurfacing procedure on gut microbiota in type 2 diabetes rats.
A-C: Analysis of the alpha-diversity values including Chao1, Simpson, and Pielou’s evenness index; D: Principal coordinates analysis of β-diversity; E and F: Graphics of linear discriminant analysis effect size confirmed the most variously abundant taxa of gut microbiota in the normal control, type 2 diabetes-sham, and type 2 diabetes-duodenal mucosal resurfacing groups (n = 5-6 mice per group). DMR: Duodenal mucosal resurfacing; NC: Normal control; T2D: Type 2 diabetes; LDA: Linear discriminant analysis.
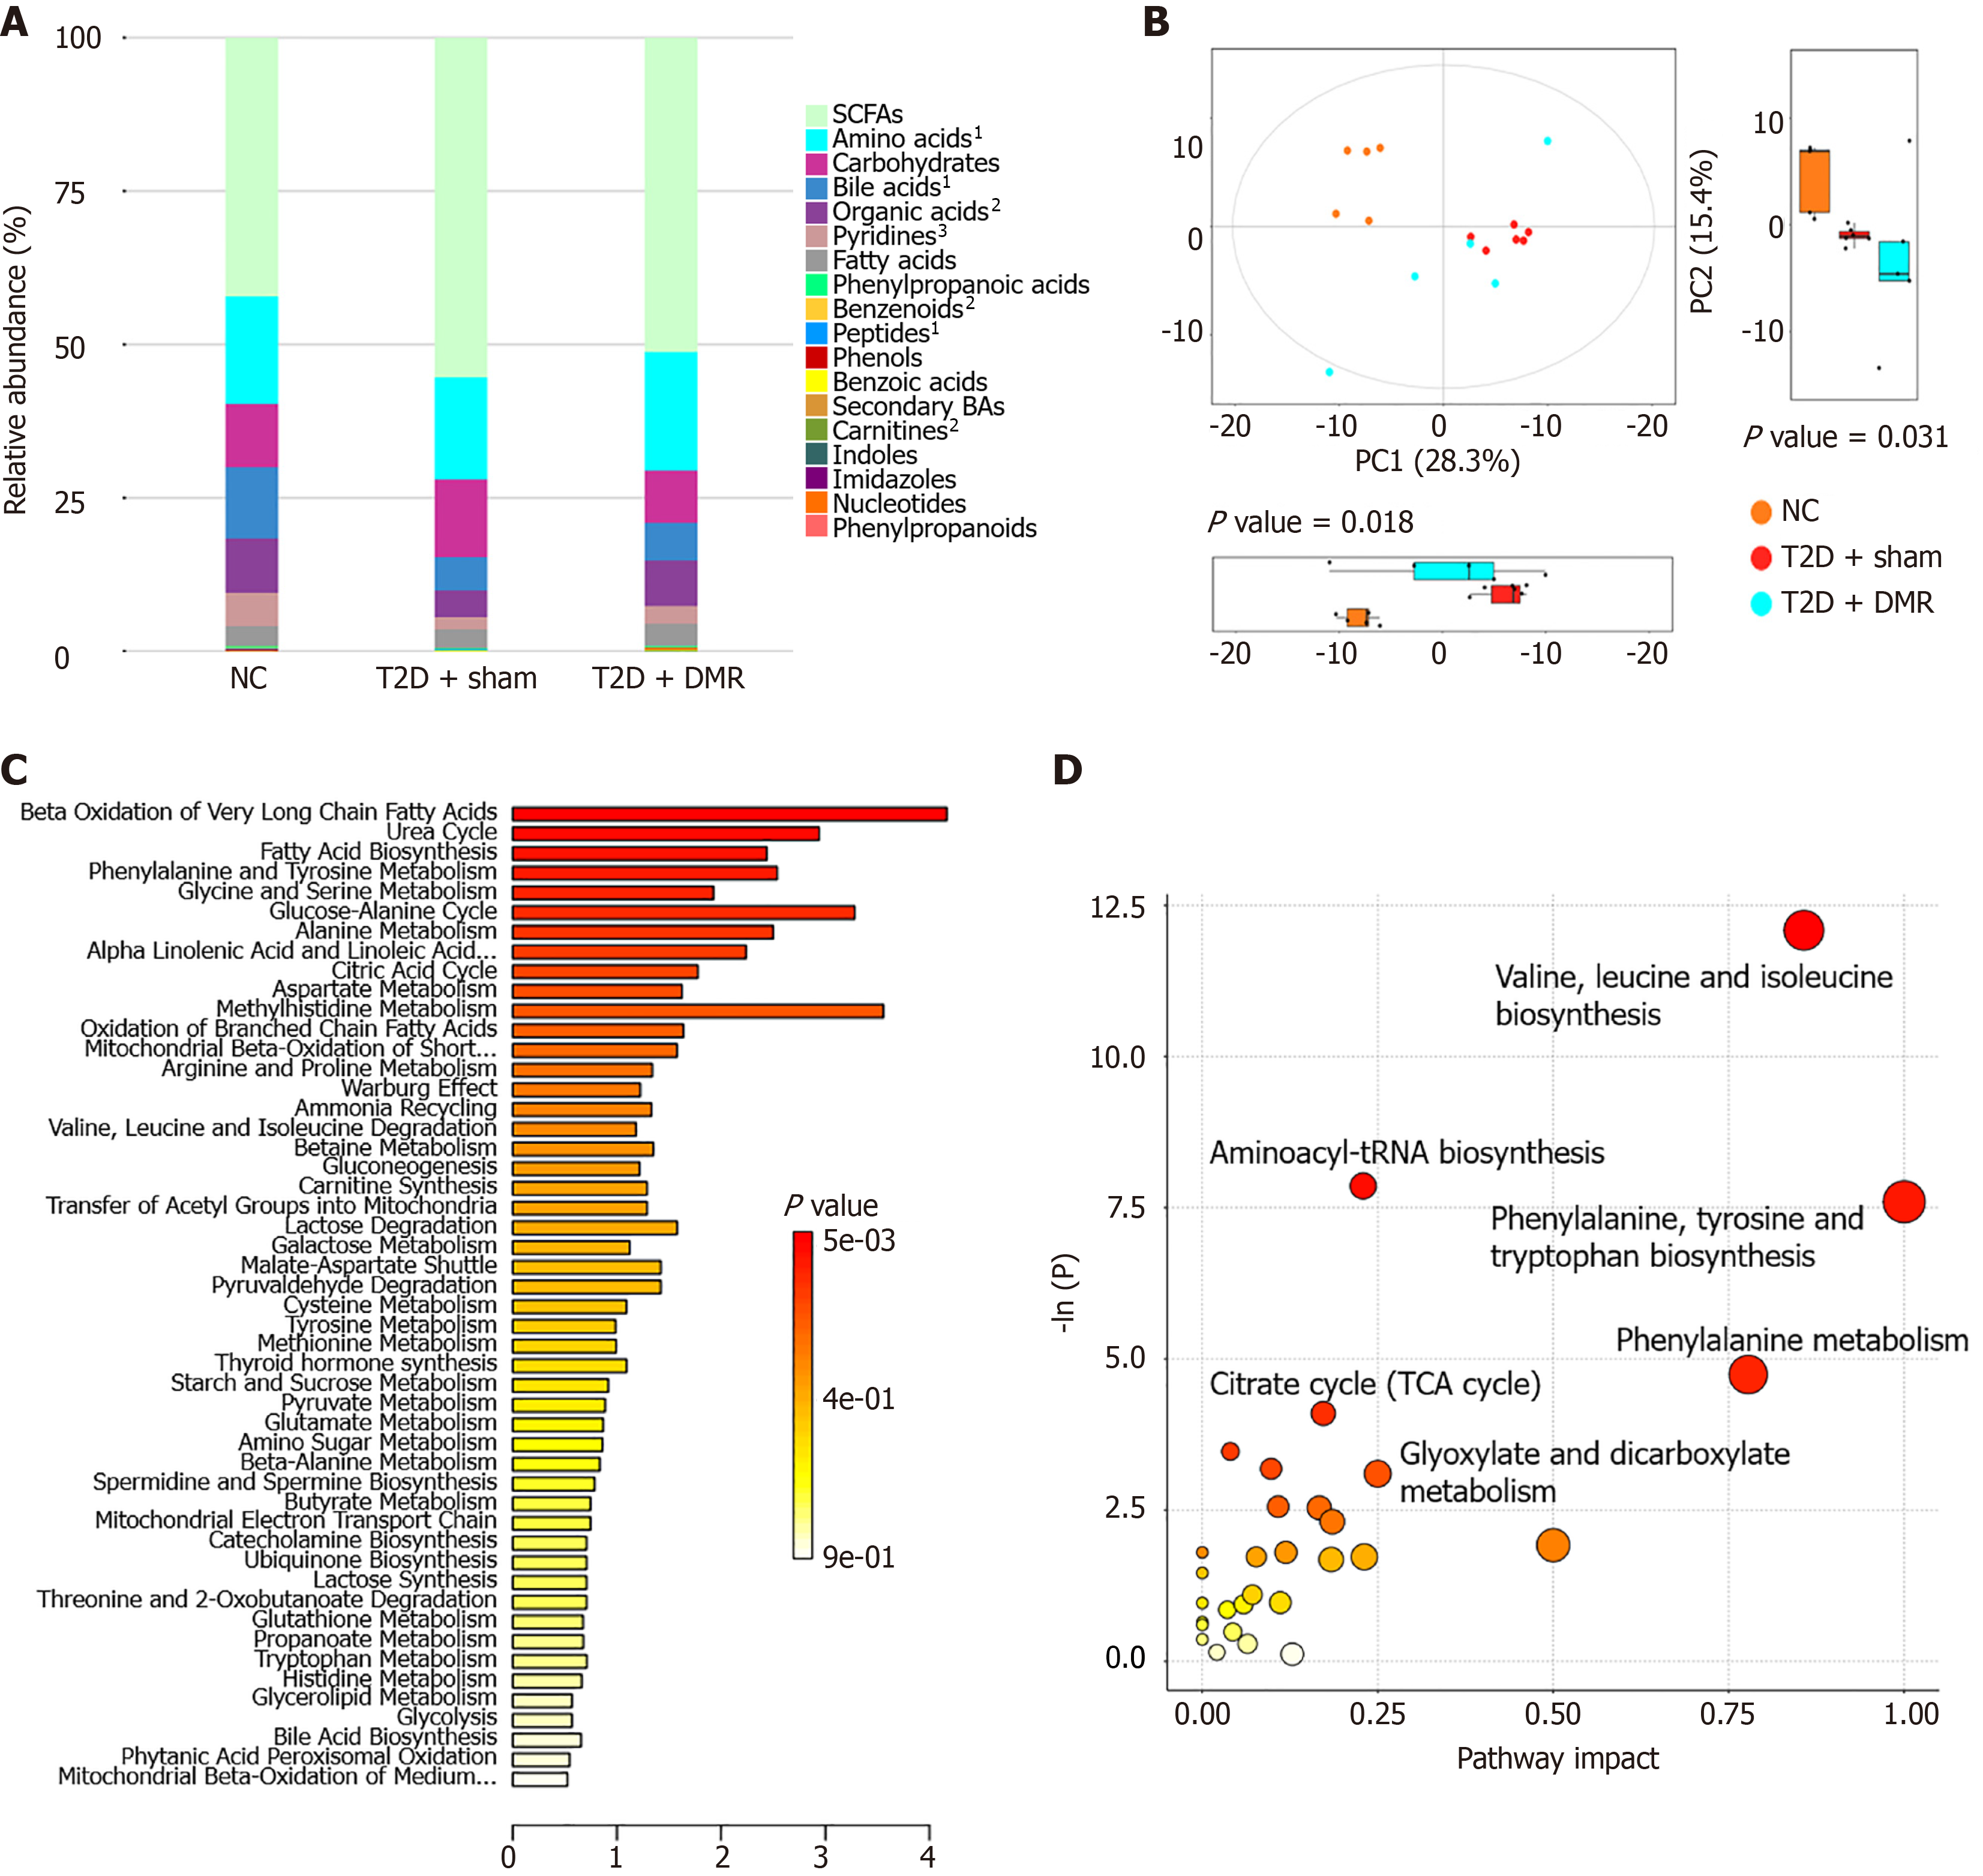
Figure 6 Metabolites and prospective metabolic pathways related to type 2 diabetes and the duodenal mucosal resurfacing procedure.
A: Stacked bar chart of relative abundance statistics for the median values of various metabolites in the colonic contents of rats; B: Two-dimensional principal component analysis score map of colonic contents samples and corresponding box plot of principal component analysis scores; C: Bar chart of small molecule pathway database-associated metabolite sets used in the pathway enrichment analysis; D: Bubble chart of the rno library pathway analysis. 1P < 0.05. 2P < 0.01. 3P < 0.001. DMR: Duodenal mucosal resurfacing; NC: Normal control; SCFA: Short-chain fatty acid; T2D: Type 2 diabetes; BAs: Bile Acids; PC1: Principal component 1; PC2: Principal component 2; TCA: Taurocholic acid.
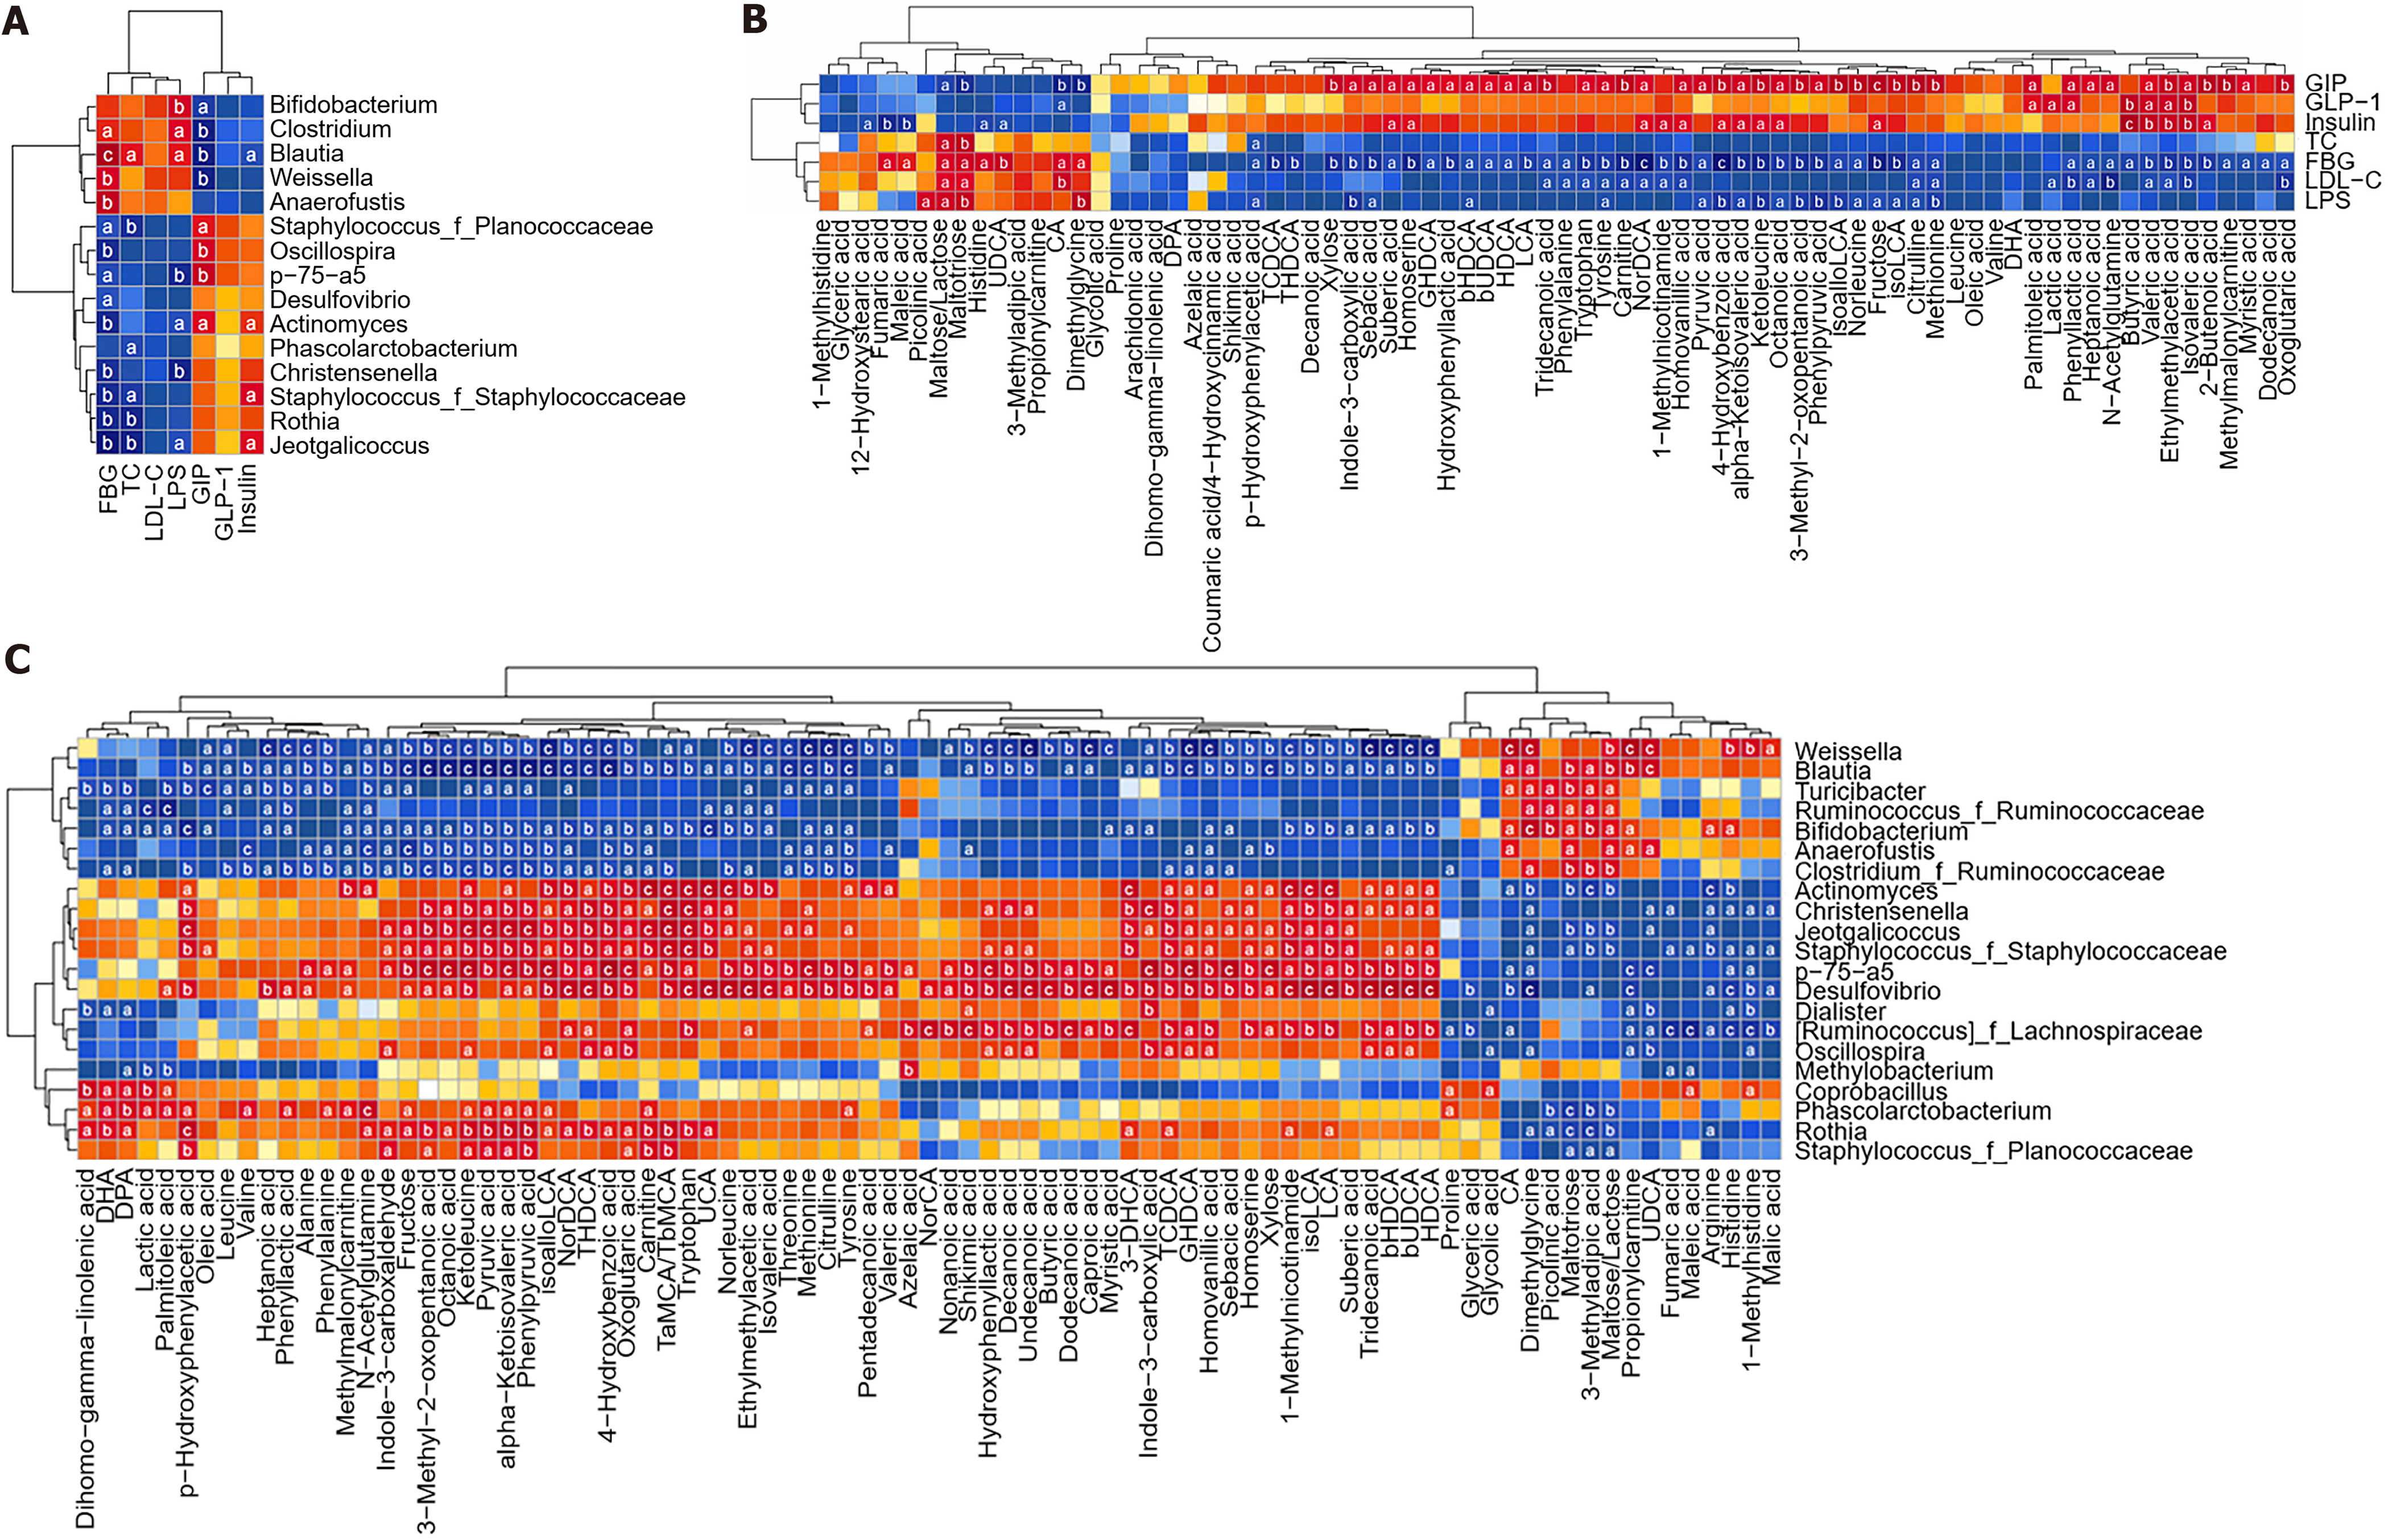
Figure 7 Heat map of the Spearman rank-correlation coefficients between differential microbes, metabolites and type 2 diabetes-related traits.
A: Spearman rank-correlation coefficients between characteristic microbes and type 2 diabetes (T2D)-related traits at the genus level; B: Spearman rank-correlation coefficients between metabolites and T2D-related traits; C: Spearman rank-correlation coefficients between characteristic microbes and metabolites at the genus level. DMR: Duodenal mucosal resurfacing; FBG: Fasting blood glucose; GIP: Gastric inhibitory peptide; GLP-1: Glucagon-like peptide 1; LDL-C: Low-density lipoprotein cholesterol; LPS: Lipopolysaccharide; NC: Normal control; SCFA: Short-chain fatty acid; T2D: Type 2 diabetes; TC: Total cholesterol; DHA: Docosahexaenoic acid; DPA: Docosapentaenoic acid; GHDCA: Glycohyodeoxycholate; LCA: Lithocholic acid; TCDCA: Taurochenodeoxycholate; THDCA: Taurohyodeoxycholic acid; UDCA: Ursodeoxycholic acid; HDCA: α-hyodeoxycholic acid; CA: Cholic acid; UCA: Ursocholic acid.
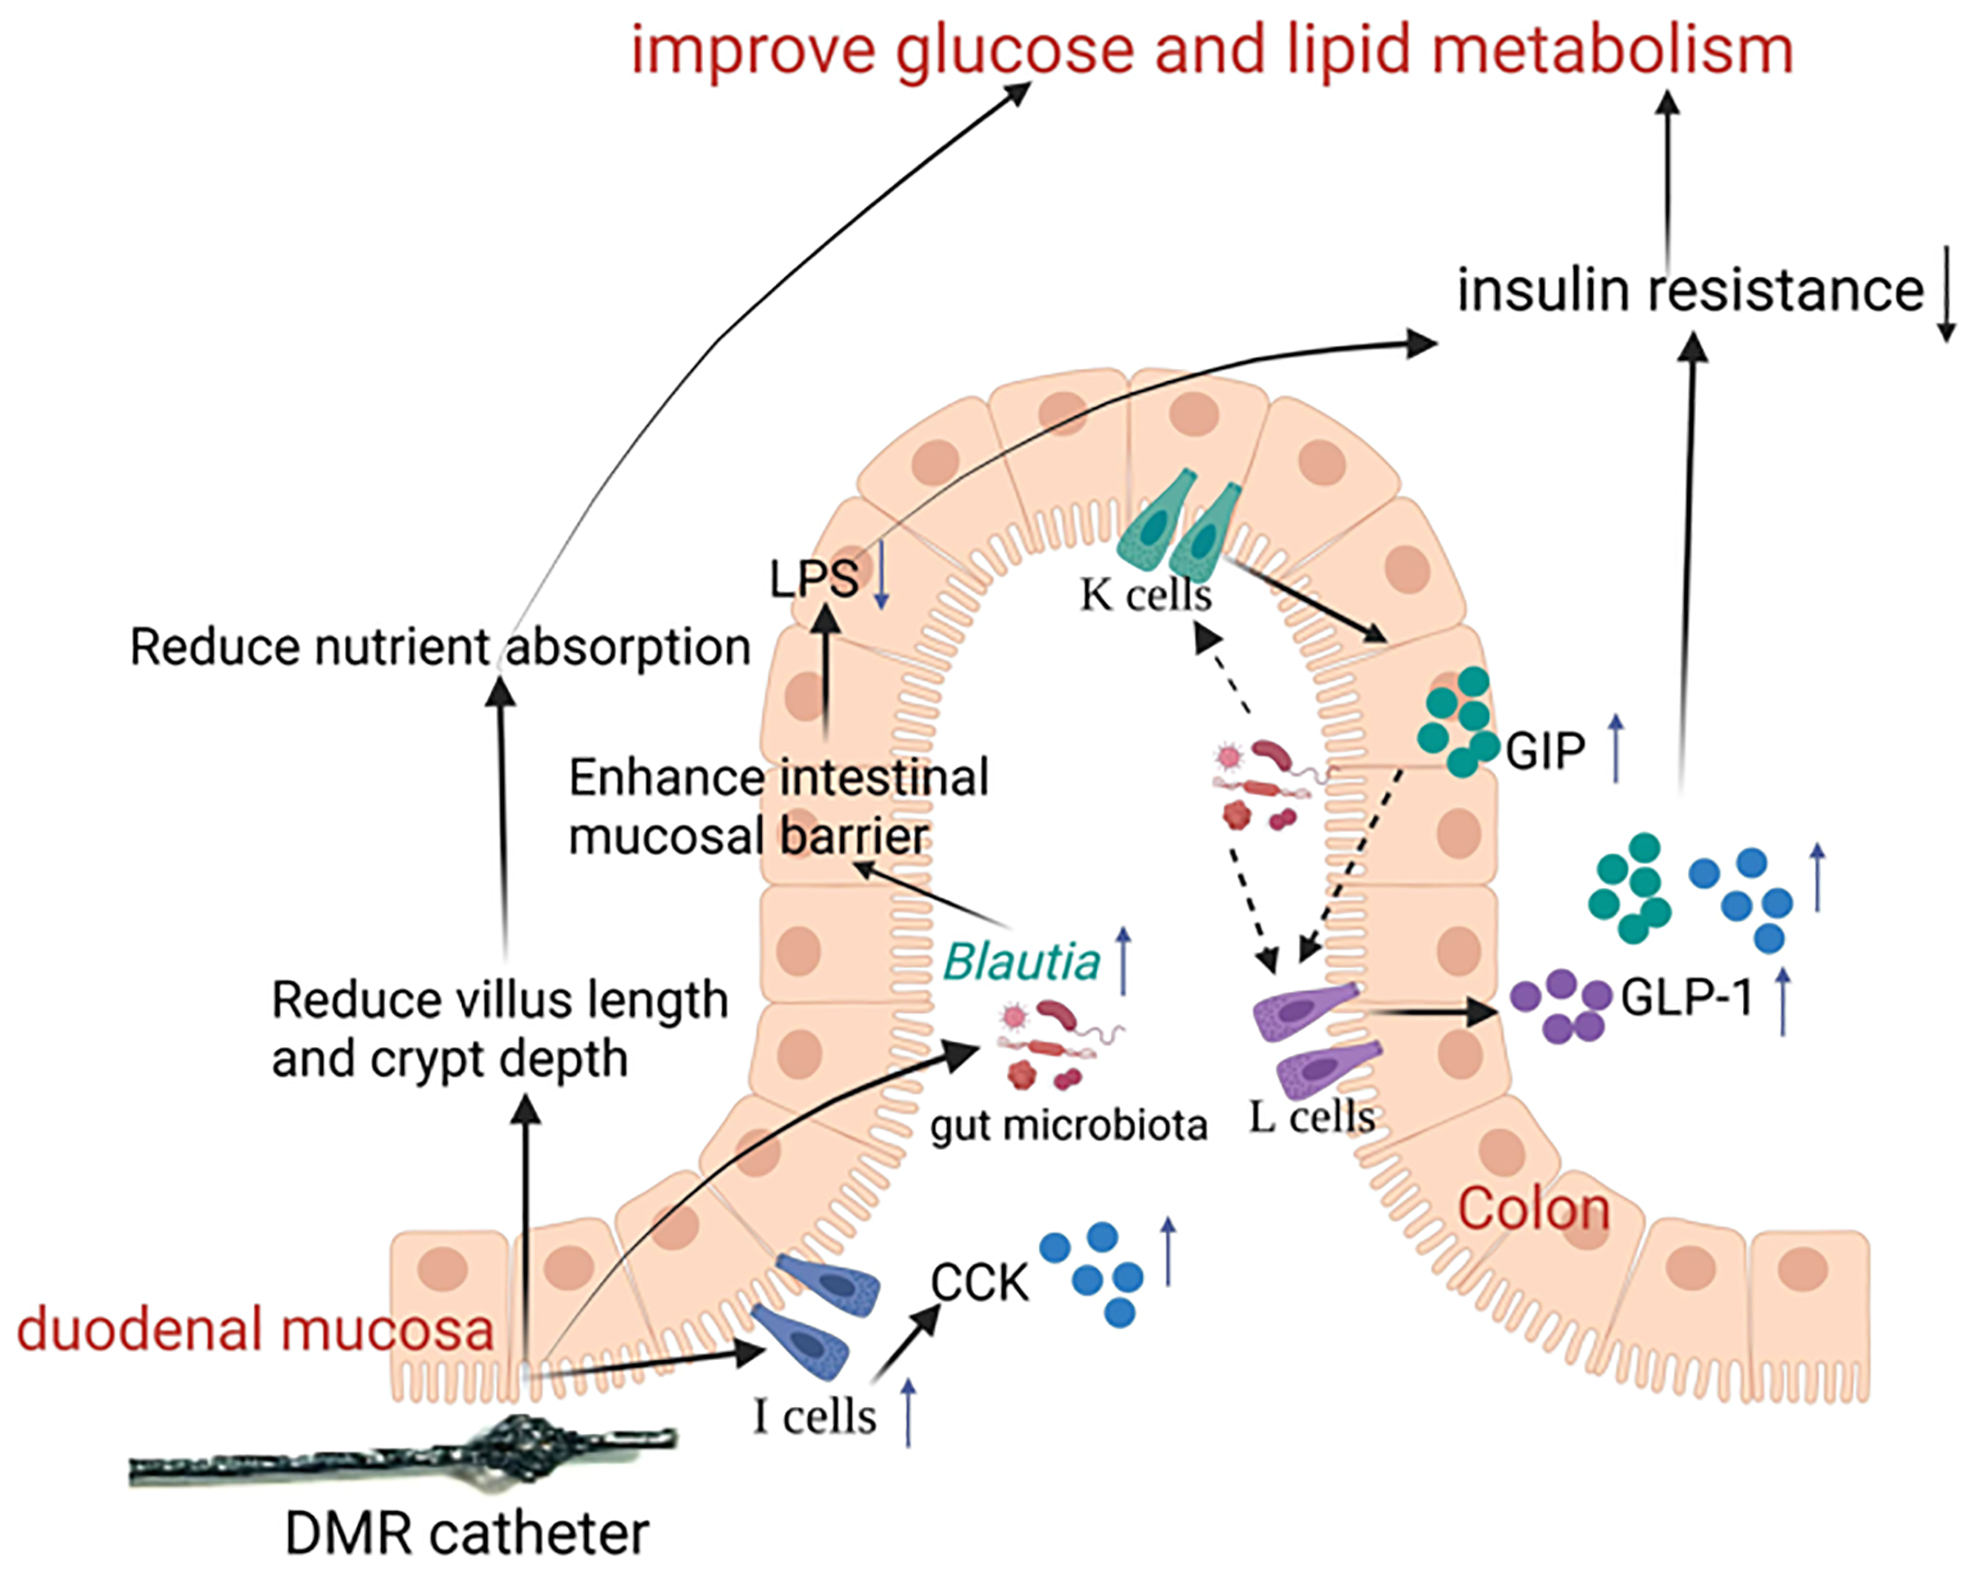
Figure 8 Schematic representation of the mechanisms by which the duodenal mucosal resurfacing procedure improves the control of metabolic disorders.
This diagram illustrates the hypothesized mechanisms through which duodenal mucosal resurfacing procedure improves blood glucose and liver metabolic disorders in a type 2 diabetes rat model. The black solid line arrows indicate promotion effects; the black dashed line arrows indicate potential promotion effects; the black inverted arrows indicate the content or activity decrease; the blue forward arrows indicate the content or activity increase; and the T-shaped solid line without an arrow indicates inhibition. CCK: Cholecystokinin; DMR: Duodenal mucosal resurfacing; GIP: Gastric inhibitory peptide; GLP-1: Glucagon-like peptide 1; LPS: Lipopolysaccharide.
- Citation: Nie LJ, Cheng Z, He YX, Yan QH, Sun YH, Yang XY, Tian J, Zhu PF, Yu JY, Zhou HP, Zhou XQ. Role of duodenal mucosal resurfacing in controlling diabetes in rats. World J Diabetes 2025; 16(3): 102277
- URL: https://www.wjgnet.com/1948-9358/full/v16/i3/102277.htm
- DOI: https://dx.doi.org/10.4239/wjd.v16.i3.102277


