Copyright
©The Author(s) 2025.
World J Diabetes. Feb 15, 2025; 16(2): 98897
Published online Feb 15, 2025. doi: 10.4239/wjd.v16.i2.98897
Published online Feb 15, 2025. doi: 10.4239/wjd.v16.i2.98897
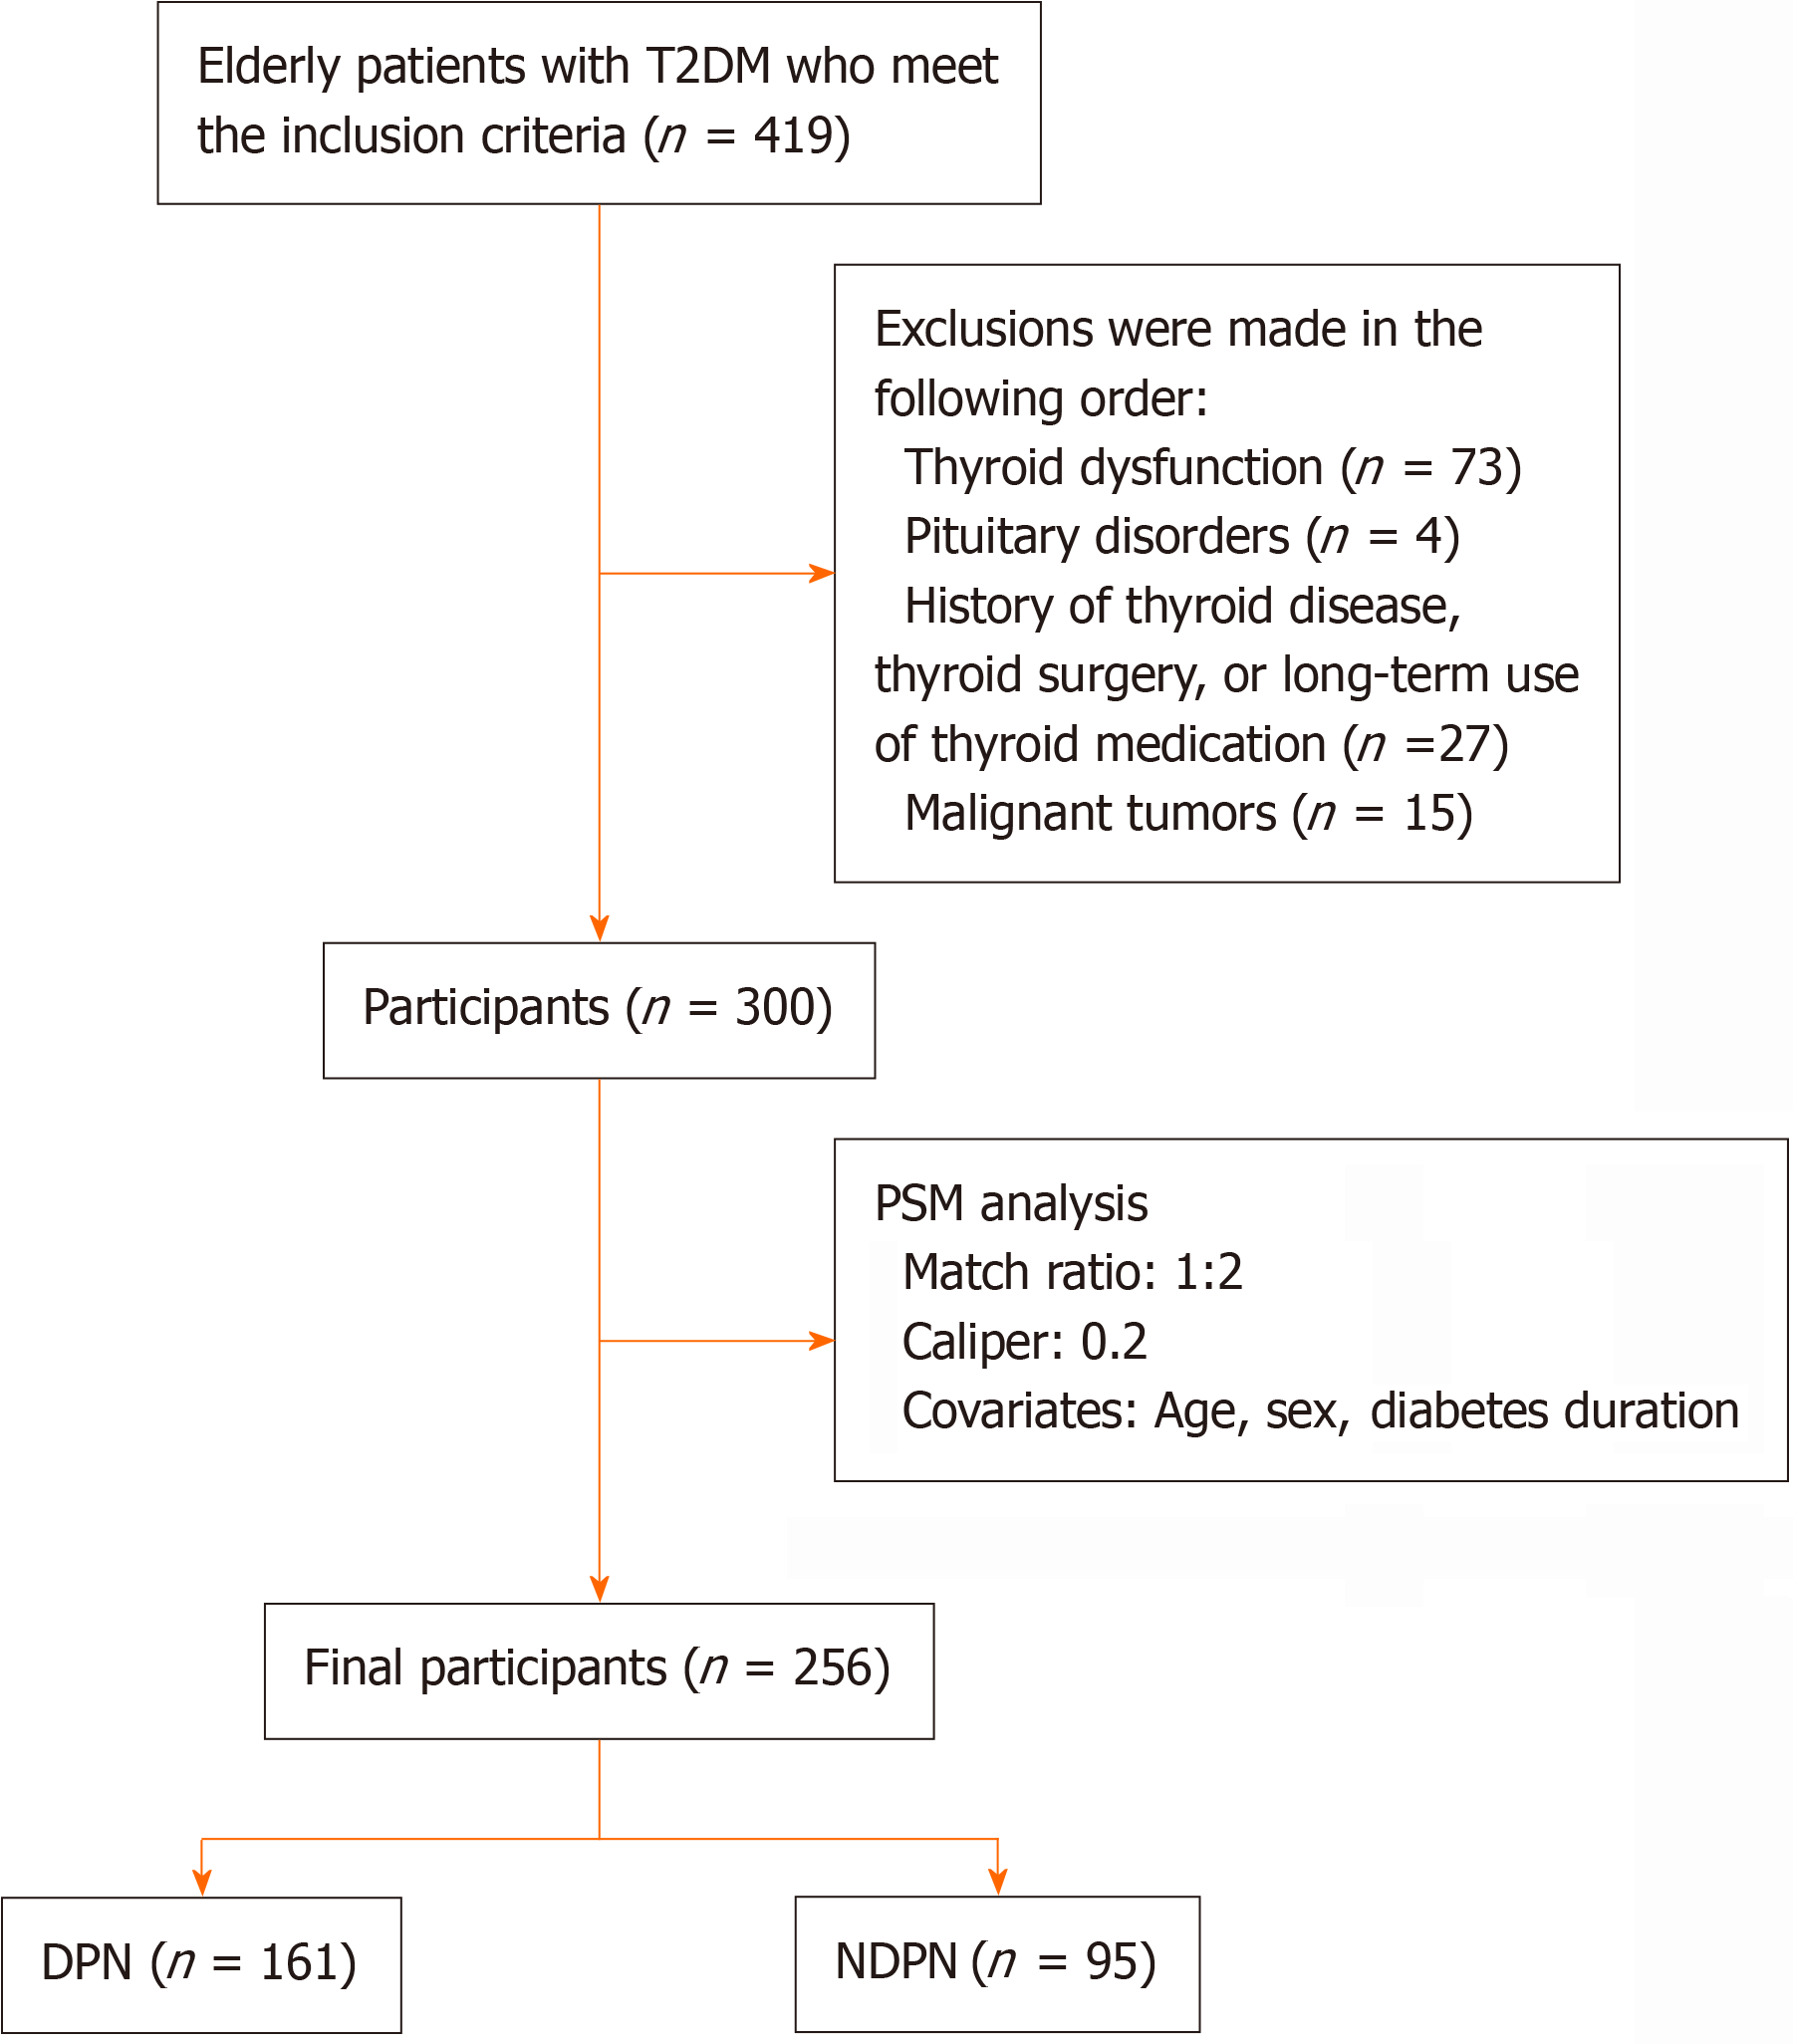
Figure 1 Flow diagram showing the selection of the study population.
DPN: Diabetic peripheral neuropathy; NDPN: Non diabetic peripheral neuropathy; PSM: Propensity score matching; T2DM: Type 2 diabetes mellitus.
Figure 2 Receiver operating characteristic curve of free triiodothyronine/free thyroxine for predicting diabetic peripheral neuropathy.
The receiver operating characteristic (ROC) curve plotted based on the random forest model evaluates the value of free triiodothyronine/free thyroxine (FT3/FT4) in predicting DPN. First, we used age, sex, duration of diabetes, hypertension, smoking, low-density lipoprotein cholesterol, triglycerides, hormglycated, fasting blood glucose, and body mass index to construct the model and generate the ROC curve (labeled as “original”). Then, we included FT3/FT4 as an additional feature in the model and generated a new ROC curve (labeled as “FT3/FT4”). ROC: Receiver operating characteristic; AUC: Area under the curve; FT3/FT4: Free triiodothyronine/free thyroxine ratio.
- Citation: Fei SJ, Luo JY, Wang WH, Guo LX, Pan Q. Correlation between diabetic peripheral neuropathy and thyroid hormone sensitivity in elderly patients with type 2 diabetes mellitus. World J Diabetes 2025; 16(2): 98897
- URL: https://www.wjgnet.com/1948-9358/full/v16/i2/98897.htm
- DOI: https://dx.doi.org/10.4239/wjd.v16.i2.98897


