Copyright
©The Author(s) 2025.
World J Diabetes. Feb 15, 2025; 16(2): 93130
Published online Feb 15, 2025. doi: 10.4239/wjd.v16.i2.93130
Published online Feb 15, 2025. doi: 10.4239/wjd.v16.i2.93130
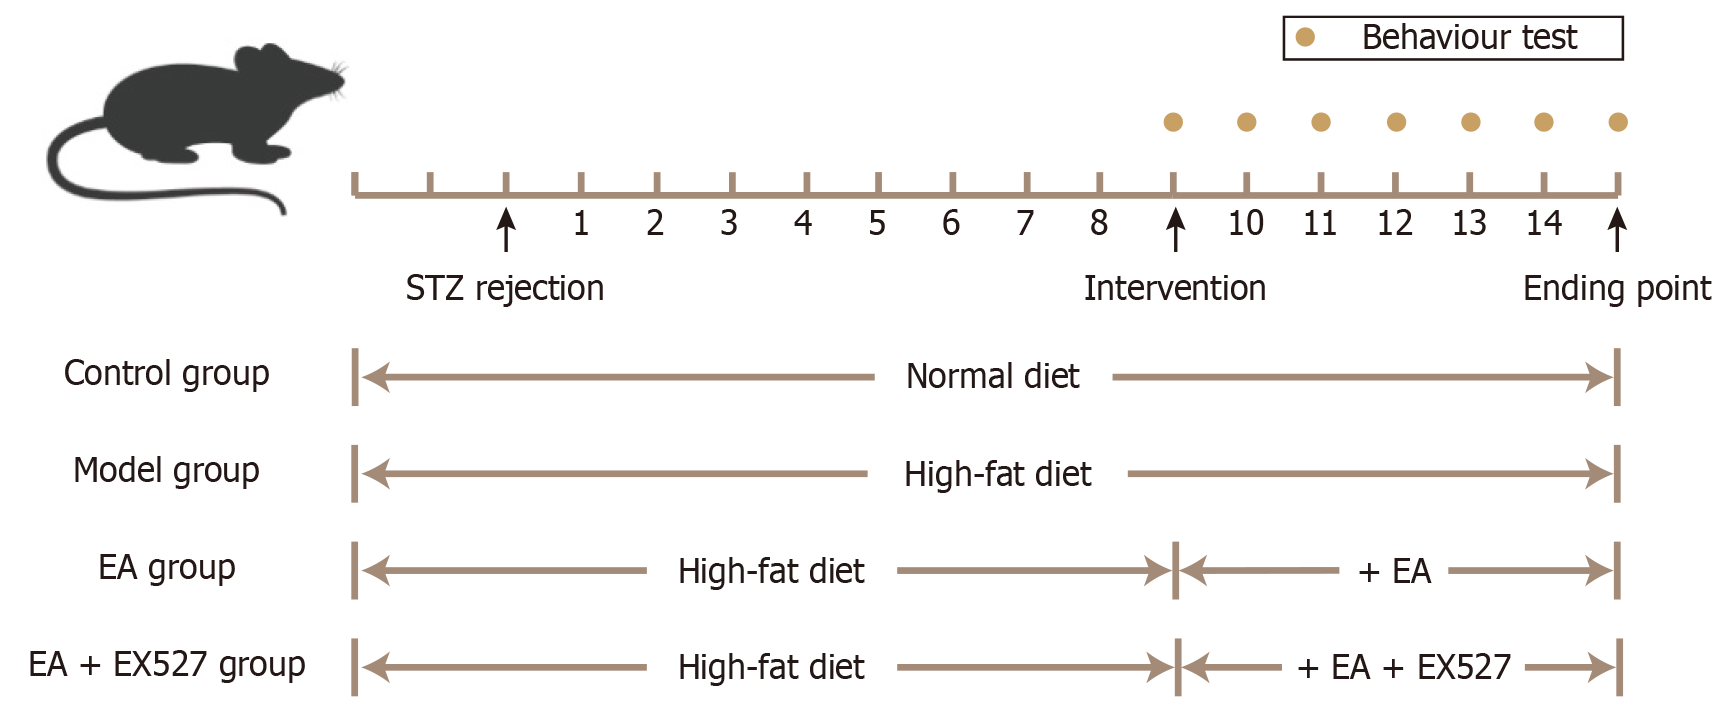
Figure 1 Experimental timeline of type 2 diabetic peripheral neuropathy rats modeling, behavior testing, and intervention.
EA: Electroacupuncture; STZ: Streptozotocin.
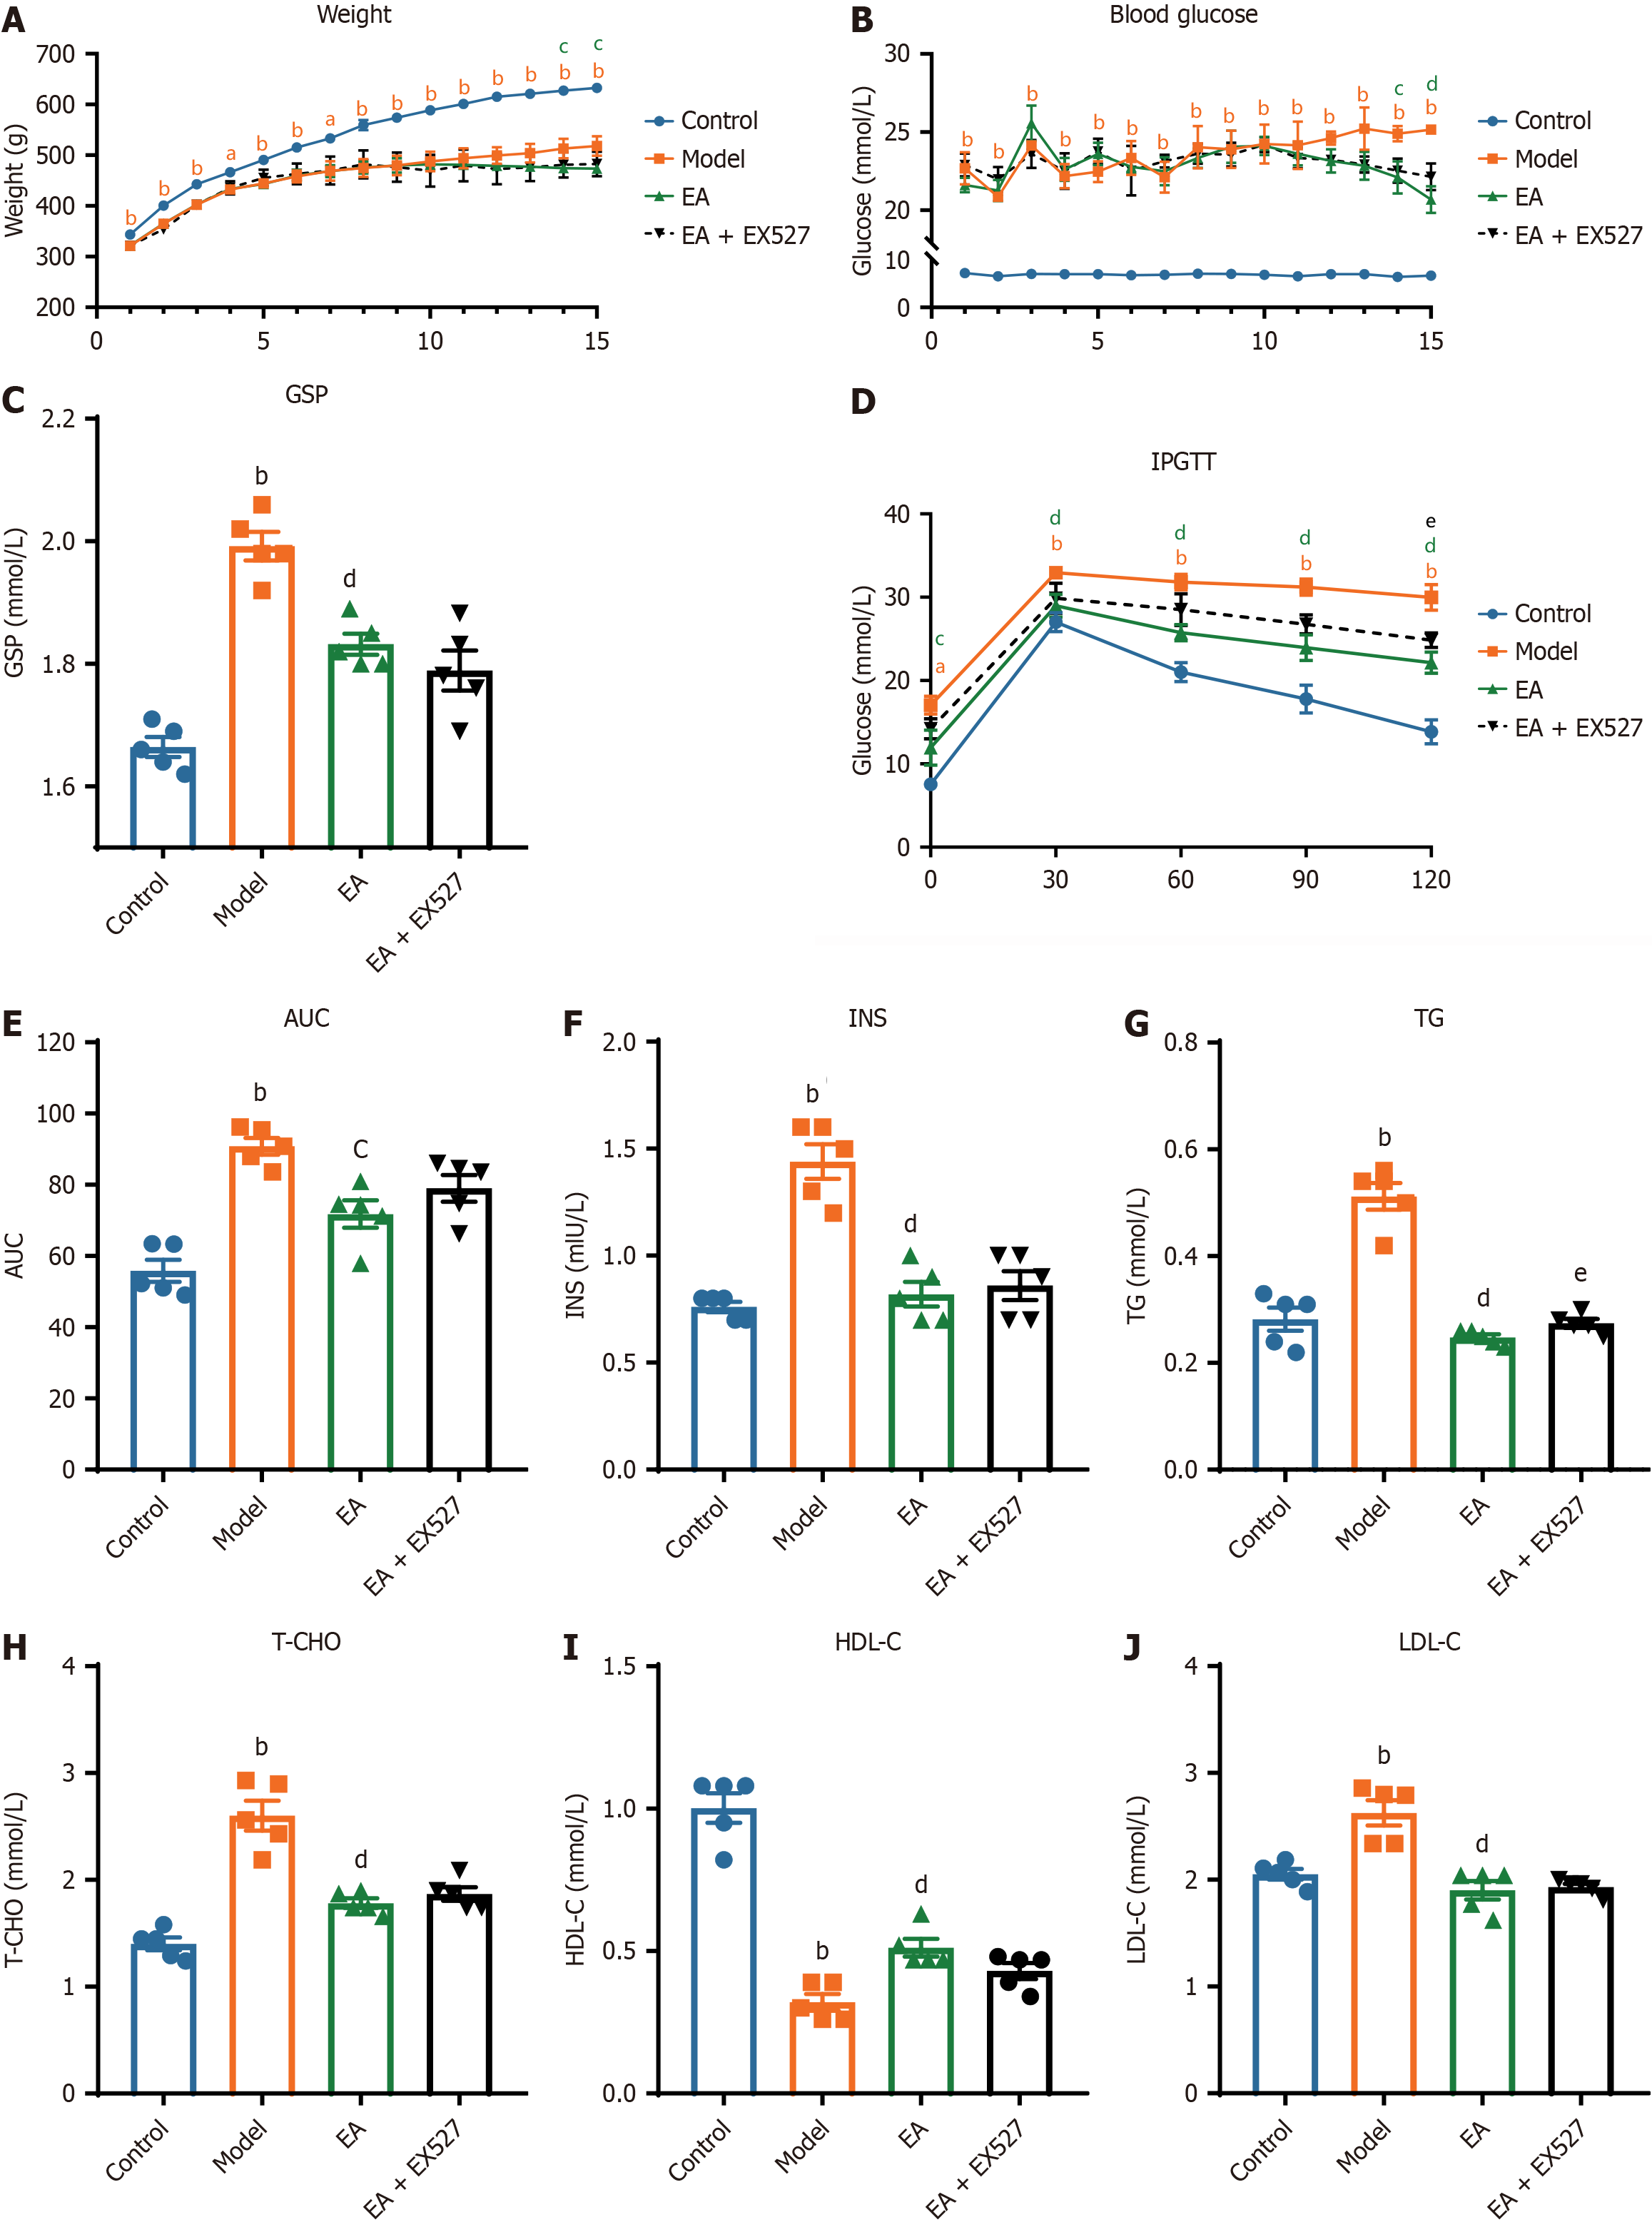
Figure 2 Metabolism index of rats in different groups.
A and B: Weekly changes of random blood glucose (A) and weight (B) in rats after streptozotocin injection; C-J: Evaluations in serum of rats in each group after intervention (n = 5). C: Glycosylated serum protein; D: Intraperitoneal glucose tolerance test (IPGTT); E: Area under the curve (AUC) for the IPGTT test; F: Fasting insulin (INS); G: Triglycerides (TG); H: Total cholesterol (T-CHO); I: High-density lipoprotein level (HDL-C); J: Low-density lipoprotein (LDL-C). aP < 0.05, bP < 0.01 model group vs control group; cP < 0.05, dP < 0.01 electroacupuncture (EA) group vs model group; eP < 0.05 EA + EX527 group vs EA group. GSP: Glycated serum protein.
Figure 3 Relevant indexes of peripheral nerve function of rats in different groups.
A and B: Weekly changes of withdrawal threshold (A) and latency (B); C and D: Changes before and after intervention of withdrawal threshold (C) and latency (D); E and F: Representative immunofluorescence images of nerve fiber in hind paw skin of rats and (E) measurement of intraepidermal nerve fiber density (IENFD) (F); G-I: The dotted line indicates the dermal-epidermal junction, and the arrow refers to the nerve fiber endings passing through the dermal-epidermal junction, which is used for nerve fiber counting. Levels of motor nerve conduction velocity (MNCV) (G), lower limb skin blood flow (H), and sciatic nerve blood flow (I) of rats in each group after intervention (n = 3-5). aP < 0.05, bP < 0.01 model group vs control group; cP < 0.05, dP < 0.01 electroacupuncture (EA) group vs model group; eP < 0.05, fP < 0.01 EA + EX527 group vs EA group; gP < 0.05, hP < 0.01 post-intervention vs pre-intervention.
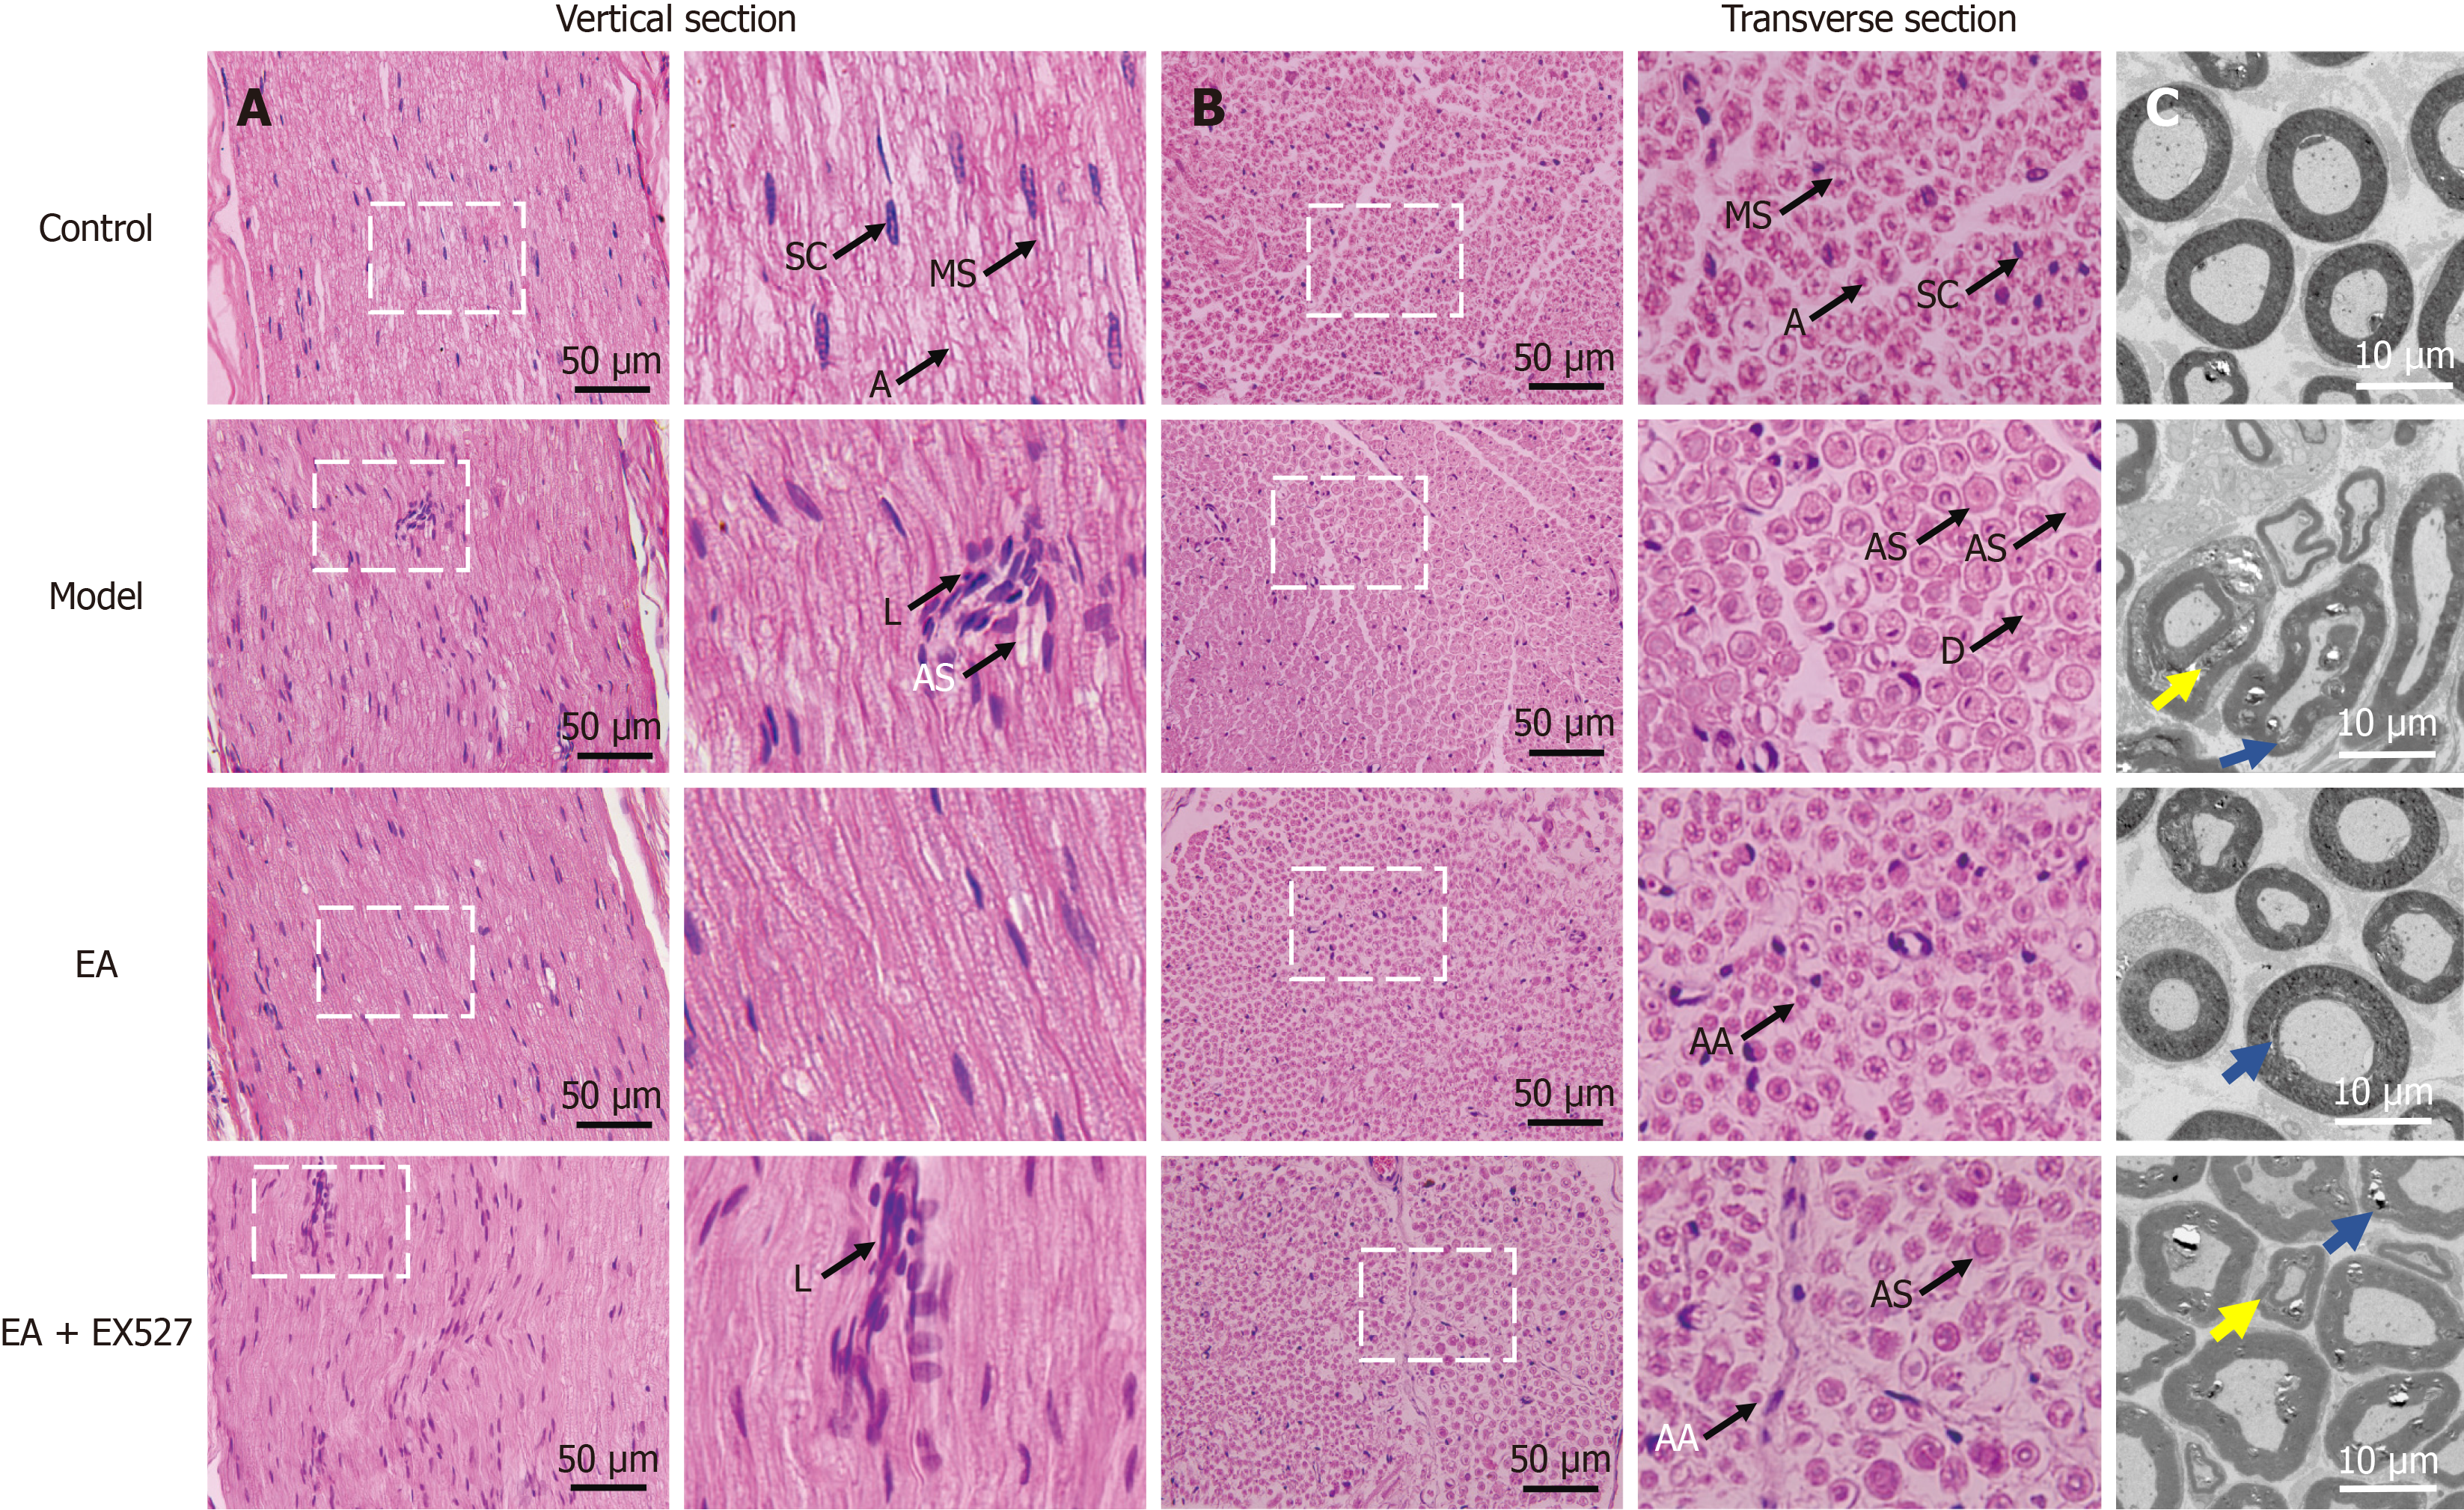
Figure 4 Representative images of hematoxylin and eosin staining and transmission electron microscopy.
A and B: Representative images of hematoxylin and eosin staining. Left, low magnification (× 400). Right, high magnification of the boxed regions on the left; C: Eosin staining and transmission electron microscopy. Blue arrows show duplication of myelin. Yellow arrows show separation of the lamellae. A: Axis cylinder; AA: Axonal atrophy; AS: Axon swelling; D: Demyelination; EA: Electroacupuncture; MS: Medullary sheath; L: Lymphocytic infiltration; SC: Schwann cell.
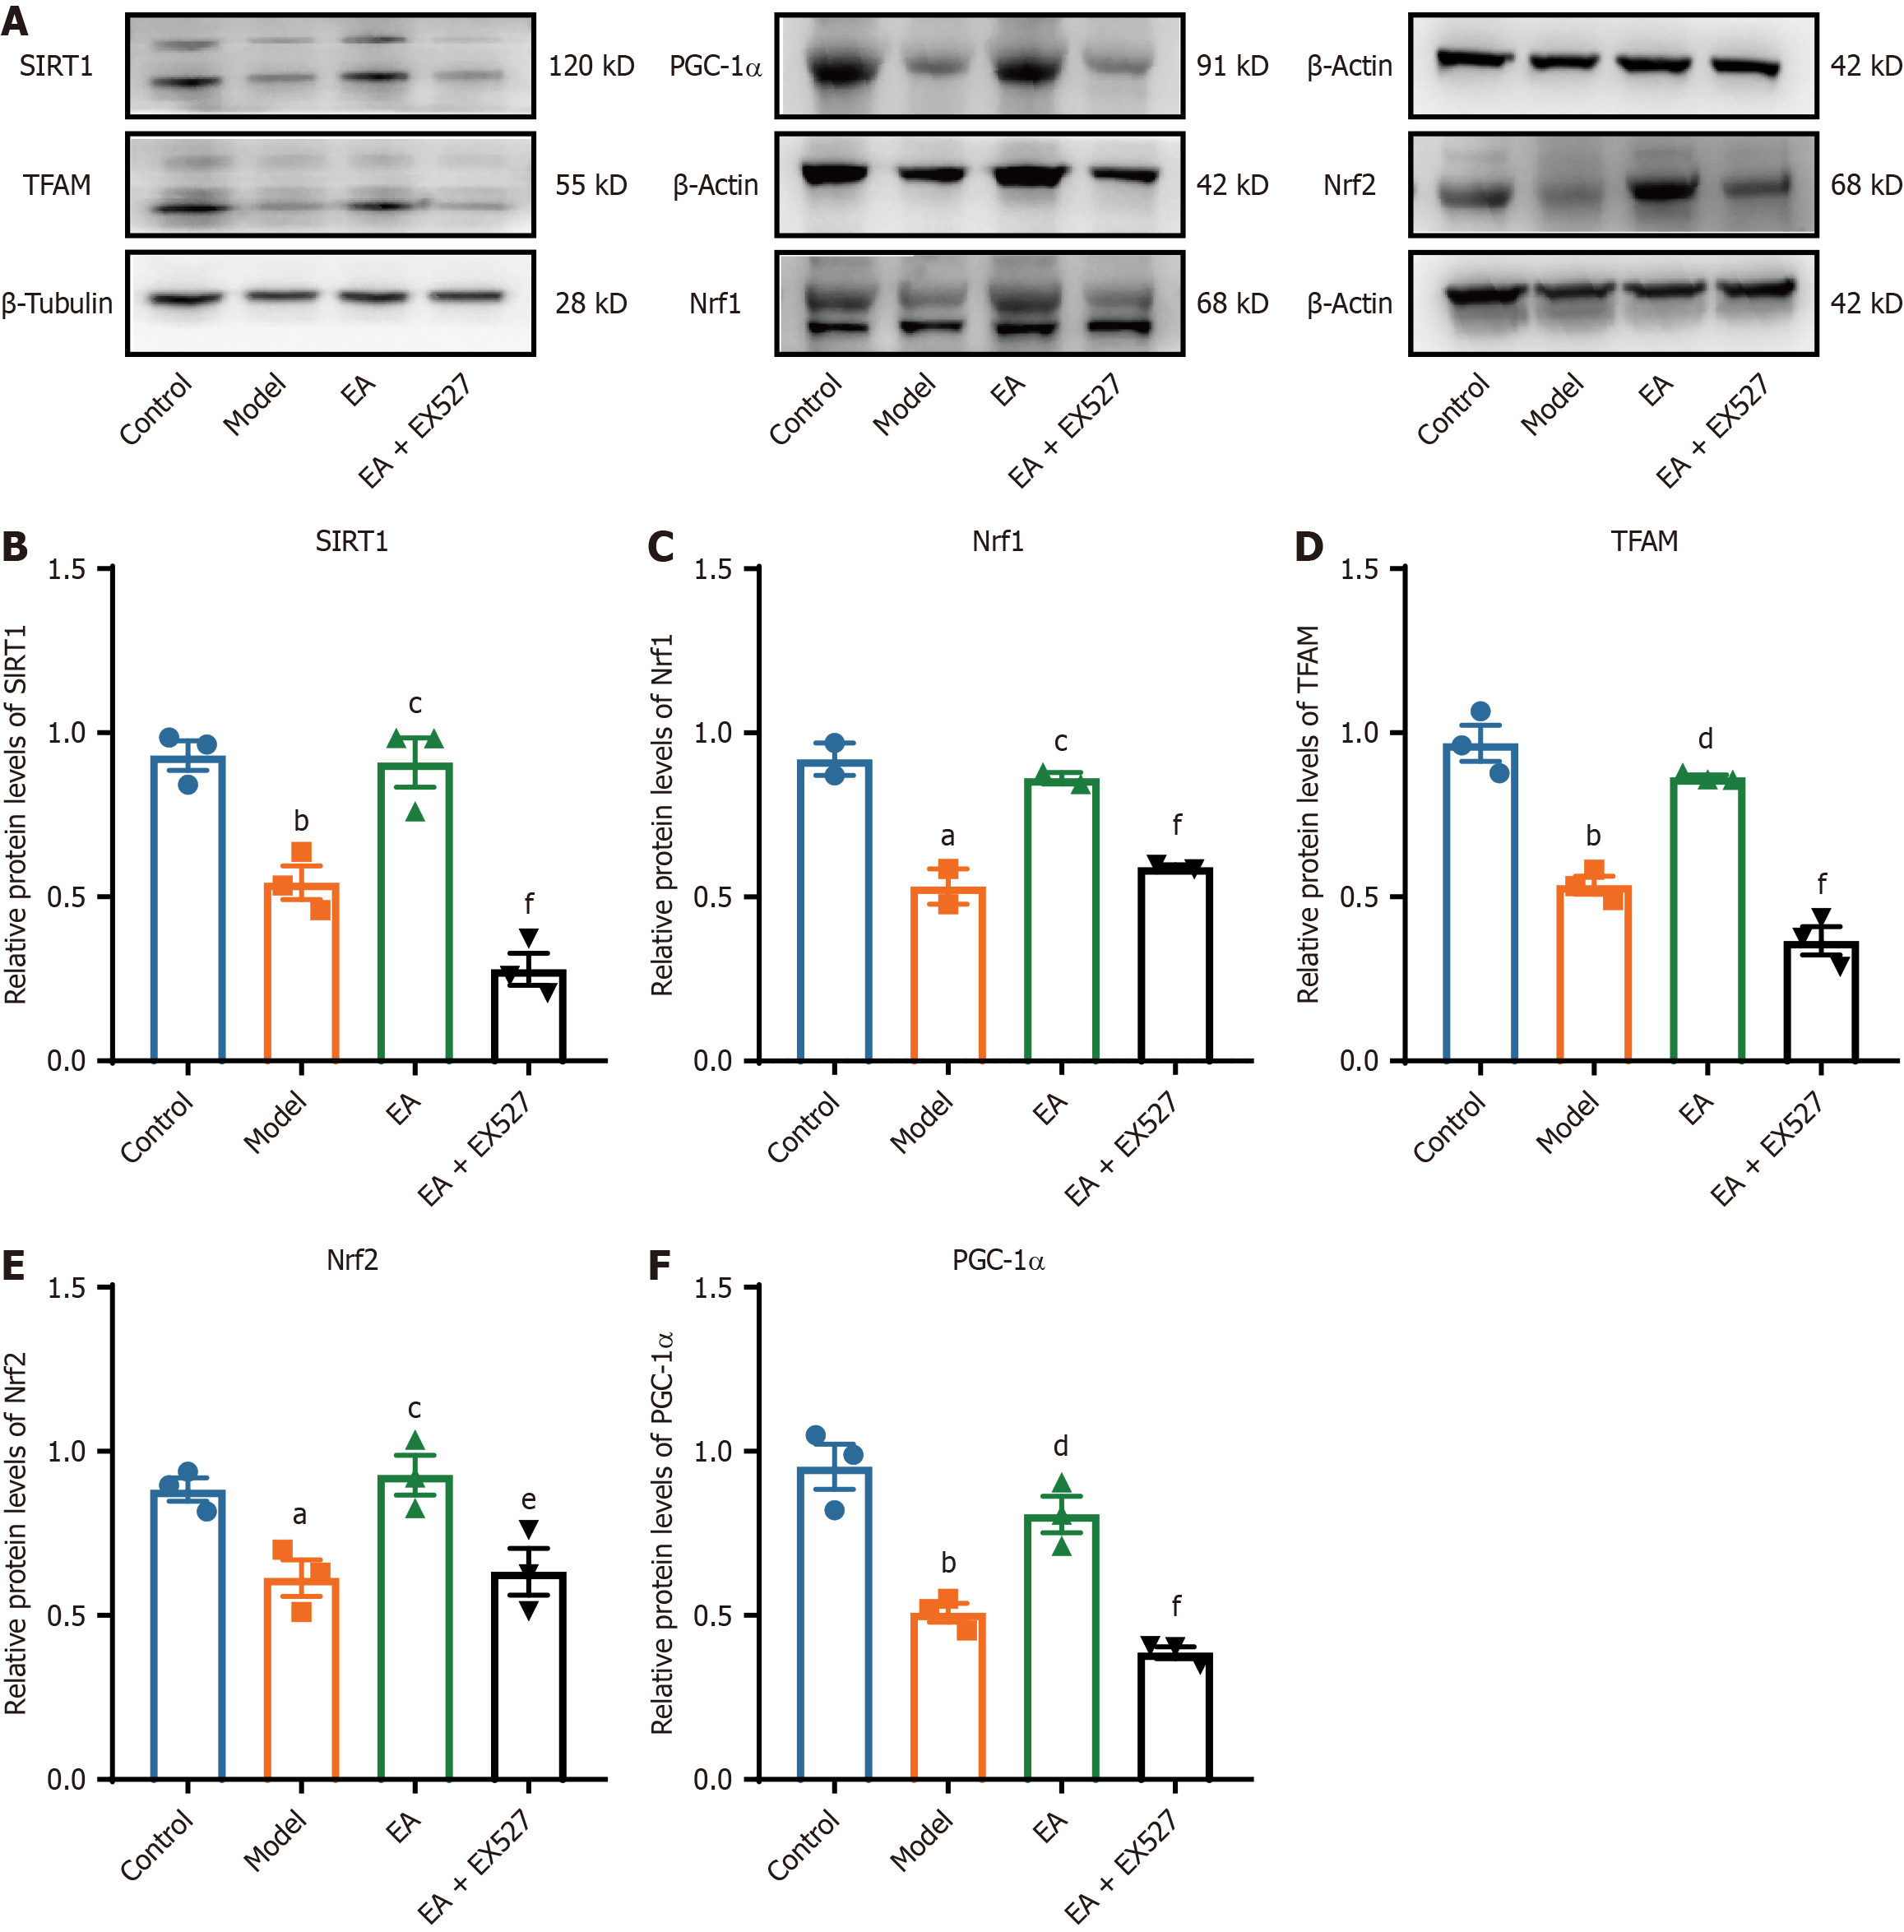
Figure 5 Effect of electroacupuncture on the expression of silent information regulator type 2 homolog-1/peroxisome proliferator-activated receptor-gamma coactivator-1α in sciatic nerve.
A: Protein bands of silent information regulator type 2 homolog-1 (SIRT1), mitochondrial transcription factor A (TFAM), peroxisome proliferator-activated receptor-gamma coactivator-1α (PGC-1α), nuclear respiratory factor 1 (Nrf1), and nuclear factor erythroid 2-related factor 2 (Nrf2); B-F: Relative expression of SIRT1 (B), PGC-1α(C), TFAM (D), Nrf1 (E) and Nrf2 (F). β-tubulin was used as a loading control of SIRT1 and TFAM. β-actin was used as a loading control for PGC-1α, Nrf1, and Nrf2. (n = 3). aP < 0.05, bP < 0.01 vs control group; cP < 0.05, dP < 0.01 vs model group; eP < 0.05, fP < 0.01 vs electroacupuncture (EA) group.
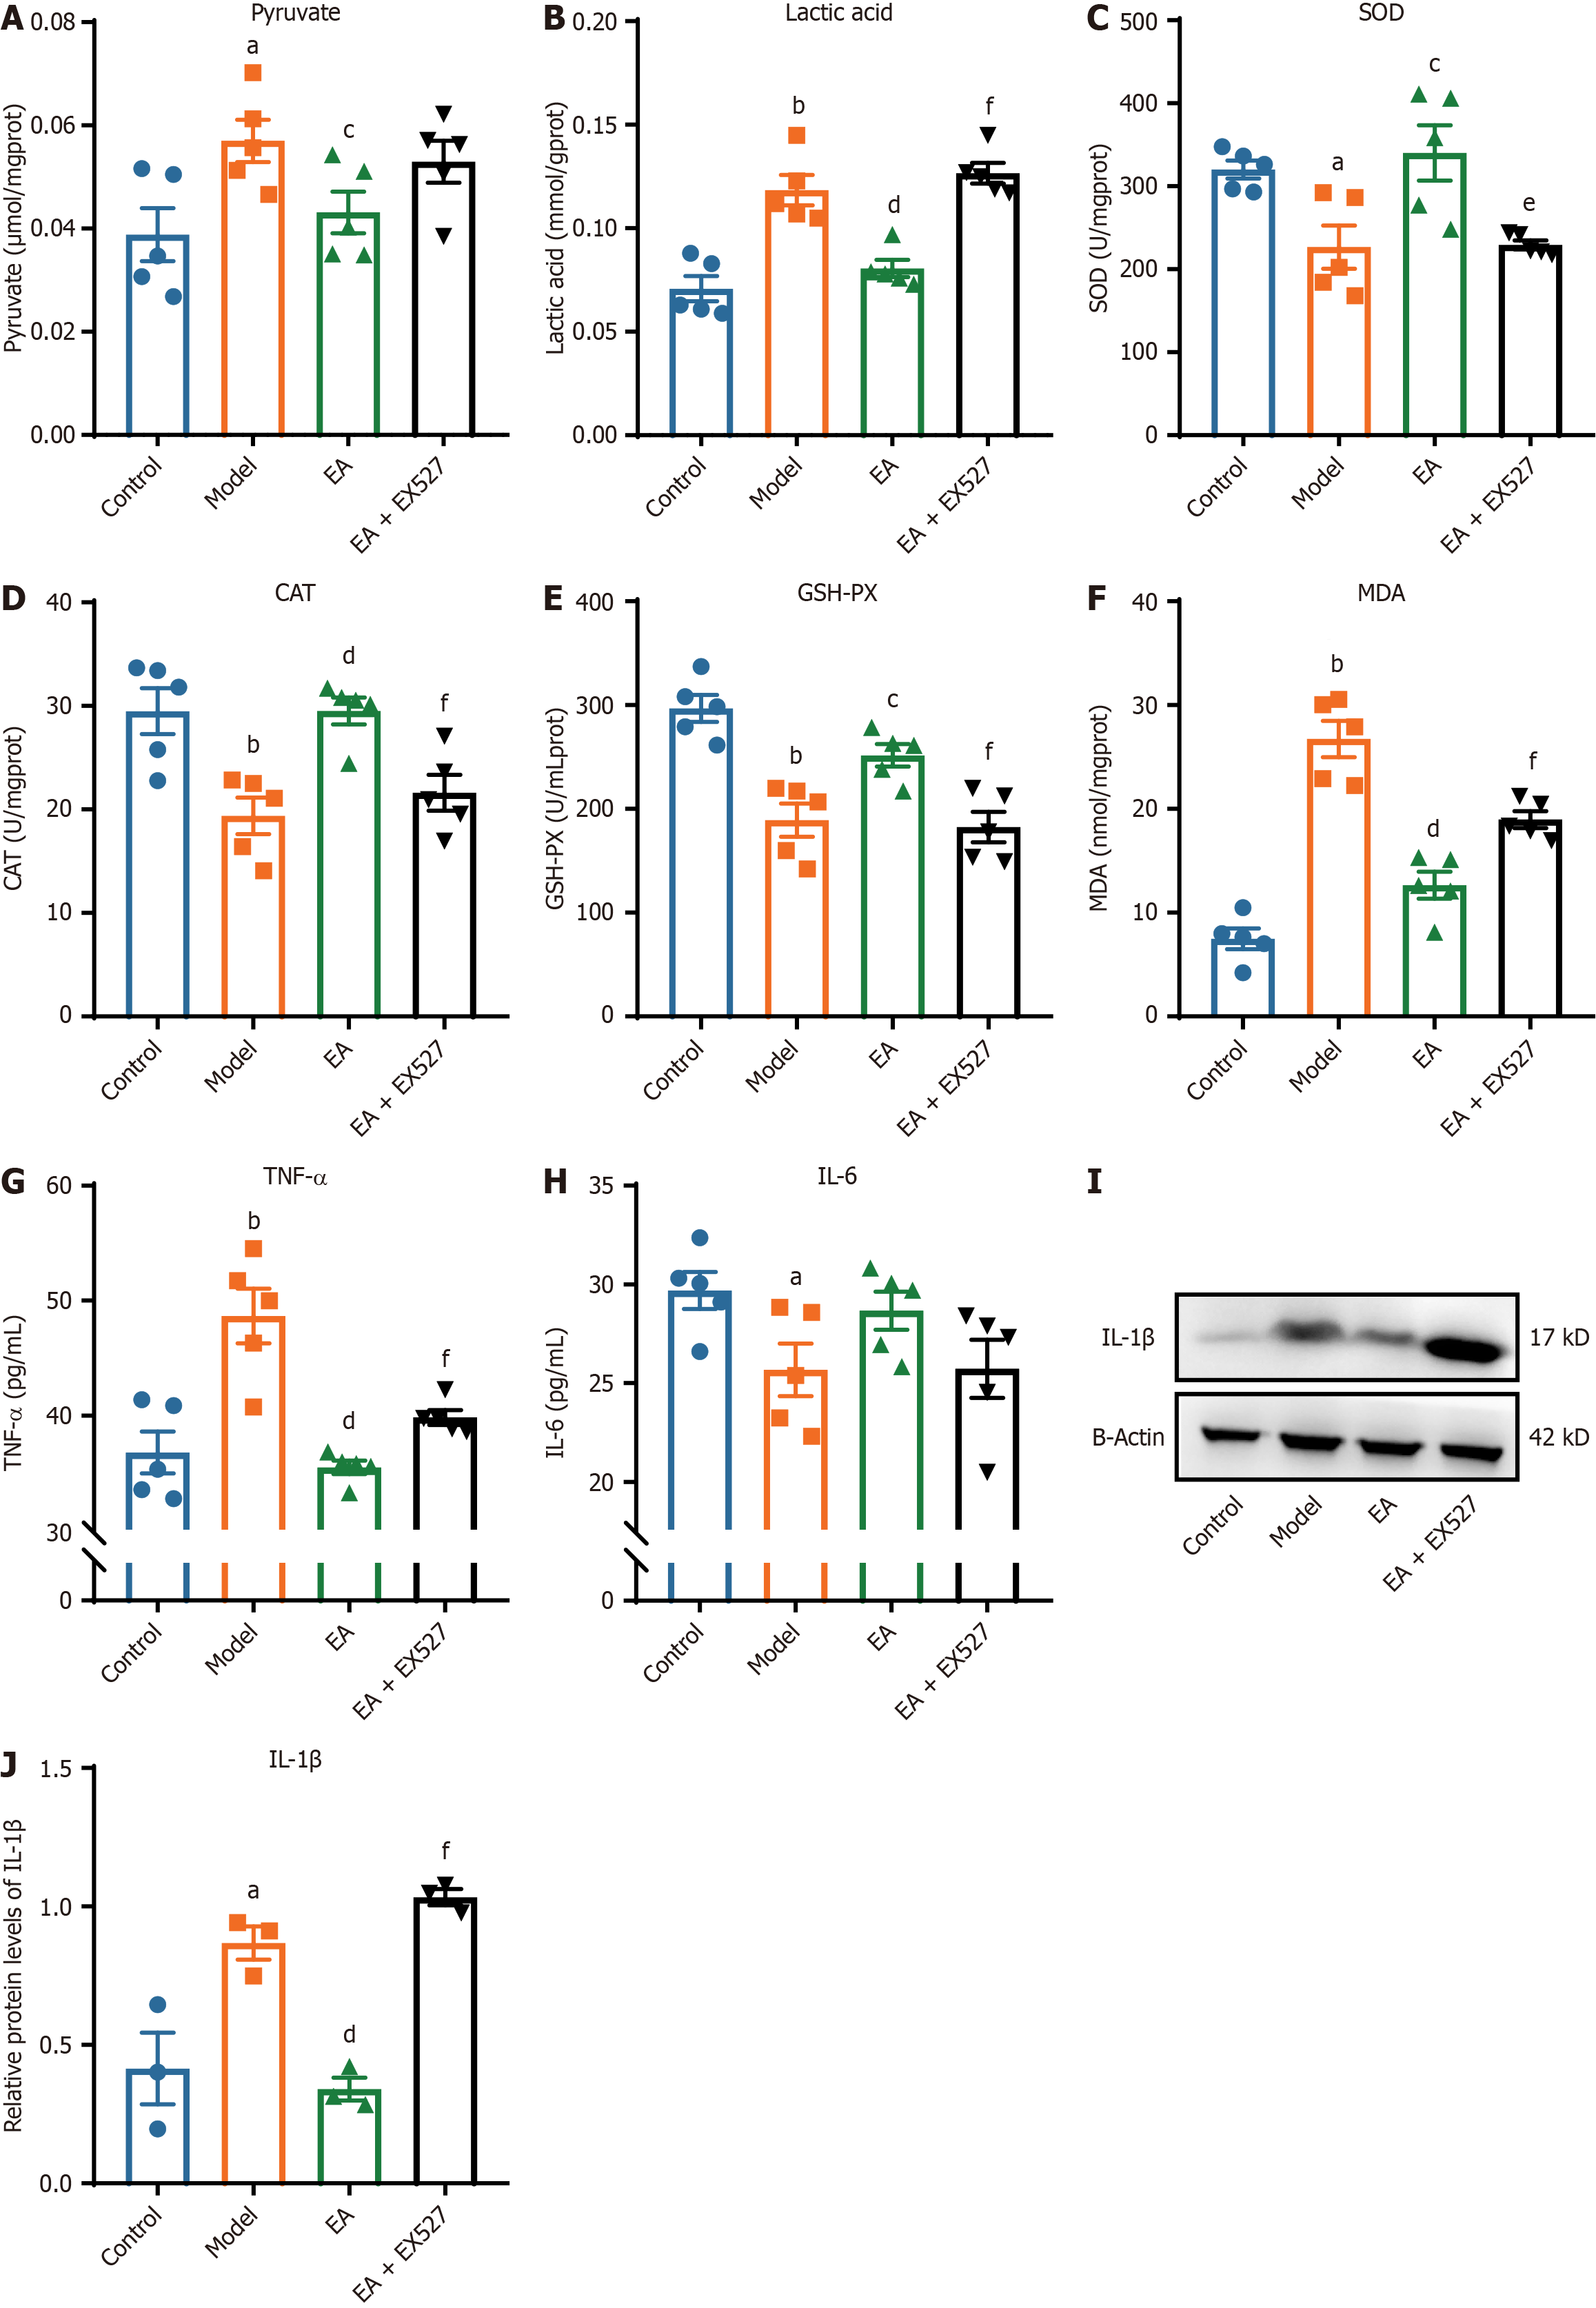
Figure 6 Comparison of pyruvate, lactic acid, oxidative stress, and inflammatory factor-related indicators in sciatic nerve of rats in each group.
A-G: The sciatic nerve of rats in each group (n = 5); A: Pyruvate; B: Lactic acid; C: Superoxide dismutase (SOD); D: Catalase (CAT); E: Glutathione peroxidase (GSH-PX); F: Malondialdehyde (MDA); G: Tumor necrosis factor-alpha (TNF-α); H and I: Protein band (H) and relative expression of interleukin (IL)-1β (I; n = 3); J: IL-6 in the sciatic nerve of rats in each group (n = 5). aP < 0.05, bP < 0.01 vs control group; cP < 0.05, dP < 0.01 vs model group; eP < 0.05, fP < 0.01 vs electroacupuncture (EA) group.
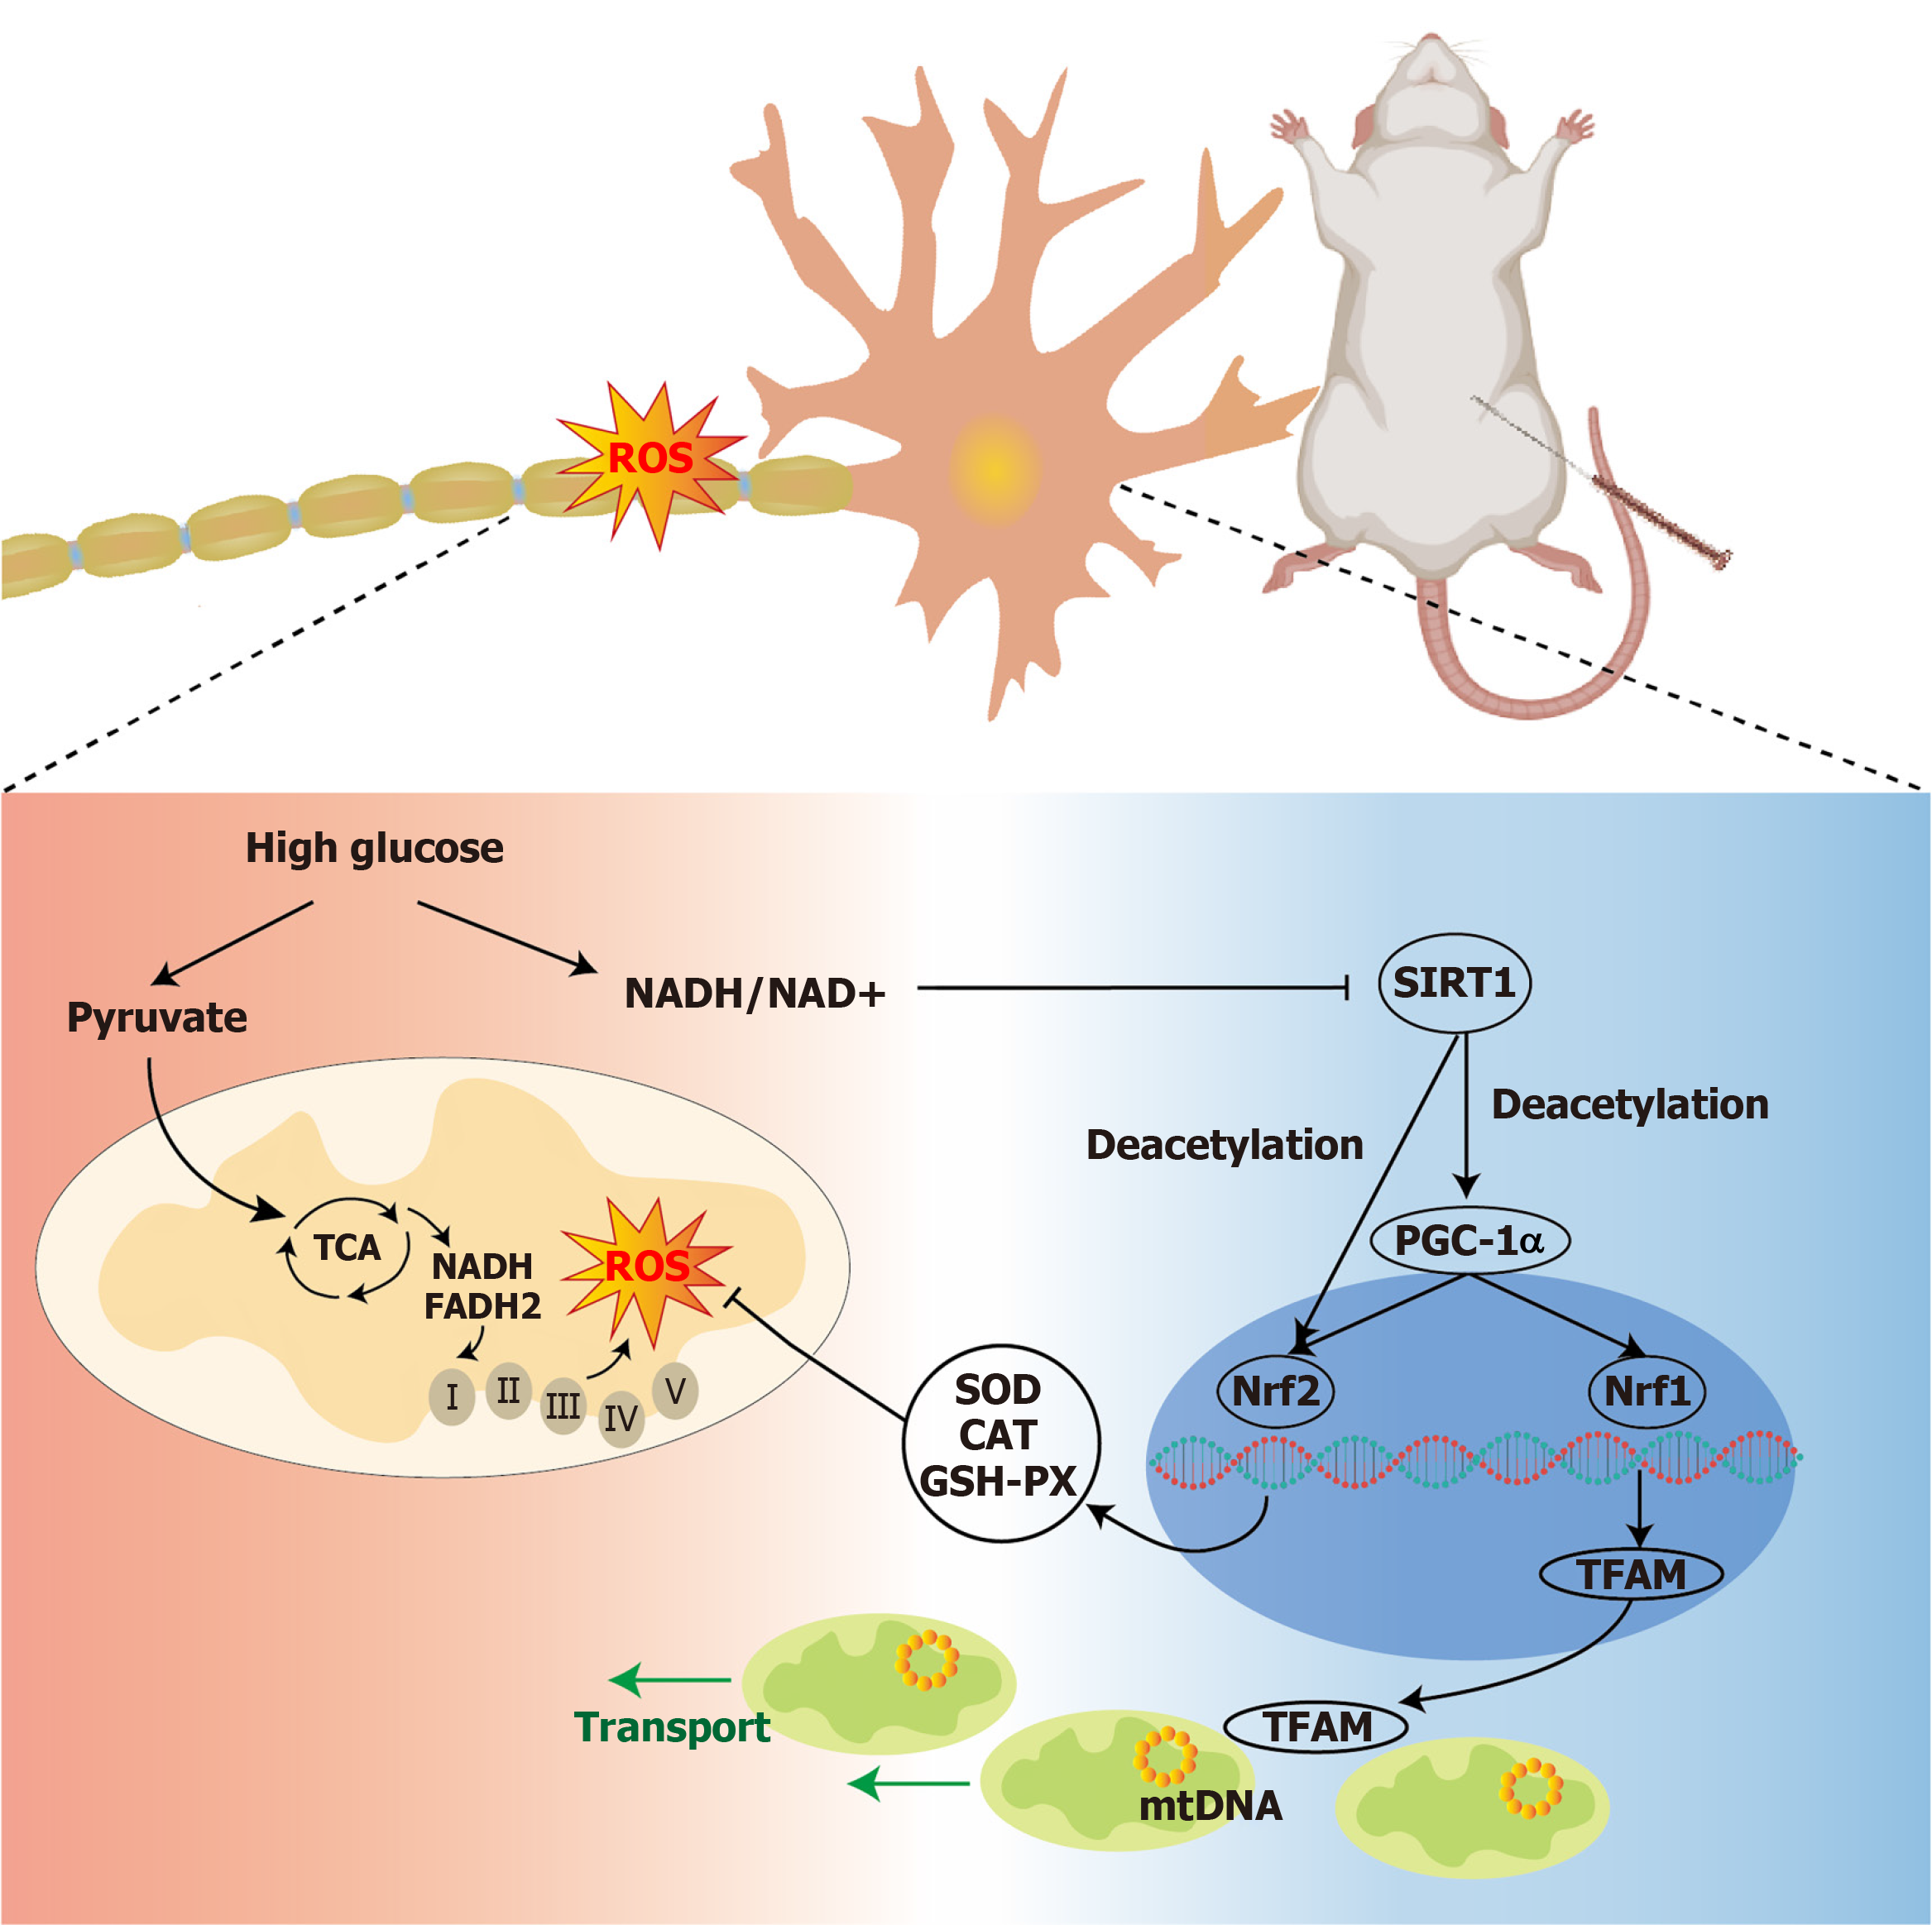
Figure 7 Schematic illustration of the possible mechanisms underlying neuroprotective effects of electroacupuncture in experimental diabetes.
In a metabolically disturbed organism, metabolic flux induces reactive oxygen species (ROS) production and damages mitochondria, eventually leading to an energy homeostasis imbalance in nerve cells. Electroacupuncture may attenuate oxidative stress, break the vicious cycle, and promote mitochondrial biogenesis by activating the silent information regulator type 2 homolog-1/peroxisome proliferator-activated receptor-gamma coactivator-1α axis. CAT: Catalase; GSH-PX: Glutathione peroxidase; Nrf1: Nuclear respiratory factor 1; Nrf2: Nuclear factor erythroid 2-related factor 2; PDC-1α: Peroxisome proliferator-activated receptor-gamma coactivator-1α; SIRT1: Silent information regulator type 2 homolog-1; SOD: Superoxide dismutase; TCA: Electron transport chain; TFAM: Mitochondrial transcription factor A.
- Citation: Yuan CX, Wang X, Liu Y, Xu TC, Yu Z, Xu B. Electroacupuncture alleviates diabetic peripheral neuropathy through modulating mitochondrial biogenesis and suppressing oxidative stress. World J Diabetes 2025; 16(2): 93130
- URL: https://www.wjgnet.com/1948-9358/full/v16/i2/93130.htm
- DOI: https://dx.doi.org/10.4239/wjd.v16.i2.93130


