Copyright
©The Author(s) 2025.
World J Diabetes. Feb 15, 2025; 16(2): 101282
Published online Feb 15, 2025. doi: 10.4239/wjd.v16.i2.101282
Published online Feb 15, 2025. doi: 10.4239/wjd.v16.i2.101282
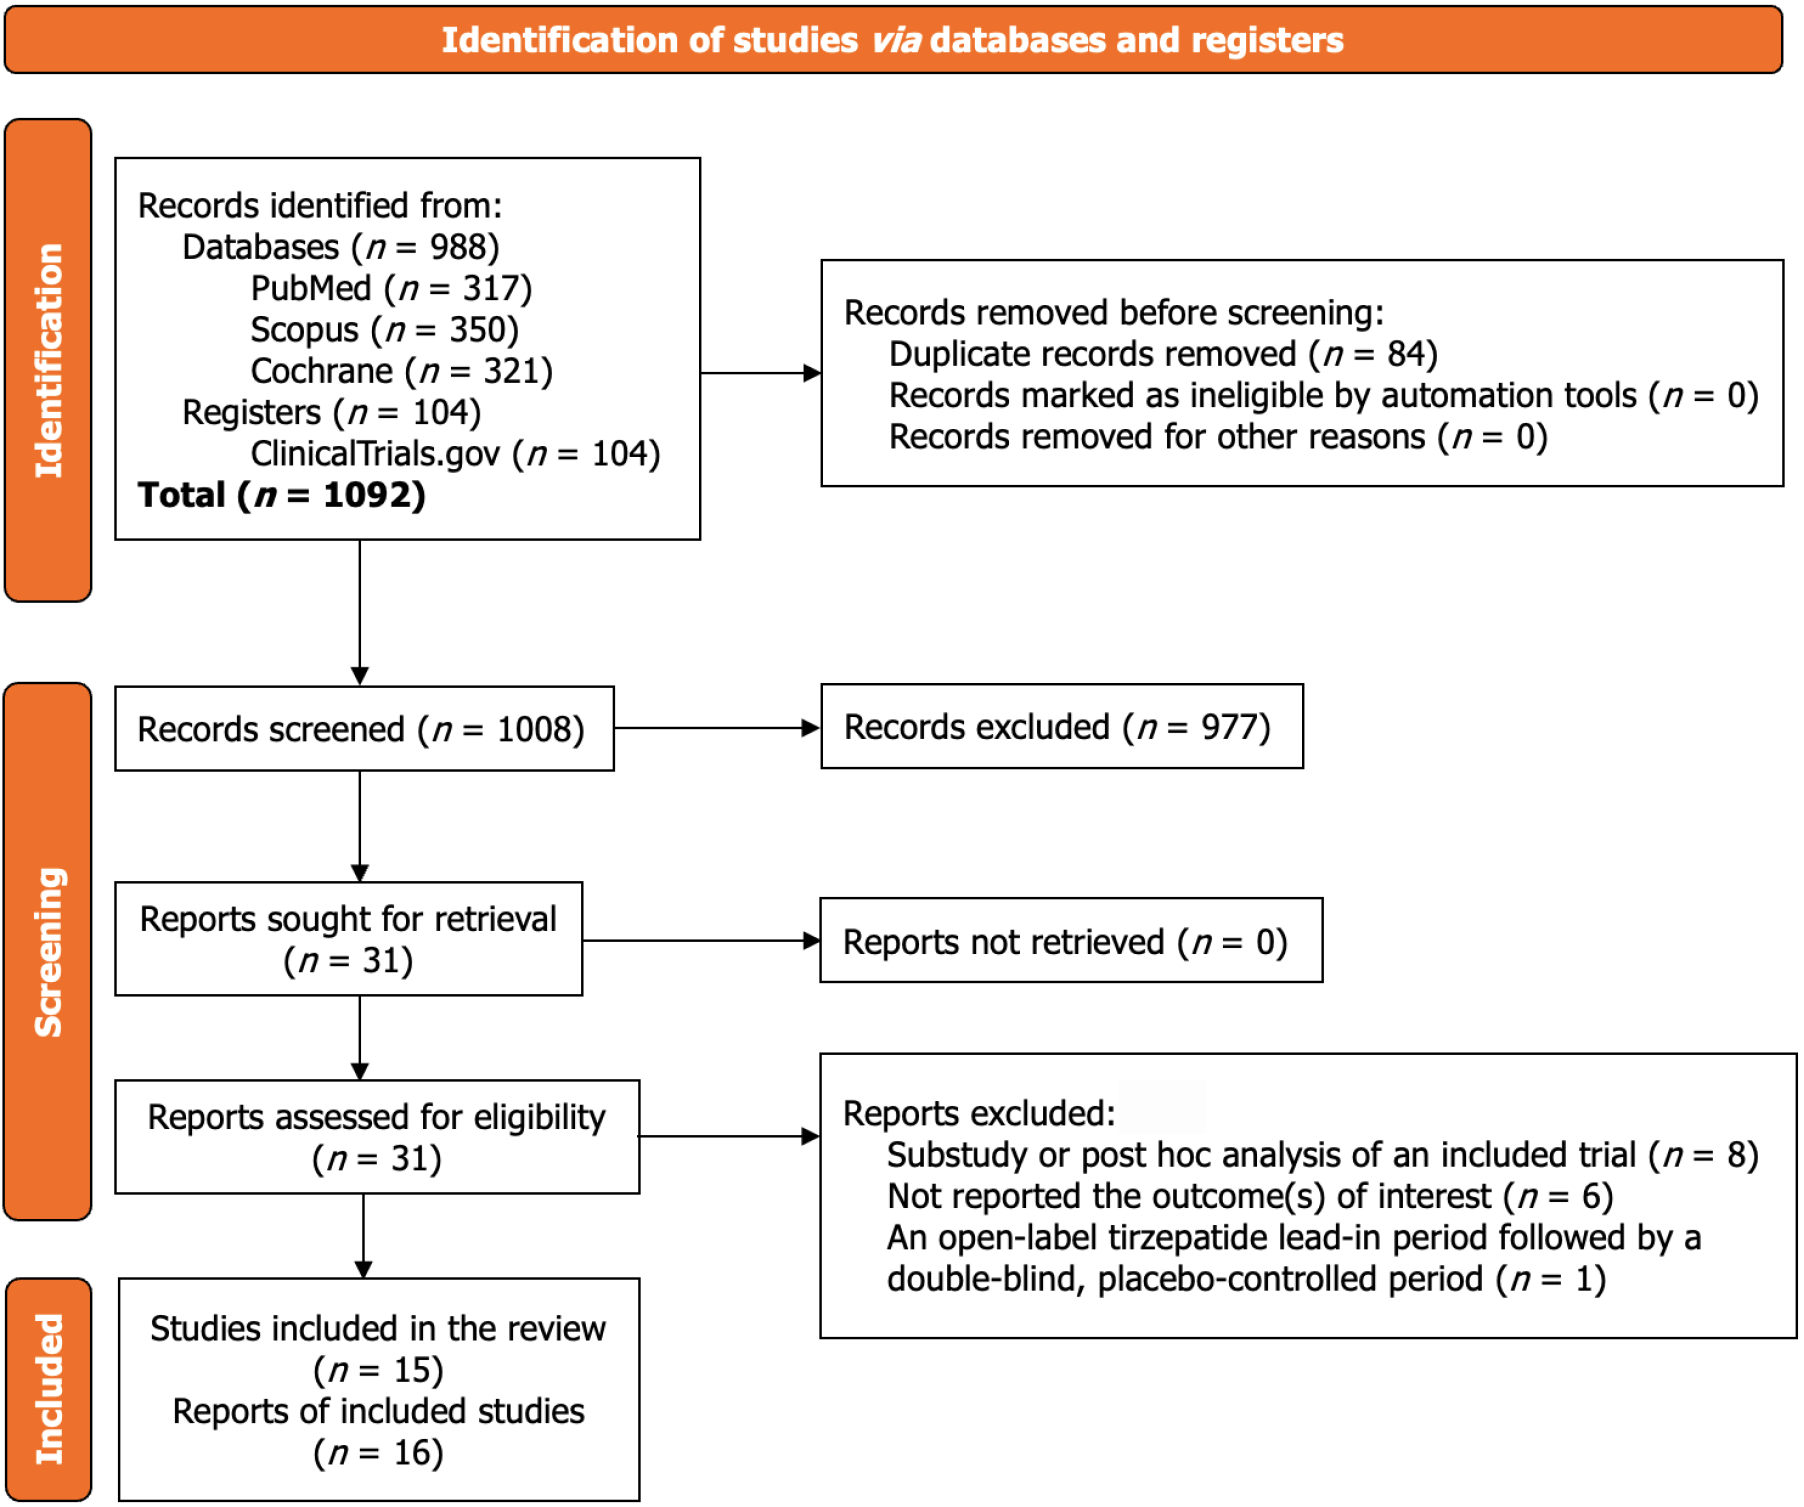
Figure 1 Flowchart on study retrieval and inclusion in the meta-analysis.
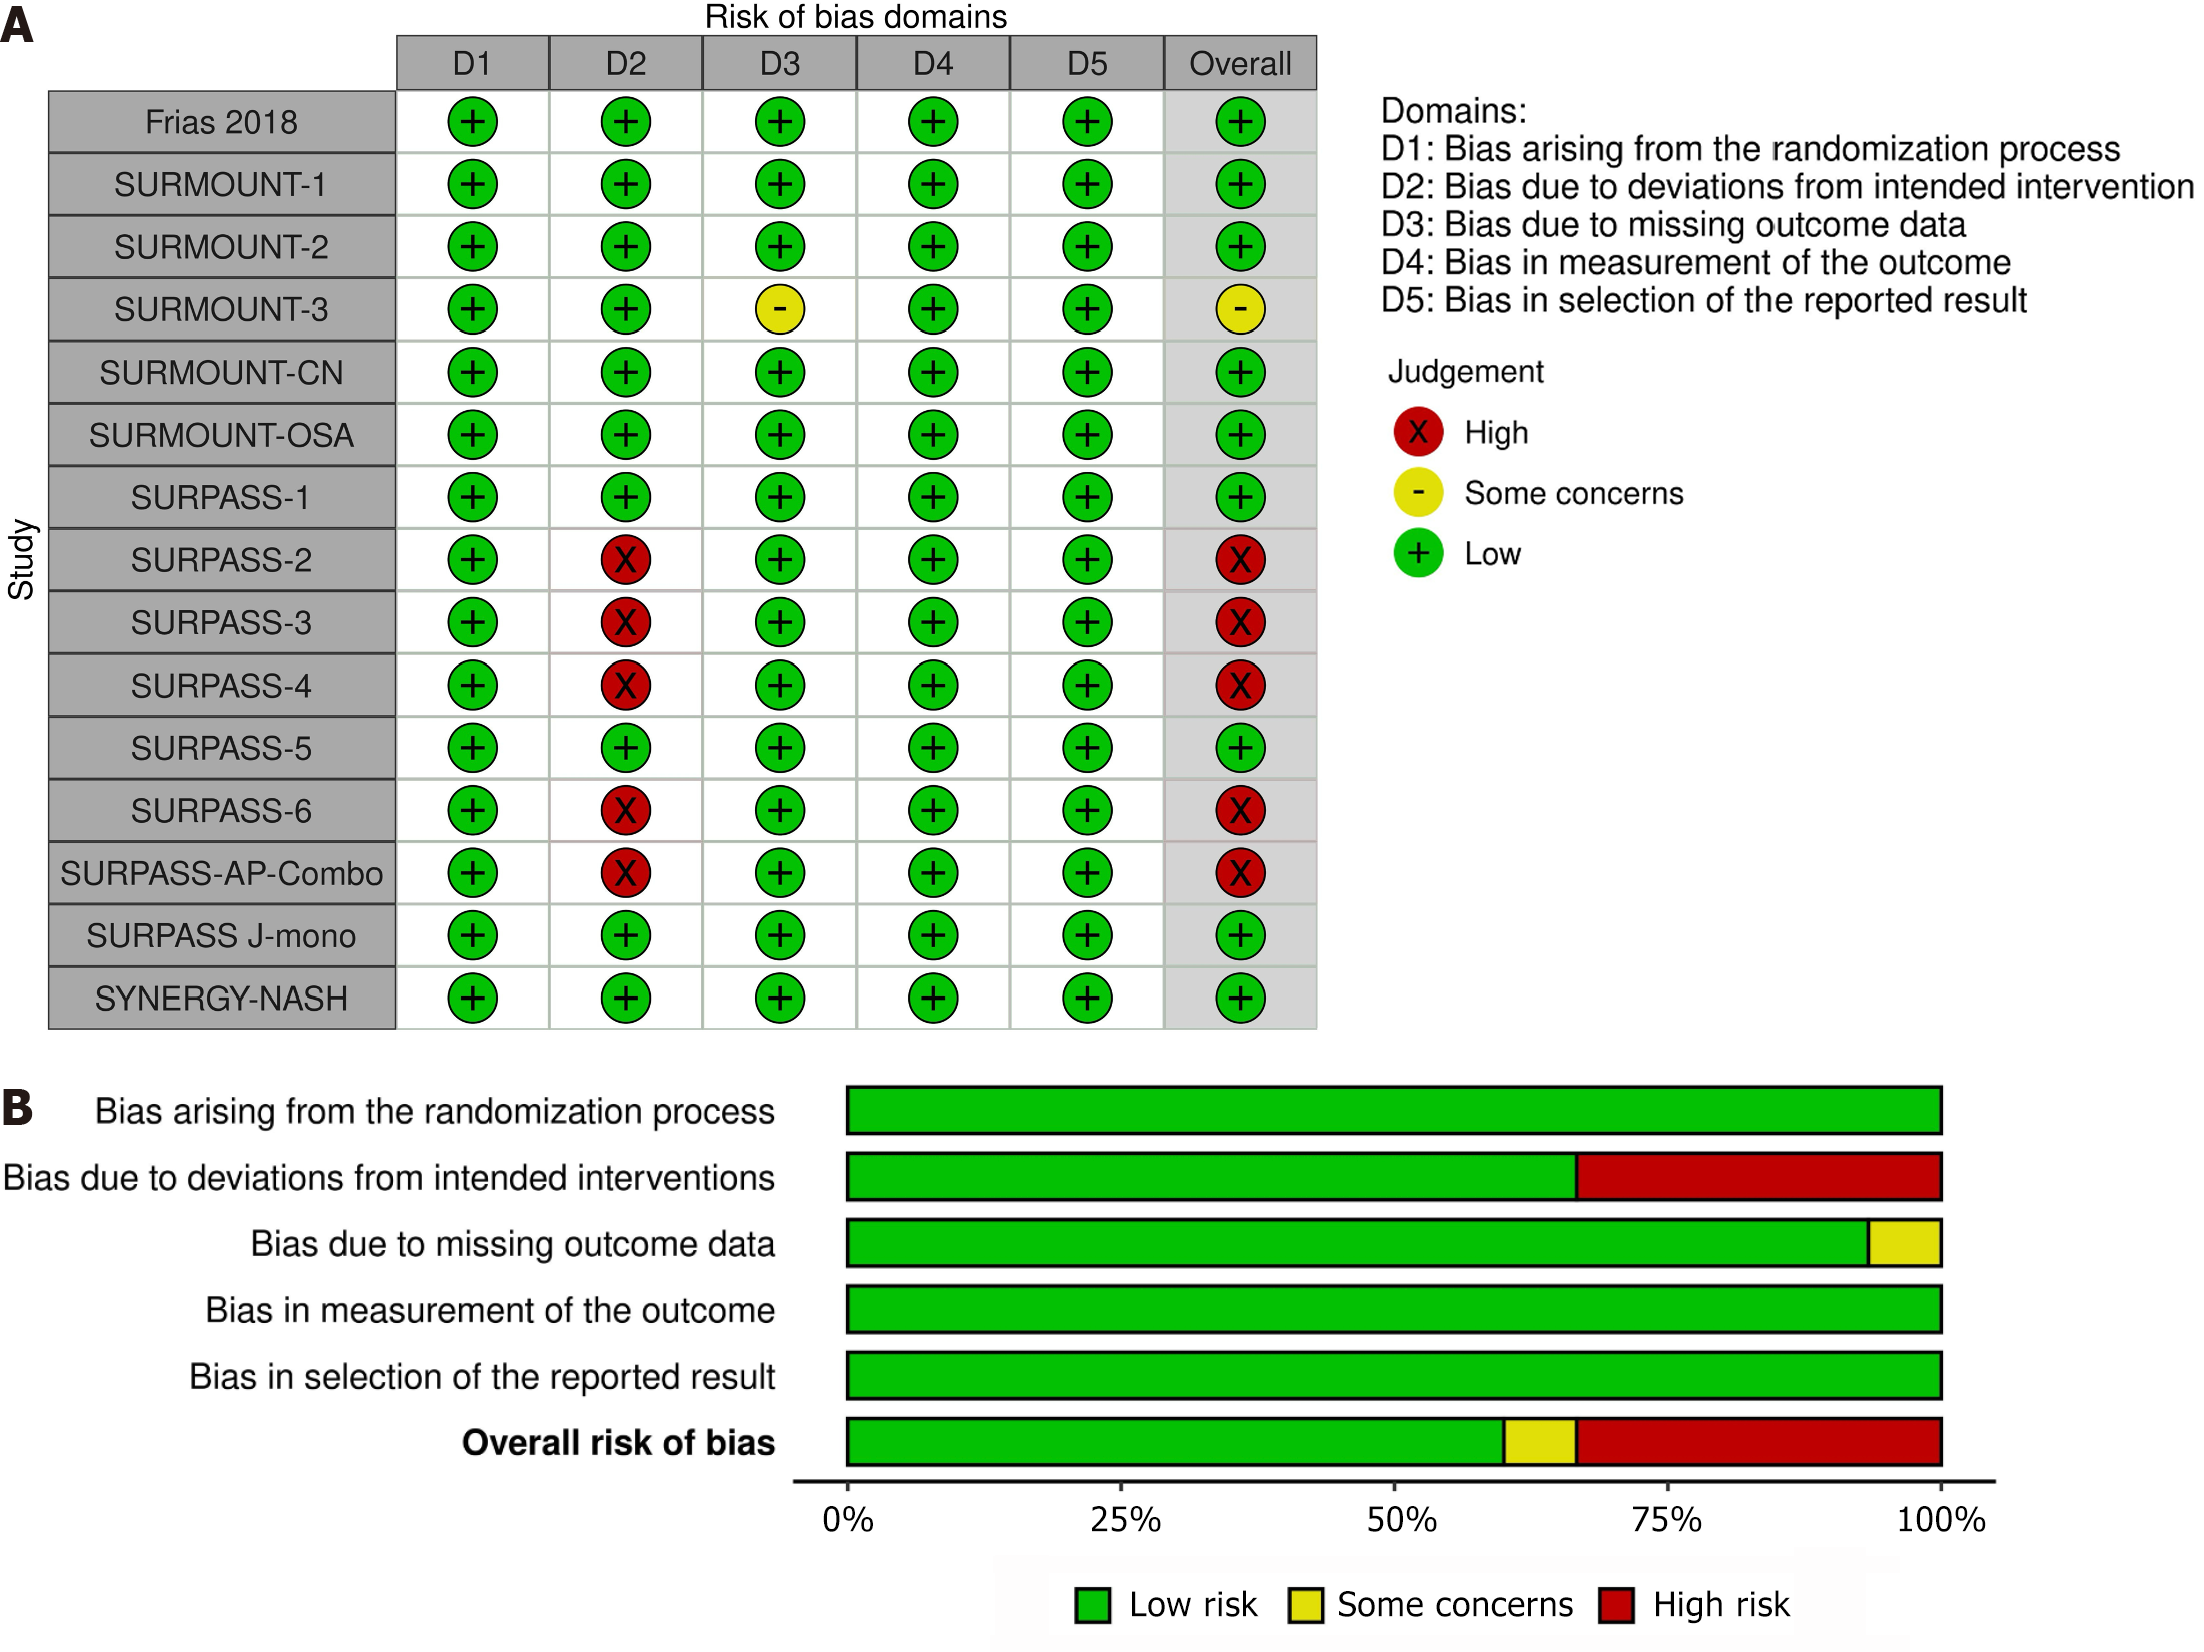
Figure 2 The risk of bias.
A: Risk of bias summary: Review authors’ judgments about each risk of bias item for each included study; B: Risk of bias graph: Review authors’ judgments about each risk of bias item presented as percentages across all included studies.
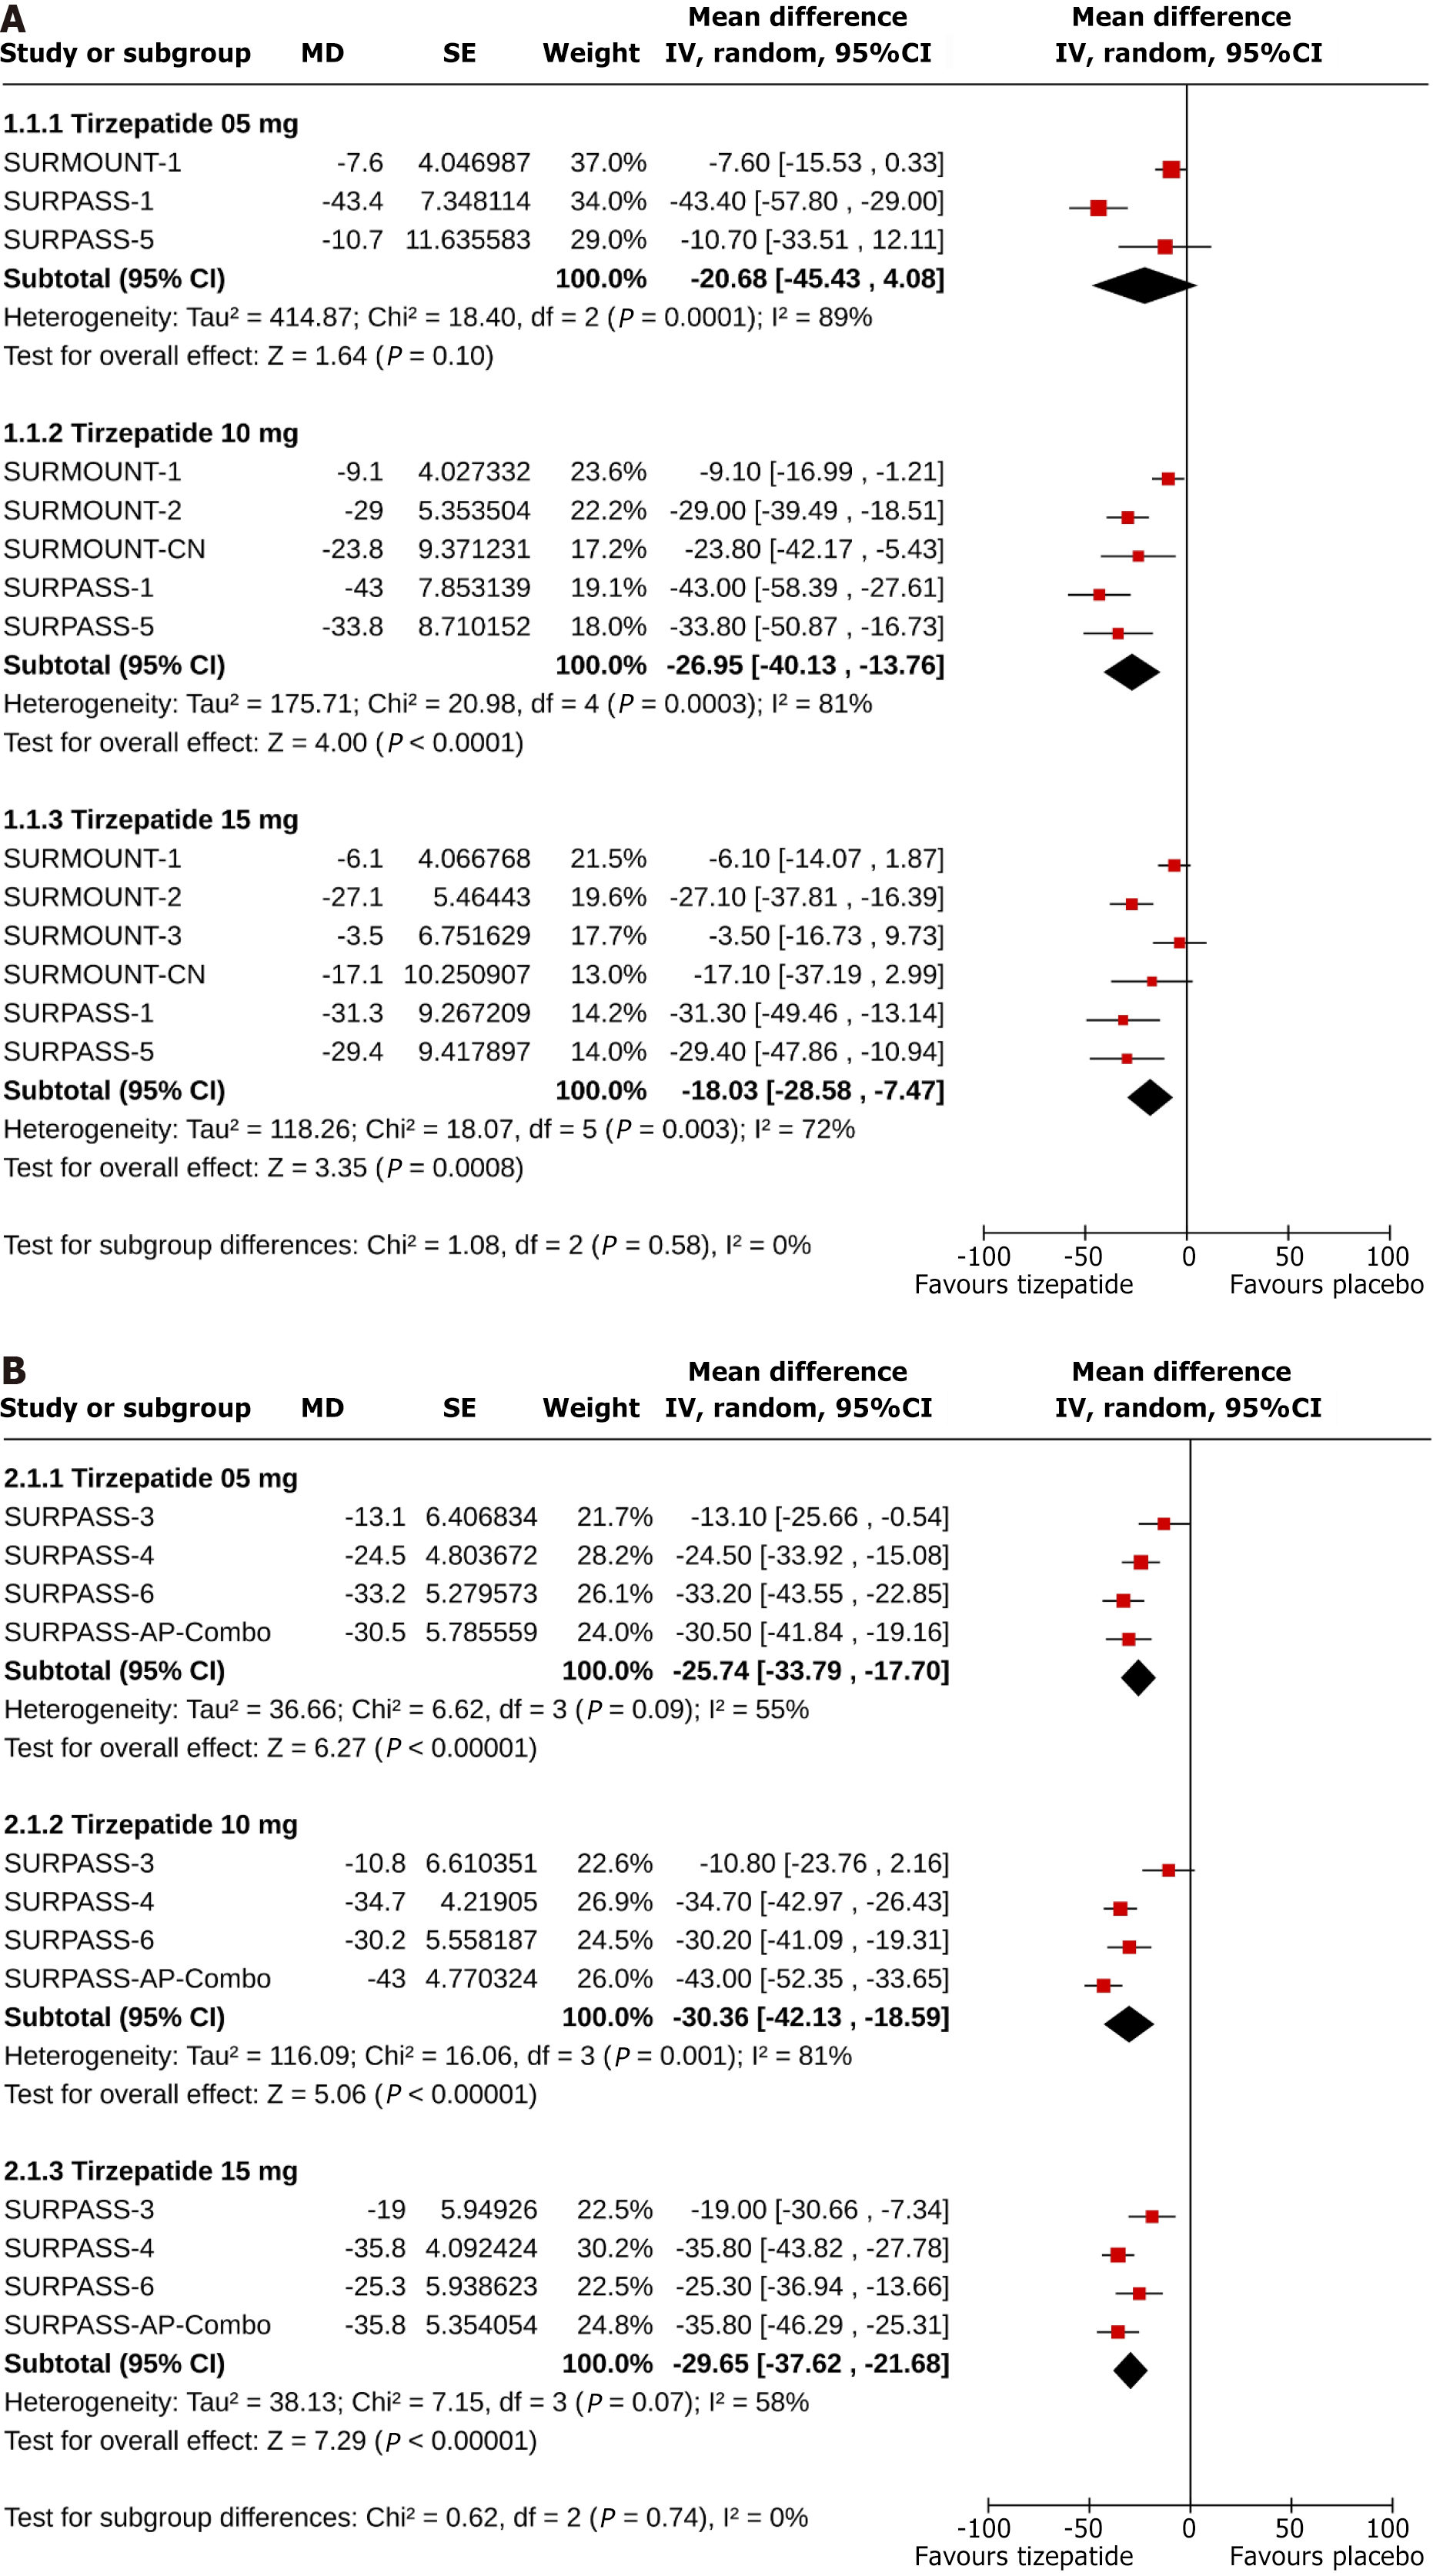
Figure 3 Forest plot highlighting the percent change from baseline in urine albumin-to-creatinine ratio.
A: Tirzepatide vs Placebo groups; B: Tirzepatide vs Insulin groups.
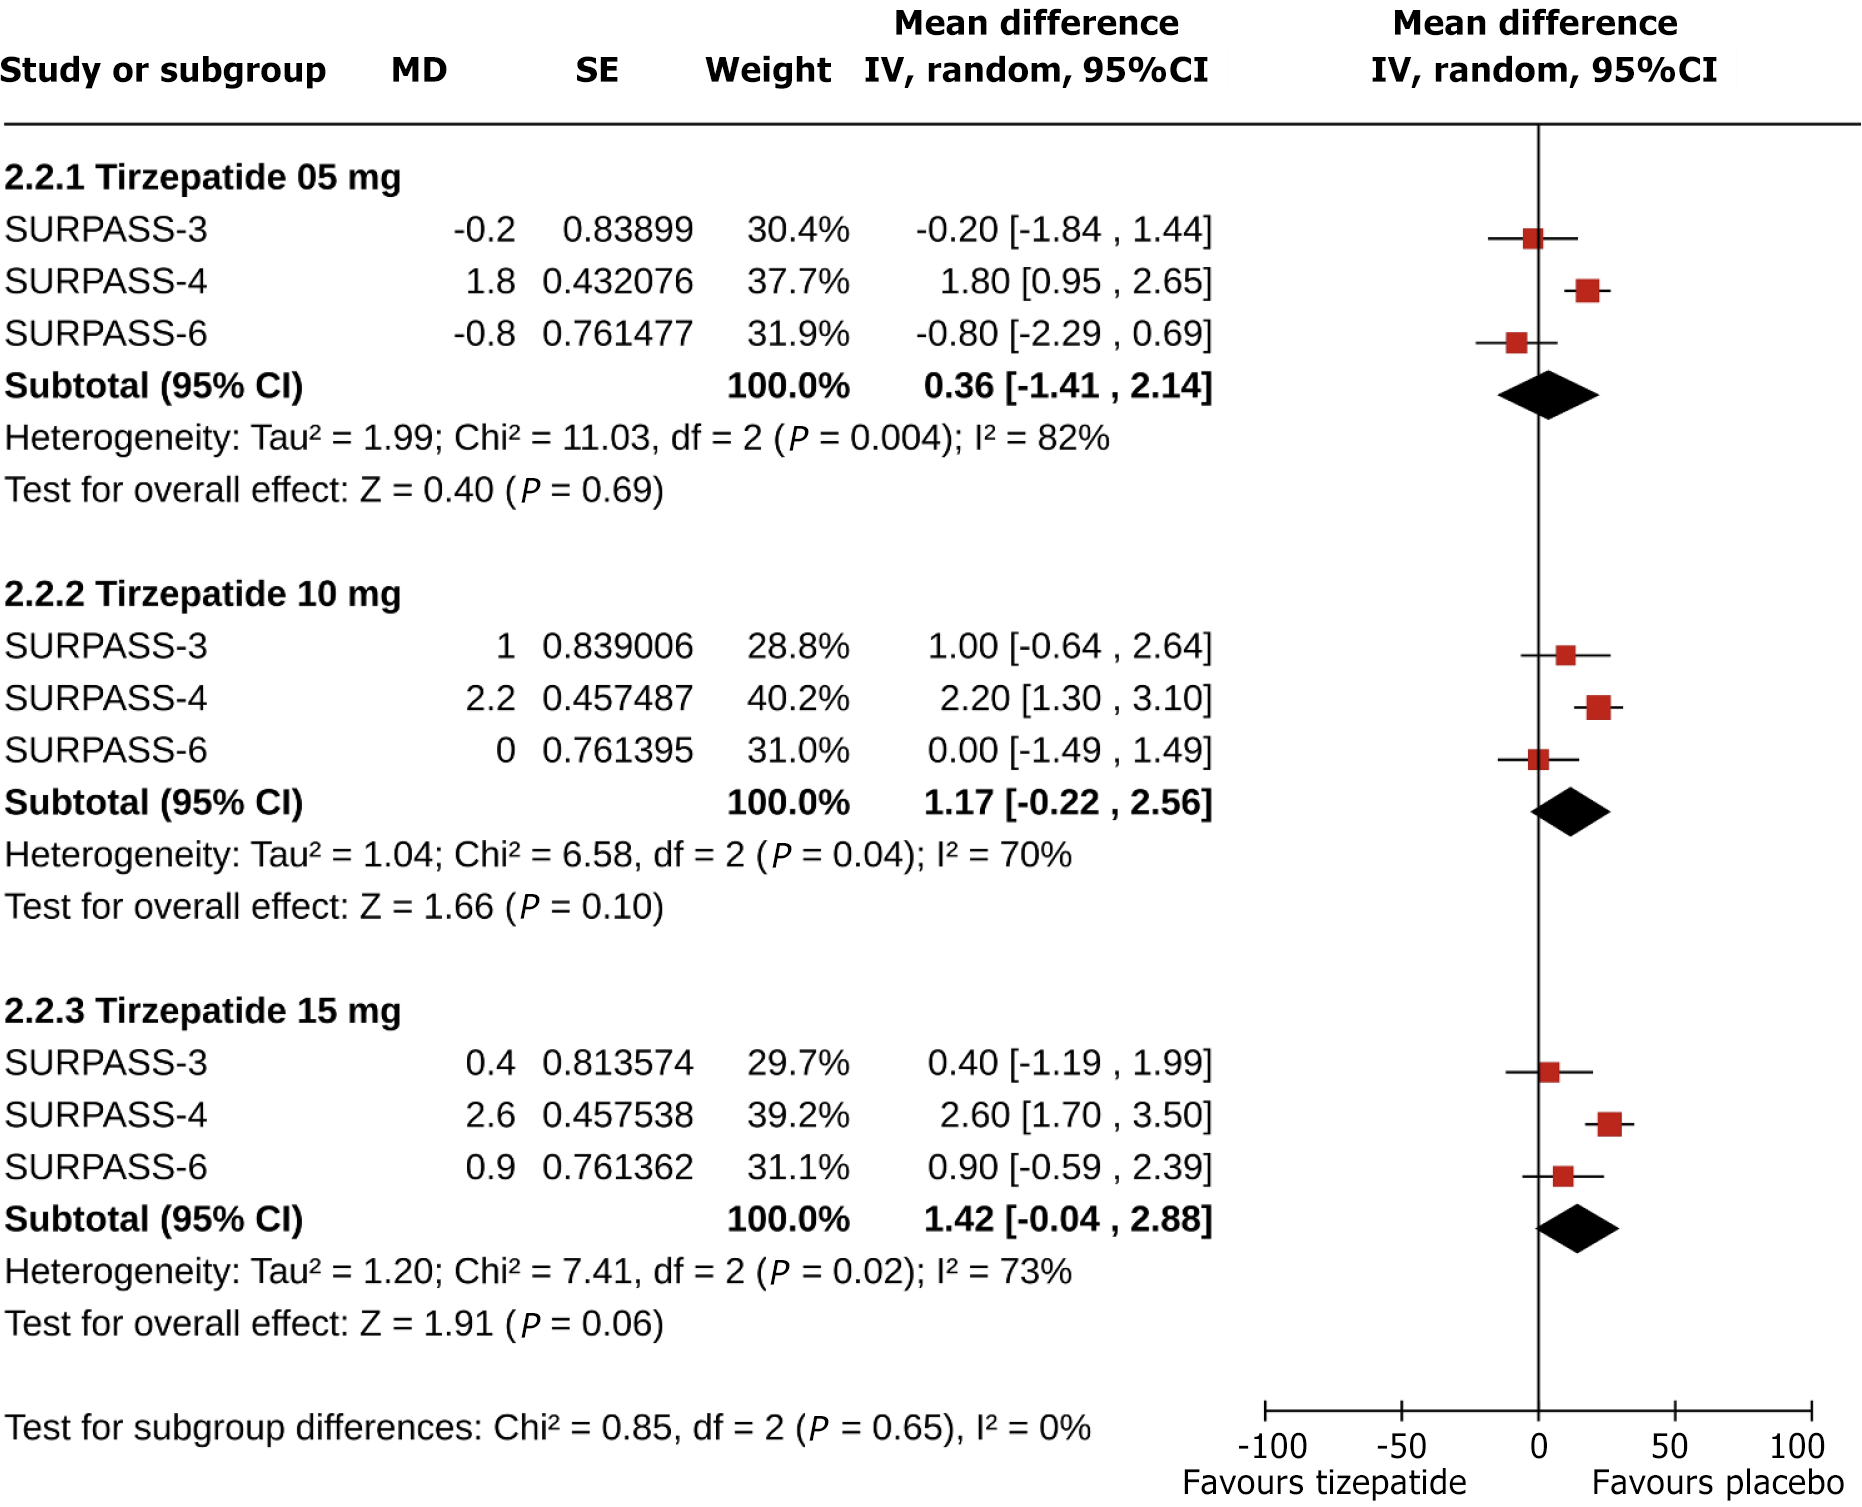
Figure 4 Forest plot highlighting the change from baseline in estimated glomerular filtration rate in Tirzepatide vs Insulin groups.
- Citation: Kamrul-Hasan A, Patra S, Dutta D, Nagendra L, Muntahi-Reza A, Borozan S, Pappachan JM. Renal effects and safety of tirzepatide in subjects with and without diabetes: A systematic review and meta-analysis. World J Diabetes 2025; 16(2): 101282
- URL: https://www.wjgnet.com/1948-9358/full/v16/i2/101282.htm
- DOI: https://dx.doi.org/10.4239/wjd.v16.i2.101282


