©The Author(s) 2025.
World J Diabetes. Nov 15, 2025; 16(11): 111698
Published online Nov 15, 2025. doi: 10.4239/wjd.v16.i11.111698
Published online Nov 15, 2025. doi: 10.4239/wjd.v16.i11.111698
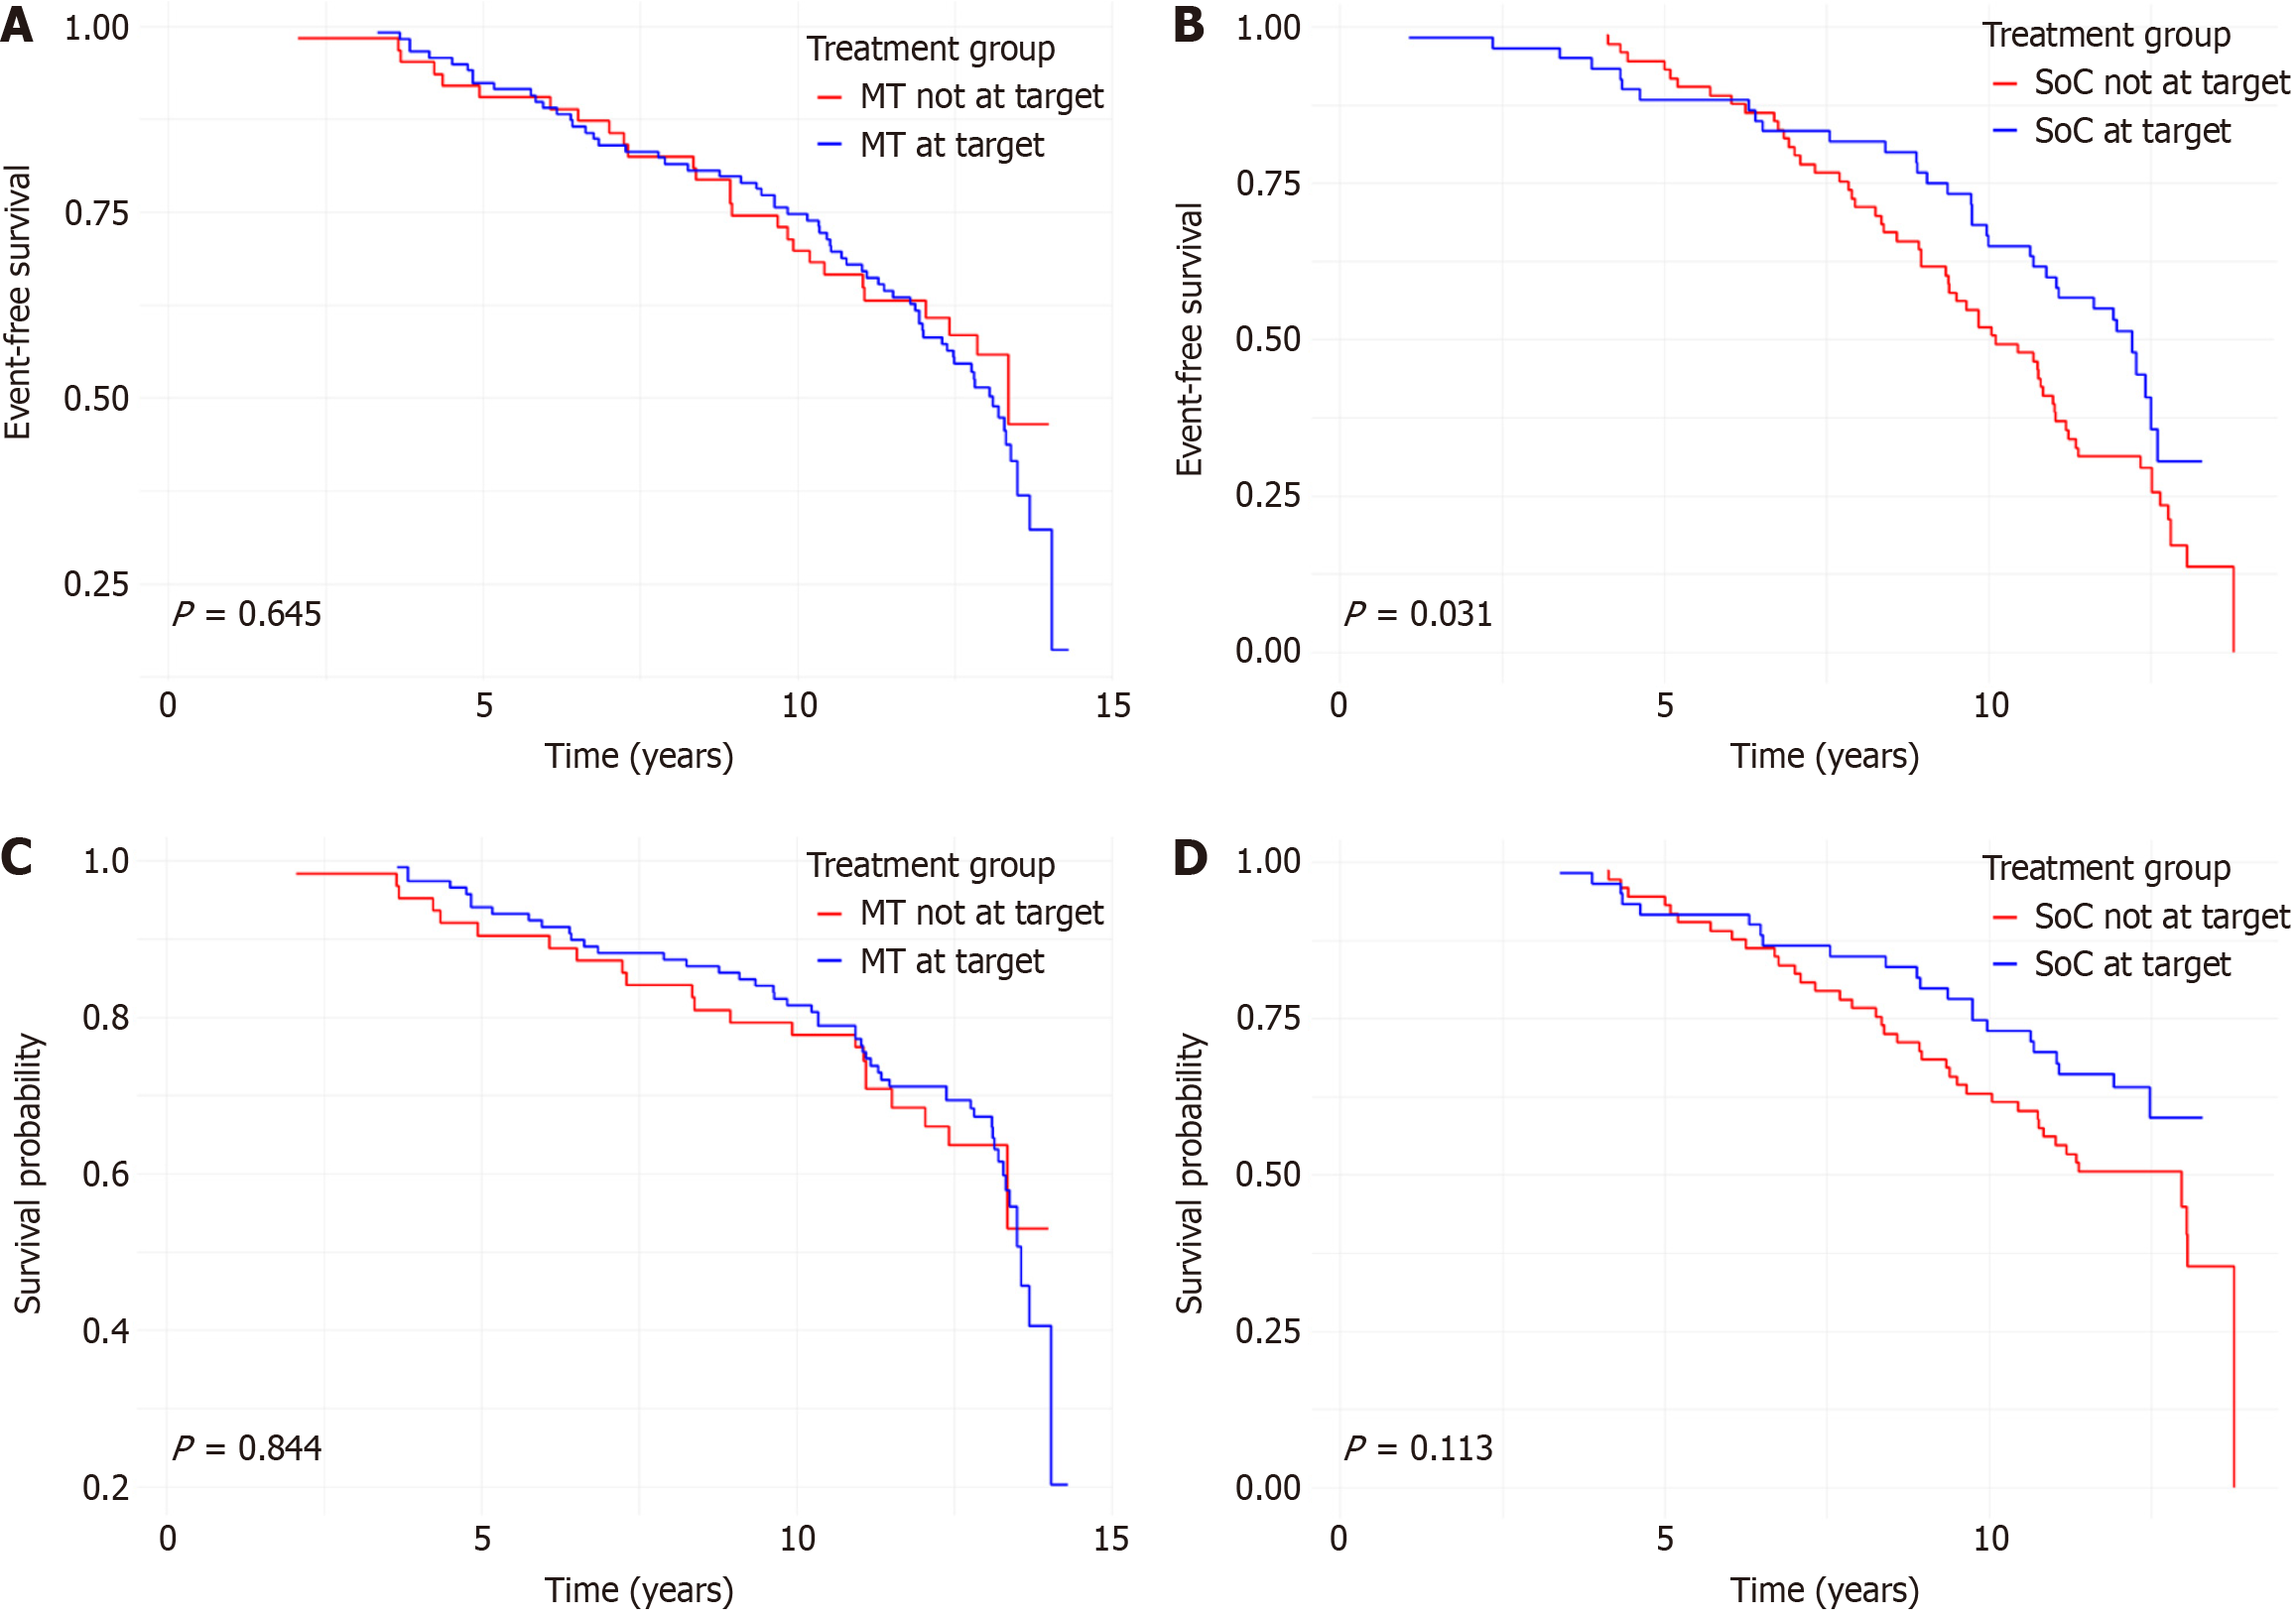
Figure 1 Kaplan-Meier curves according to glycated hemoglobin target.
Curves for major adverse cardiovascular events: A: In the multifactorial intensive therapy (MT) group [glycated hemoglobin (HbA1c) at target: Yes = 119; No = 65]; B: In the standard of care (SoC) group (HbA1c at target: Yes = 60; No = 79); Curves for all-cause mortality: C: In the MT group (HbA1c at target: Yes = 119; No = 65); D: In the SoC group (HbA1c at target: Yes = 60; No = 79). In each panel, red curves indicate patients not at HbA1c target, and blue curves indicate patients at HbA1c target within the corresponding therapy group. MT: Multifactorial intensive therapy; SoC: Standard of care.
- Citation: Caturano A, Simeon V, Galiero R, Russo V, De Nicola L, Chiodini P, Rinaldi L, Vetrano E, Salvatore T, Conte C, Acierno C, Sardu C, Marfella R, Minutolo R, Sasso FC. Impact of achieving glycated hemoglobin targets on cardiovascular events/mortality: Post-hoc analysis of the nephropathy in diabetes type 2 trial. World J Diabetes 2025; 16(11): 111698
- URL: https://www.wjgnet.com/1948-9358/full/v16/i11/111698.htm
- DOI: https://dx.doi.org/10.4239/wjd.v16.i11.111698


