©The Author(s) 2025.
World J Diabetes. Nov 15, 2025; 16(11): 111223
Published online Nov 15, 2025. doi: 10.4239/wjd.v16.i11.111223
Published online Nov 15, 2025. doi: 10.4239/wjd.v16.i11.111223
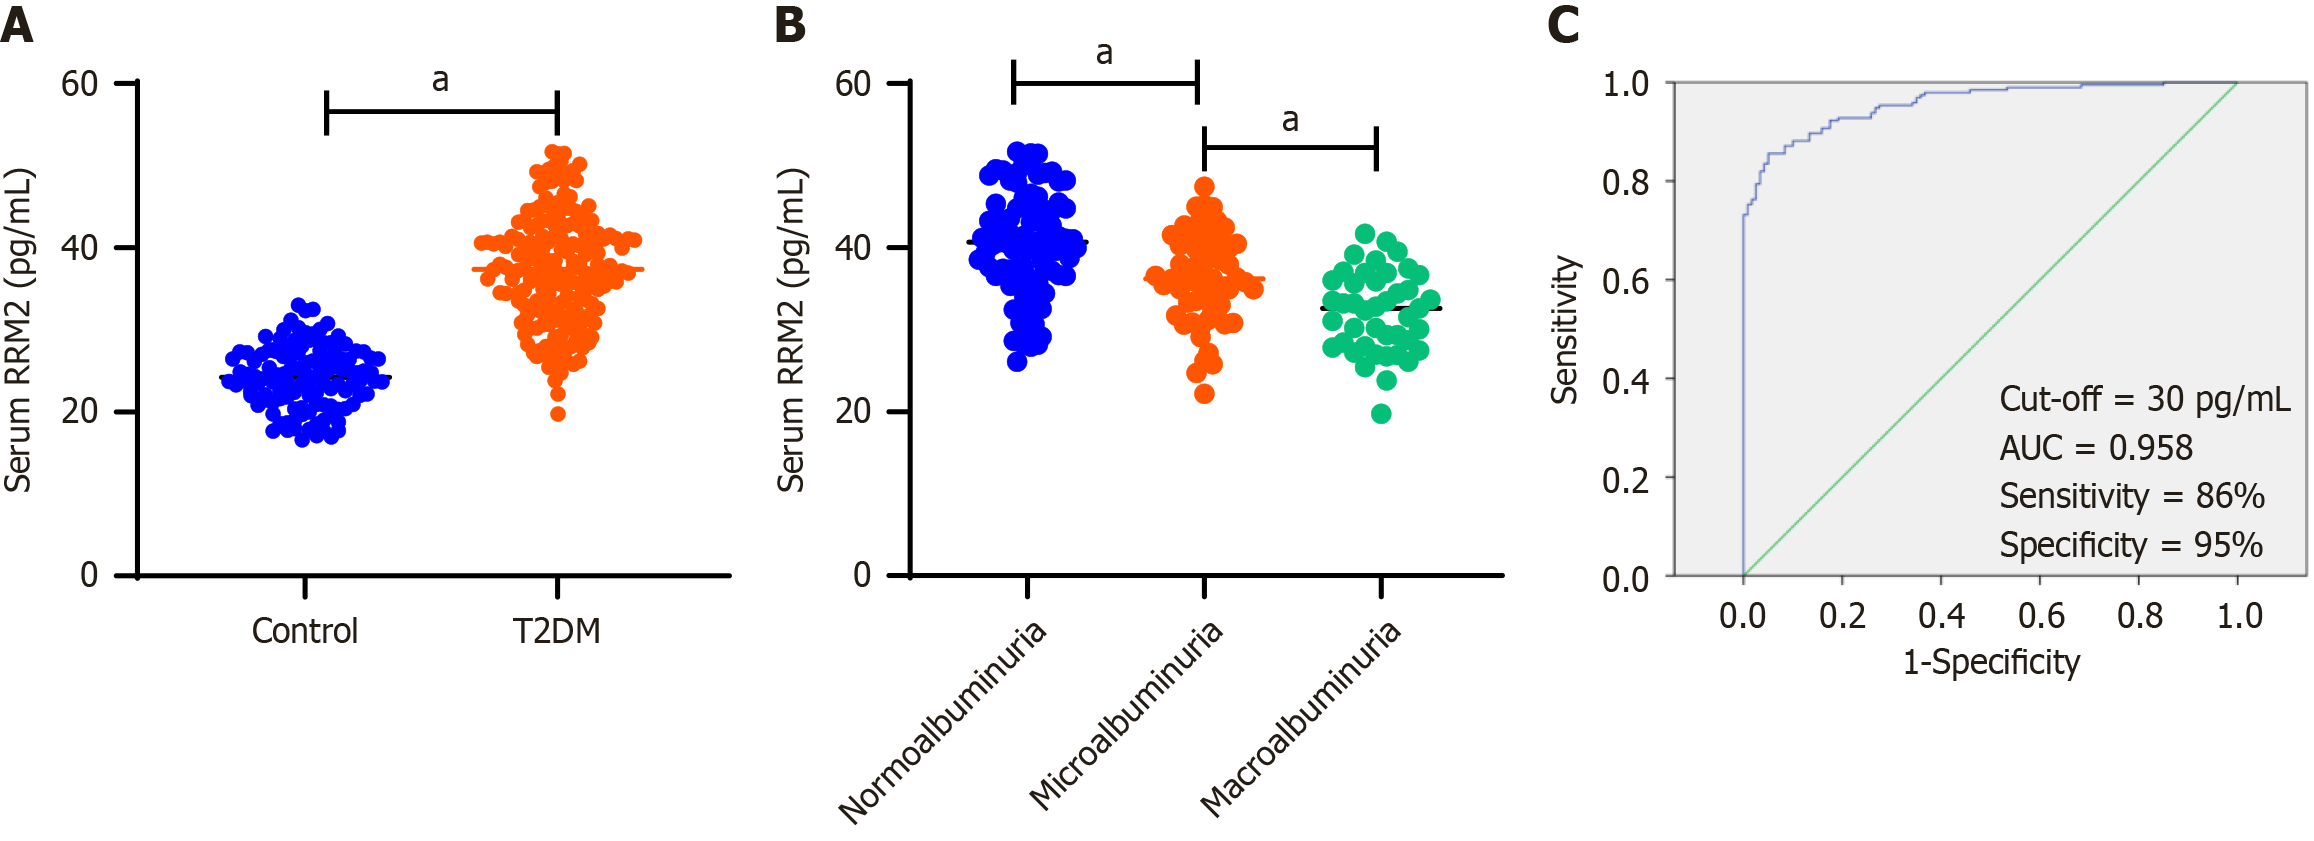
Figure 1 Serum ribonucleotide reductase regulatory subunit M2 levels in control subjects and type 2 diabetes mellitus patients.
A: Comparison of serum ribonucleotide reductase regulatory subunit M2 (RRM2) levels between control subjects and type 2 diabetes mellitus (T2DM) patients. The serum RRM2 concentration in T2DM patients (n = 194) was significantly higher than that in the control subjects (n = 120). The t-test was applied; B: Comparison of serum RRM2 levels among the three subgroups of T2DM patients. Serum RRM2 concentration in patients with macroalbuminuria (n = 43) was significantly lower than that in patients with normoalbuminuria (n = 93) and microalbuminuria (n = 58). ANOVA was applied; C: The receiver operating characteristic curve was used to obtain the optimal cutoff value of serum RRM2 (30 pg/mL) that distinguishes T2DM patients from healthy controls. aP < 0.001. RRM2: Ribonucleotide reductase regulatory subunit M2; T2DM: Type 2 diabetes mellitus.
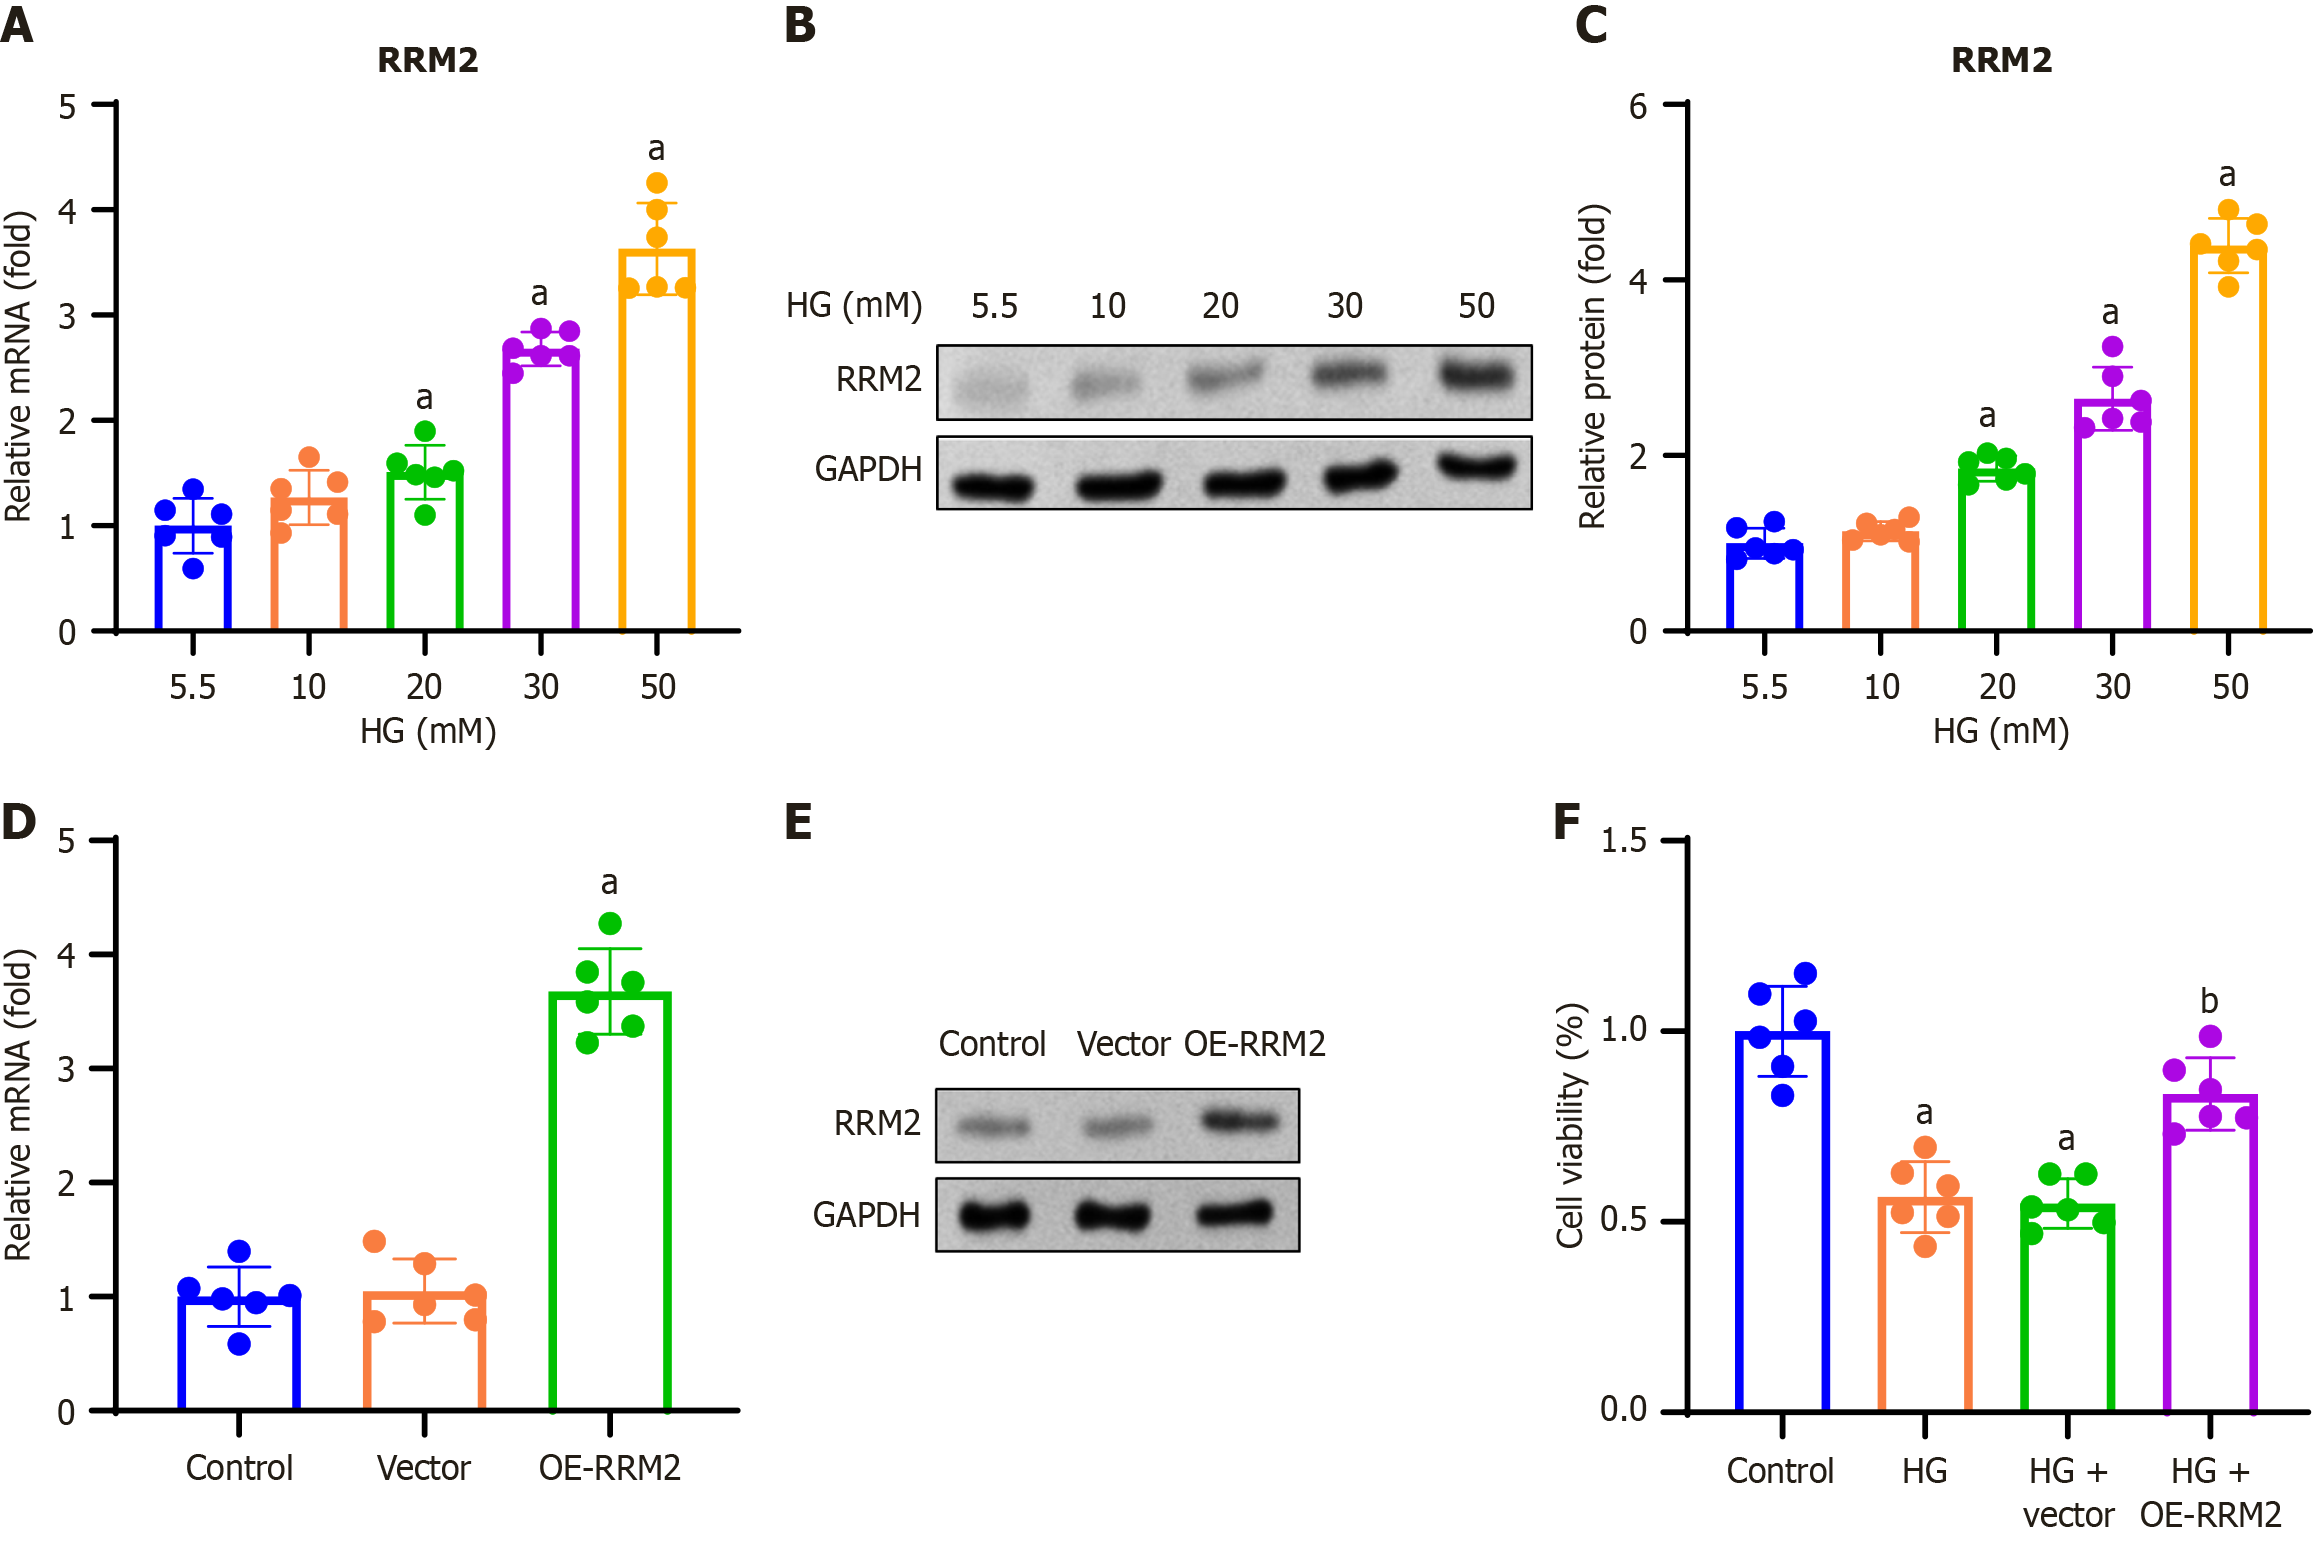
Figure 2 Ribonucleotide reductase regulatory subunit M2 overexpression increased the proliferation of high glucose-treated renal tubular cells.
HK-2 cells were treated with 5.5, 10, 20, 30, and 50 mmol/L D-glucose for 48 hours. A: Ribonucleotide reductase regulatory subunit M2 (RRM2) mRNA expression was determined using reverse transcription quantitative PCR (RT-qPCR); B: Representative gel blots of RRM2 obtained by Western blotting; C: RRM2 protein blots were quantified by normalizing to GAPDH; D and E: HK-2 cells were transfected with pCDH-CMV-RRM2 or an empty vector, and RT-qPCR and Western blotting were performed 48 hours after transfection; F: HK-2 cells were transfected with pCDH-CMV-RRM2 or an empty vector and treated with high glucose (HG; 30 mmol/L) for 48 hours. The effect of RRM2 overexpression on cell viability was assessed using MTT assay. Data are presented as mean ± SD in triplicate and analyzed using one-way ANOVA. aP < 0.001 vs HG (5.5 mM) group or control group; bP < 0.001 vs HG + vector. RRM2: Ribonucleotide reductase regulatory subunit M2; HG: High glucose; OE-RRM2: Overexpressing ribonucleotide reductase regulatory subunit M2.
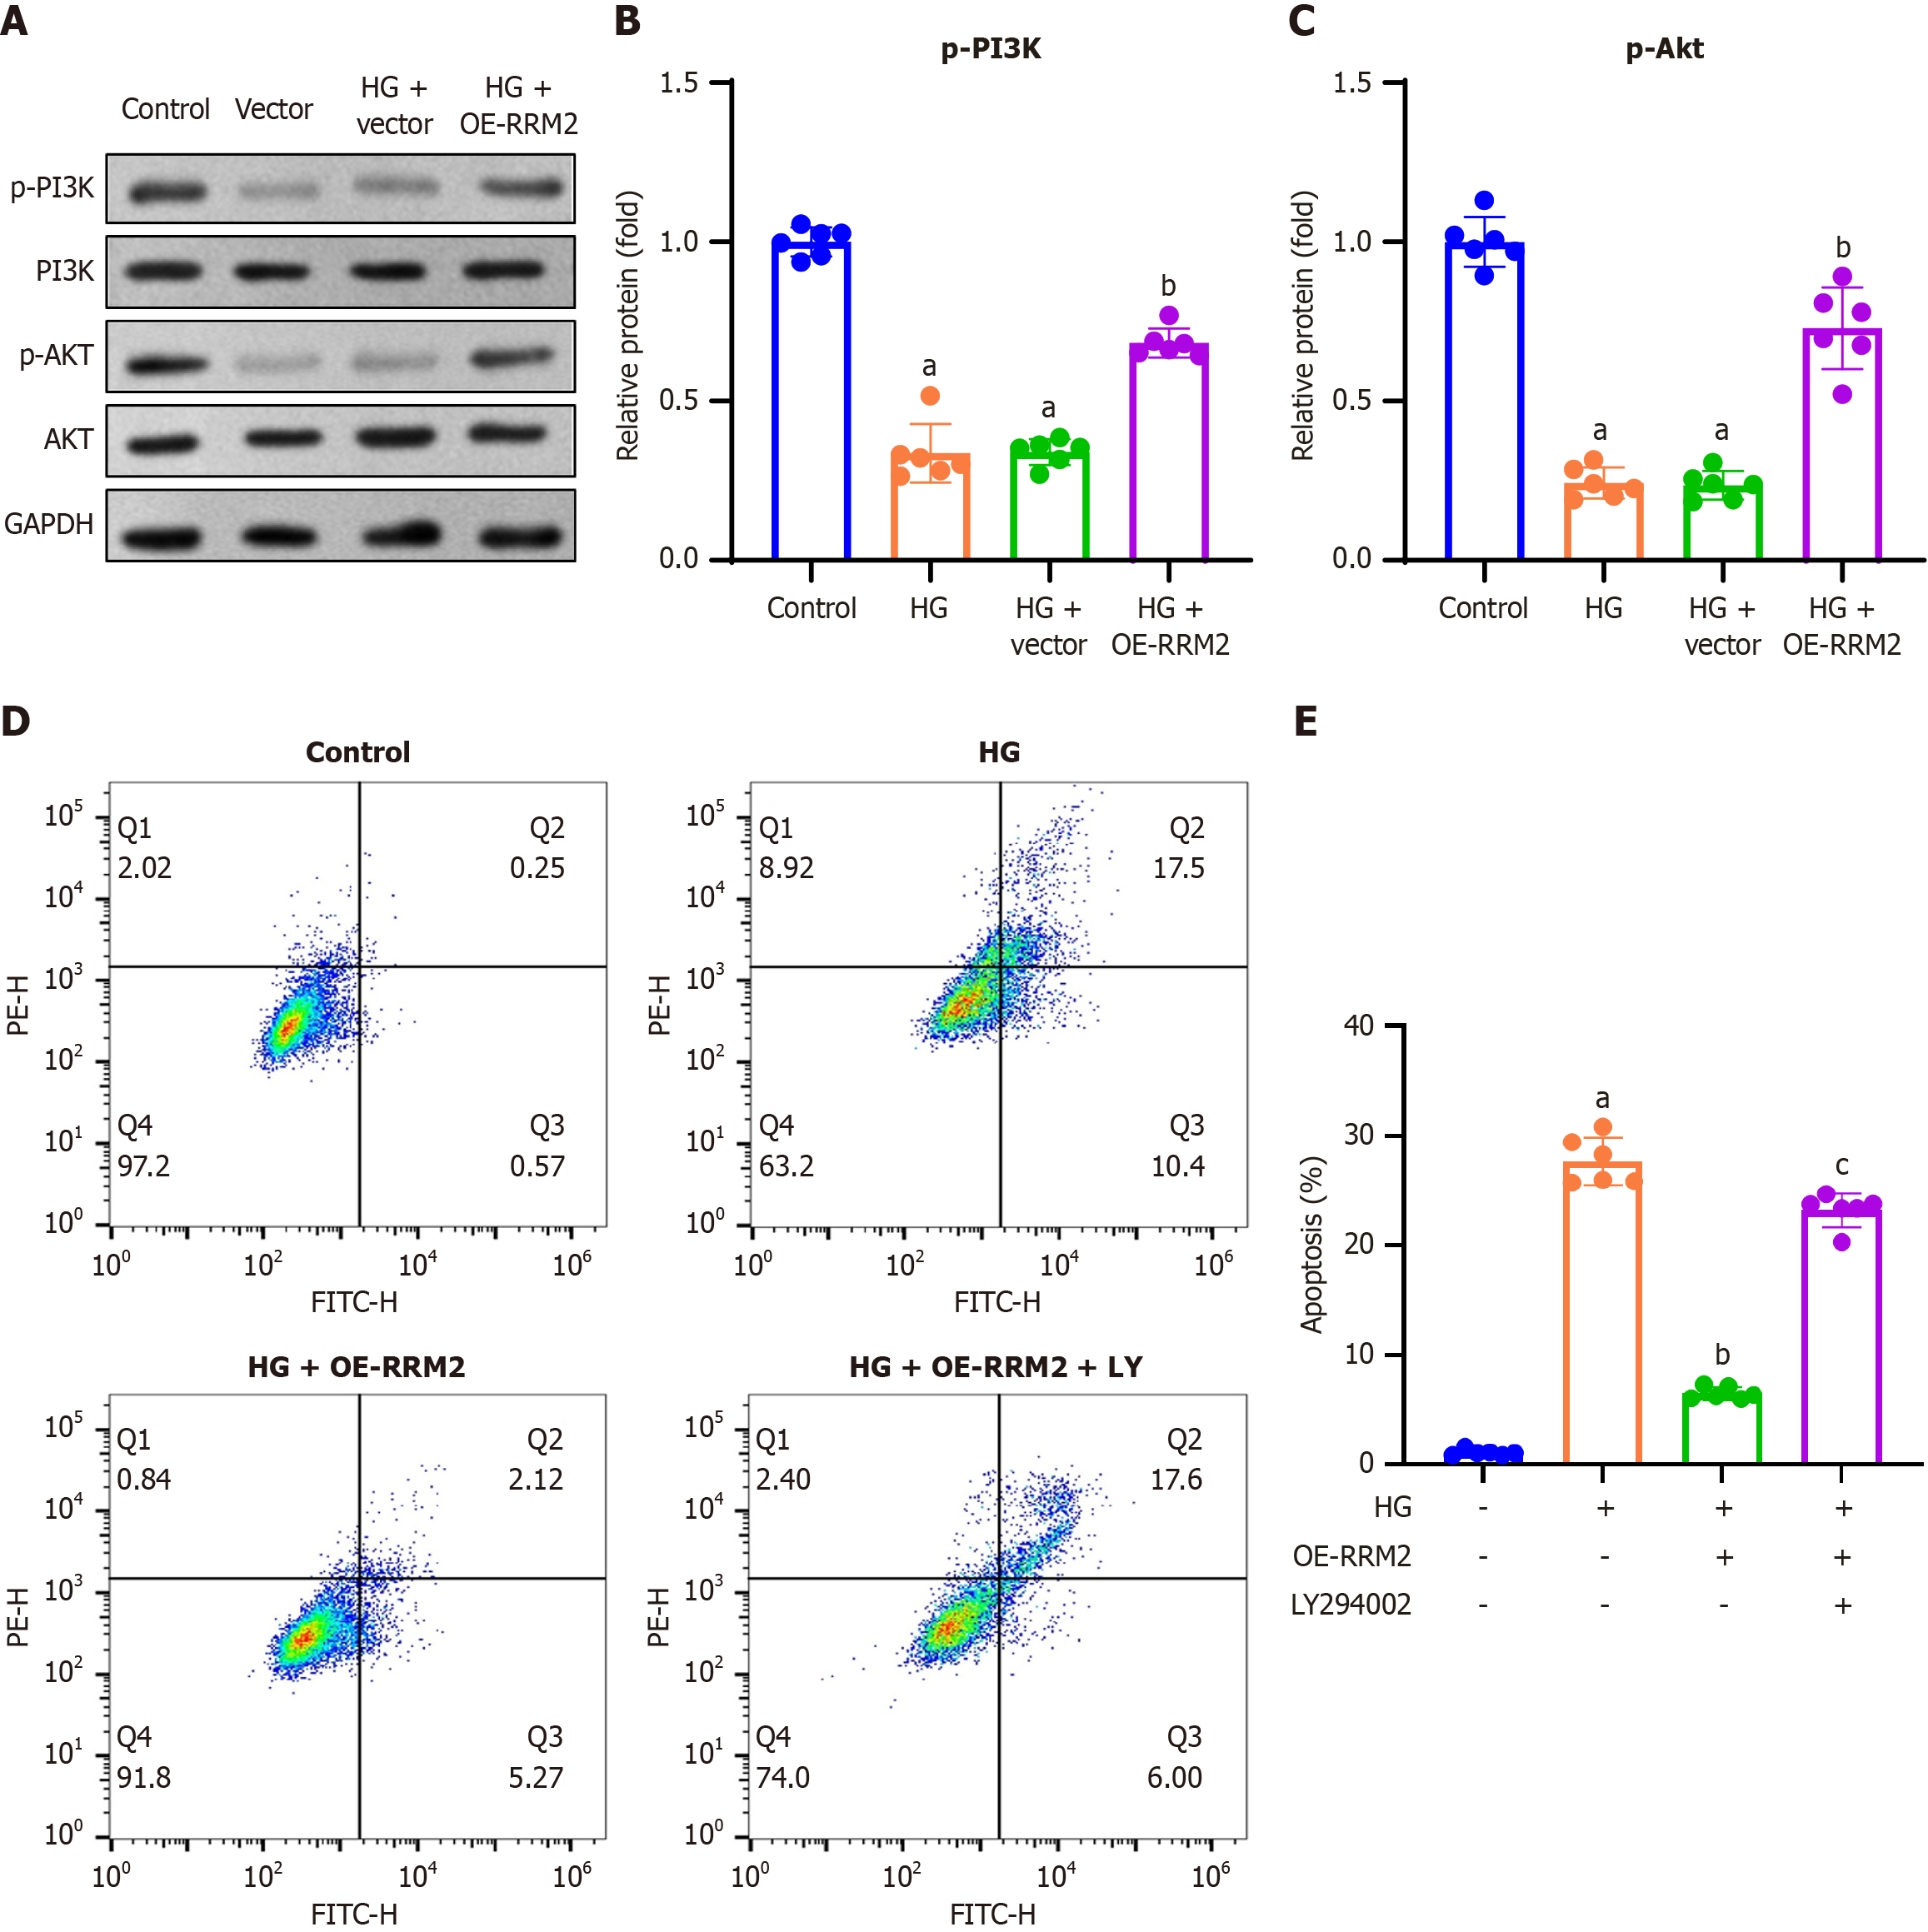
Figure 3 Ribonucleotide reductase regulatory subunit M2 overexpression activates the PI3K/Akt pathway and suppresses apoptosis in high glucose-treated renal tubular cells.
A: Representative gel blots of phosphorylated PI3K (p-PI3K, p85, Tyr458) and Akt (p-Akt, Ser473); B and C: Quantification of p-PI3K (normalized to total PI3K) and p-Akt (normalized to total Akt) levels. HK-2 cells were transfected with pCDH-CMV-ribonucleotide reductase regulatory subunit M2 (RRM2) or an empty vector and co-treated with the PI3K/Akt pathway inhibitor LY294002 (10 μM) and high glucose (HG; 30 mmol/L) for 48 hours; D: Cell apoptosis was assessed by Annexin V-FITC double staining and analyzed using flow cytometry; E: Apoptotic rate was calculated by summing the number of early apoptotic cells (lower right quadrant) and late apoptotic cells (upper right quadrant). Data are presented as mean ± SD in triplicate and analyzed using one-way ANOVA. aP < 0.001 vs control group; bP < 0.001 vs HG group; cP < 0.001 vs HG + OE-RRM2 group. HG: High glucose; OE-RRM2: Overexpressing ribonucleotide reductase regulatory subunit M2.
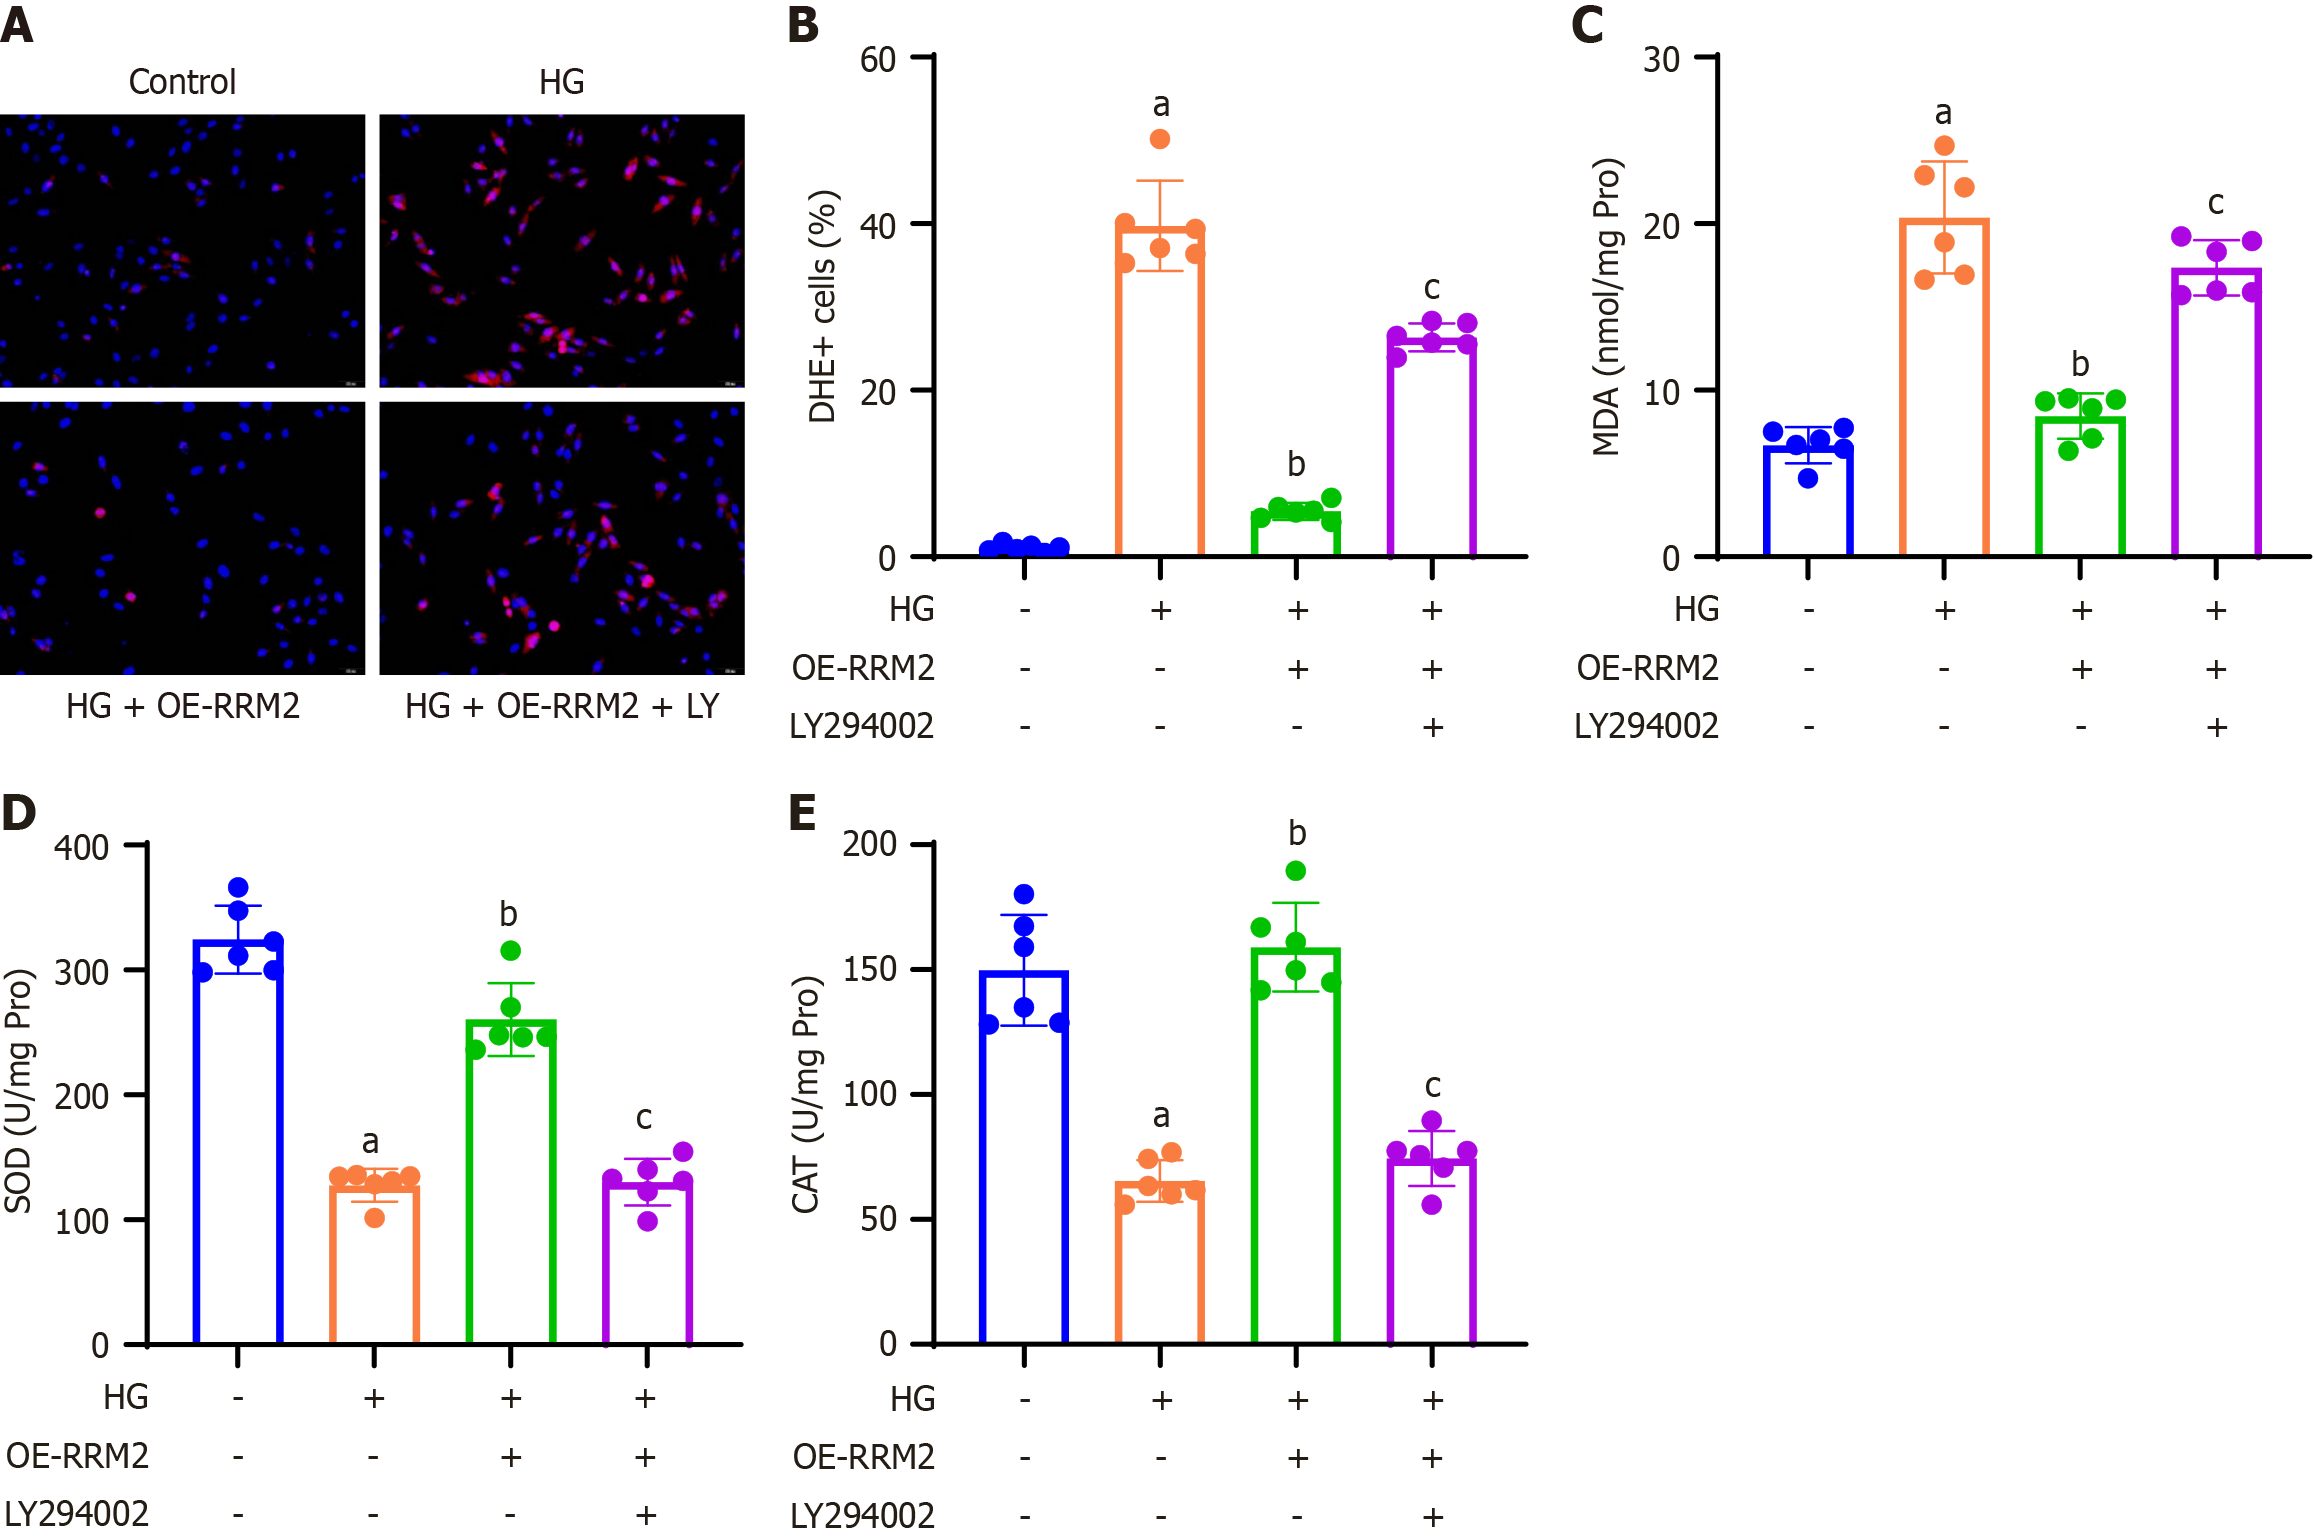
Figure 4 Ribonucleotide reductase regulatory subunit M2 overexpression suppresses cellular reactive oxygen species production and oxidative stress in high glucose-treated renal tubular cells via the PI3K/Akt signaling pathway.
A: Representative images of dihydroergotamine (DHE) staining of HK-2 cells; B: Quantification of DHE-positive cells relative to DAPI-positive cells in the different groups; C-E: The colorimetric method was applied to analyze oxidative stress indicators in the lysate of HK-2 cells, and the levels of malondialdehyde (C), superoxide dismutase (D), and catalase (E) were measured. Data are presented as mean ± SD in triplicate and analyzed using one-way ANOVA. aP < 0.001 vs control group; bP < 0.001 vs high glucose (HG) group; cP < 0.001 vs HG + OE-ribonucleotide reductase regulatory subunit M2 group. HG: High glucose; OE-RRM2: Overexpressing ribonucleotide reductase regulatory subunit M2; DHE: Dihydroergotamine; MDA: Malondialdehyde; SOD: Superoxide dismutase; CAT: Catalase.
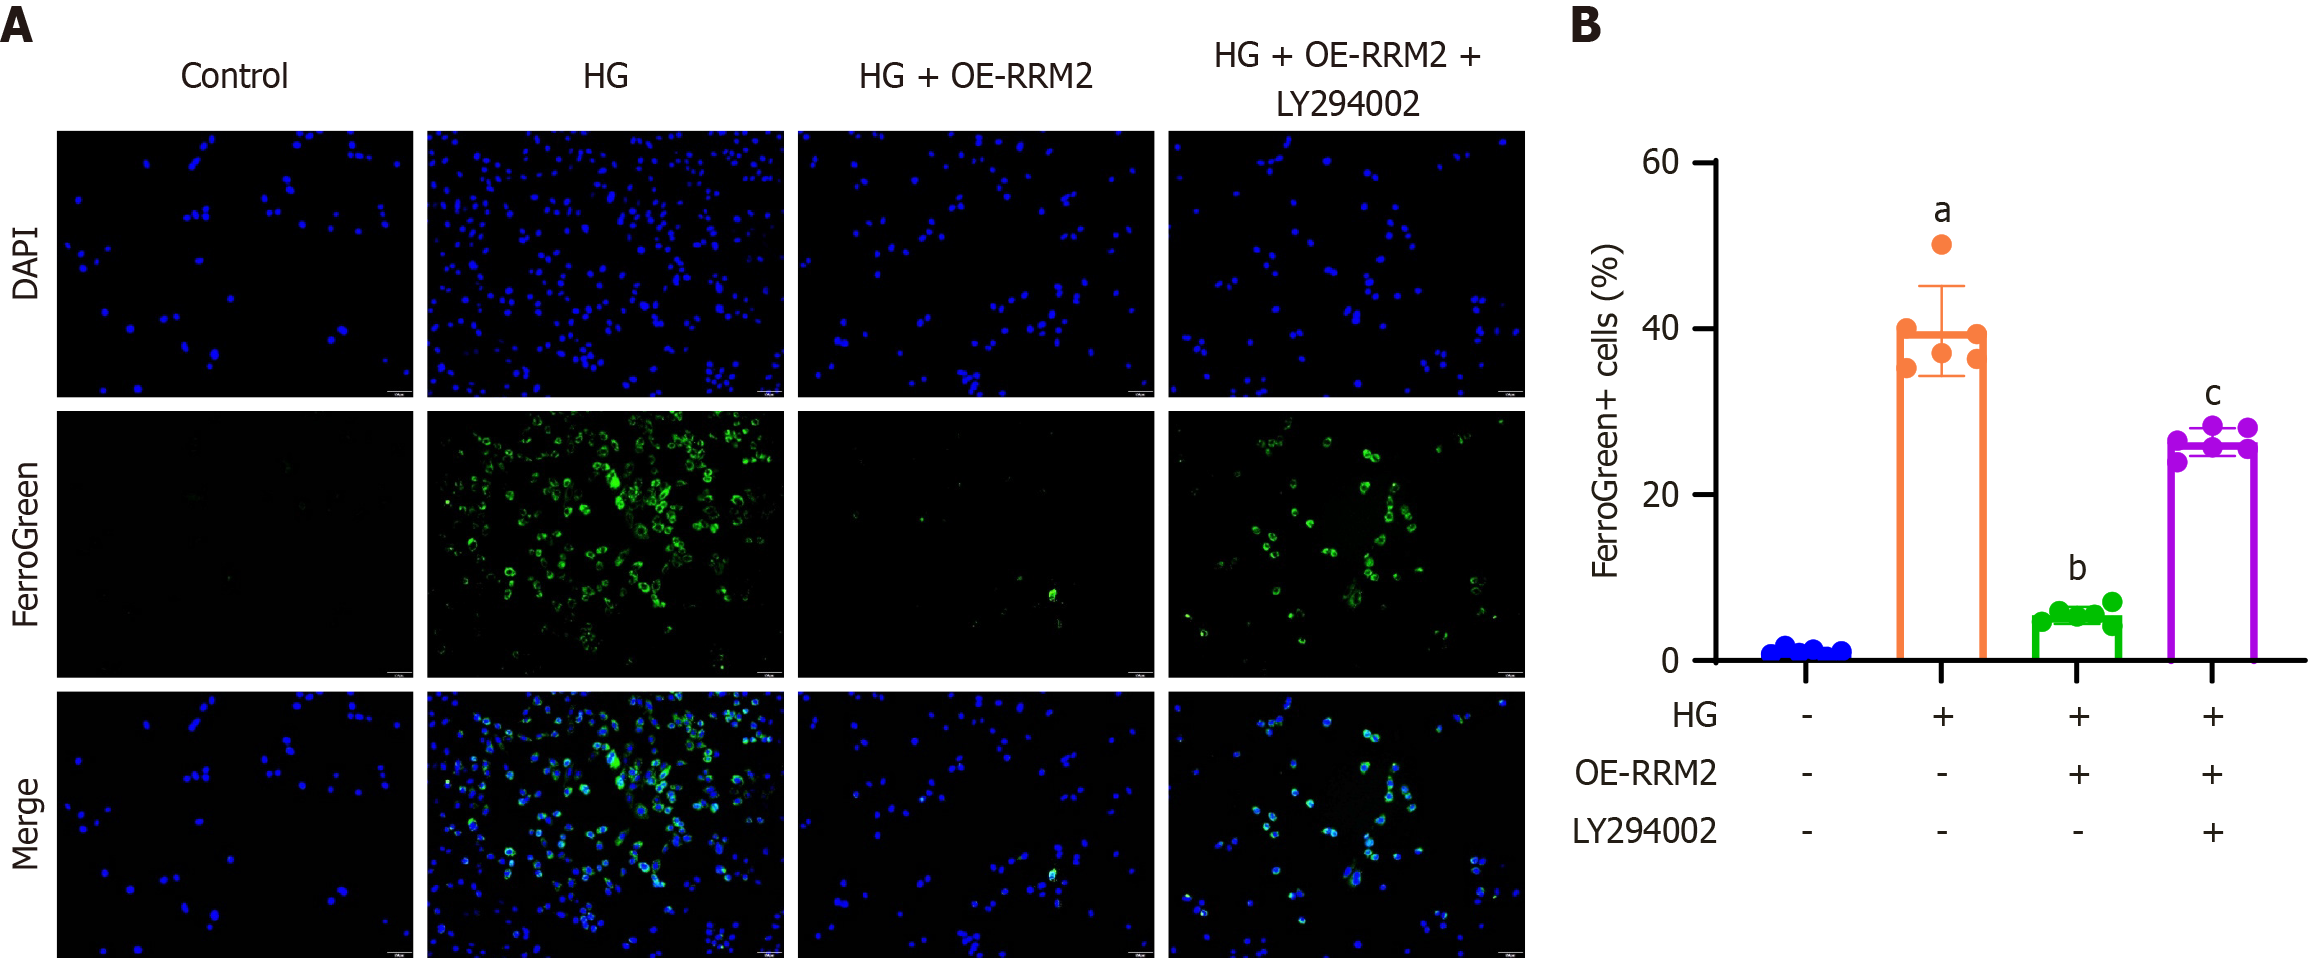
Figure 5 Ribonucleotide reductase regulatory subunit M2 overexpression suppresses ferroptosis by activating the PI3K/Akt pathway.
A: HK-2 cells were stained with Mito FerroGreen to visualize mitochondrial ferrous iron using green fluorescence. A representative image of FerroGreen-positive cells is shown (200 × magnification); B: Quantification of the percentage of FerroGreen-positive cells relative to DAPI-positive cells. Data are presented as mean ± SD in triplicate and analyzed using one-way ANOVA. aP < 0.001 vs control group; bP < 0.001 vs high glucose (HG) group; cP < 0.001 vs HG + OE- ribonucleotide reductase regulatory subunit M2 group. HG: High glucose; OE-RRM2: Overexpressing ribonucleotide reductase regulatory subunit M2.
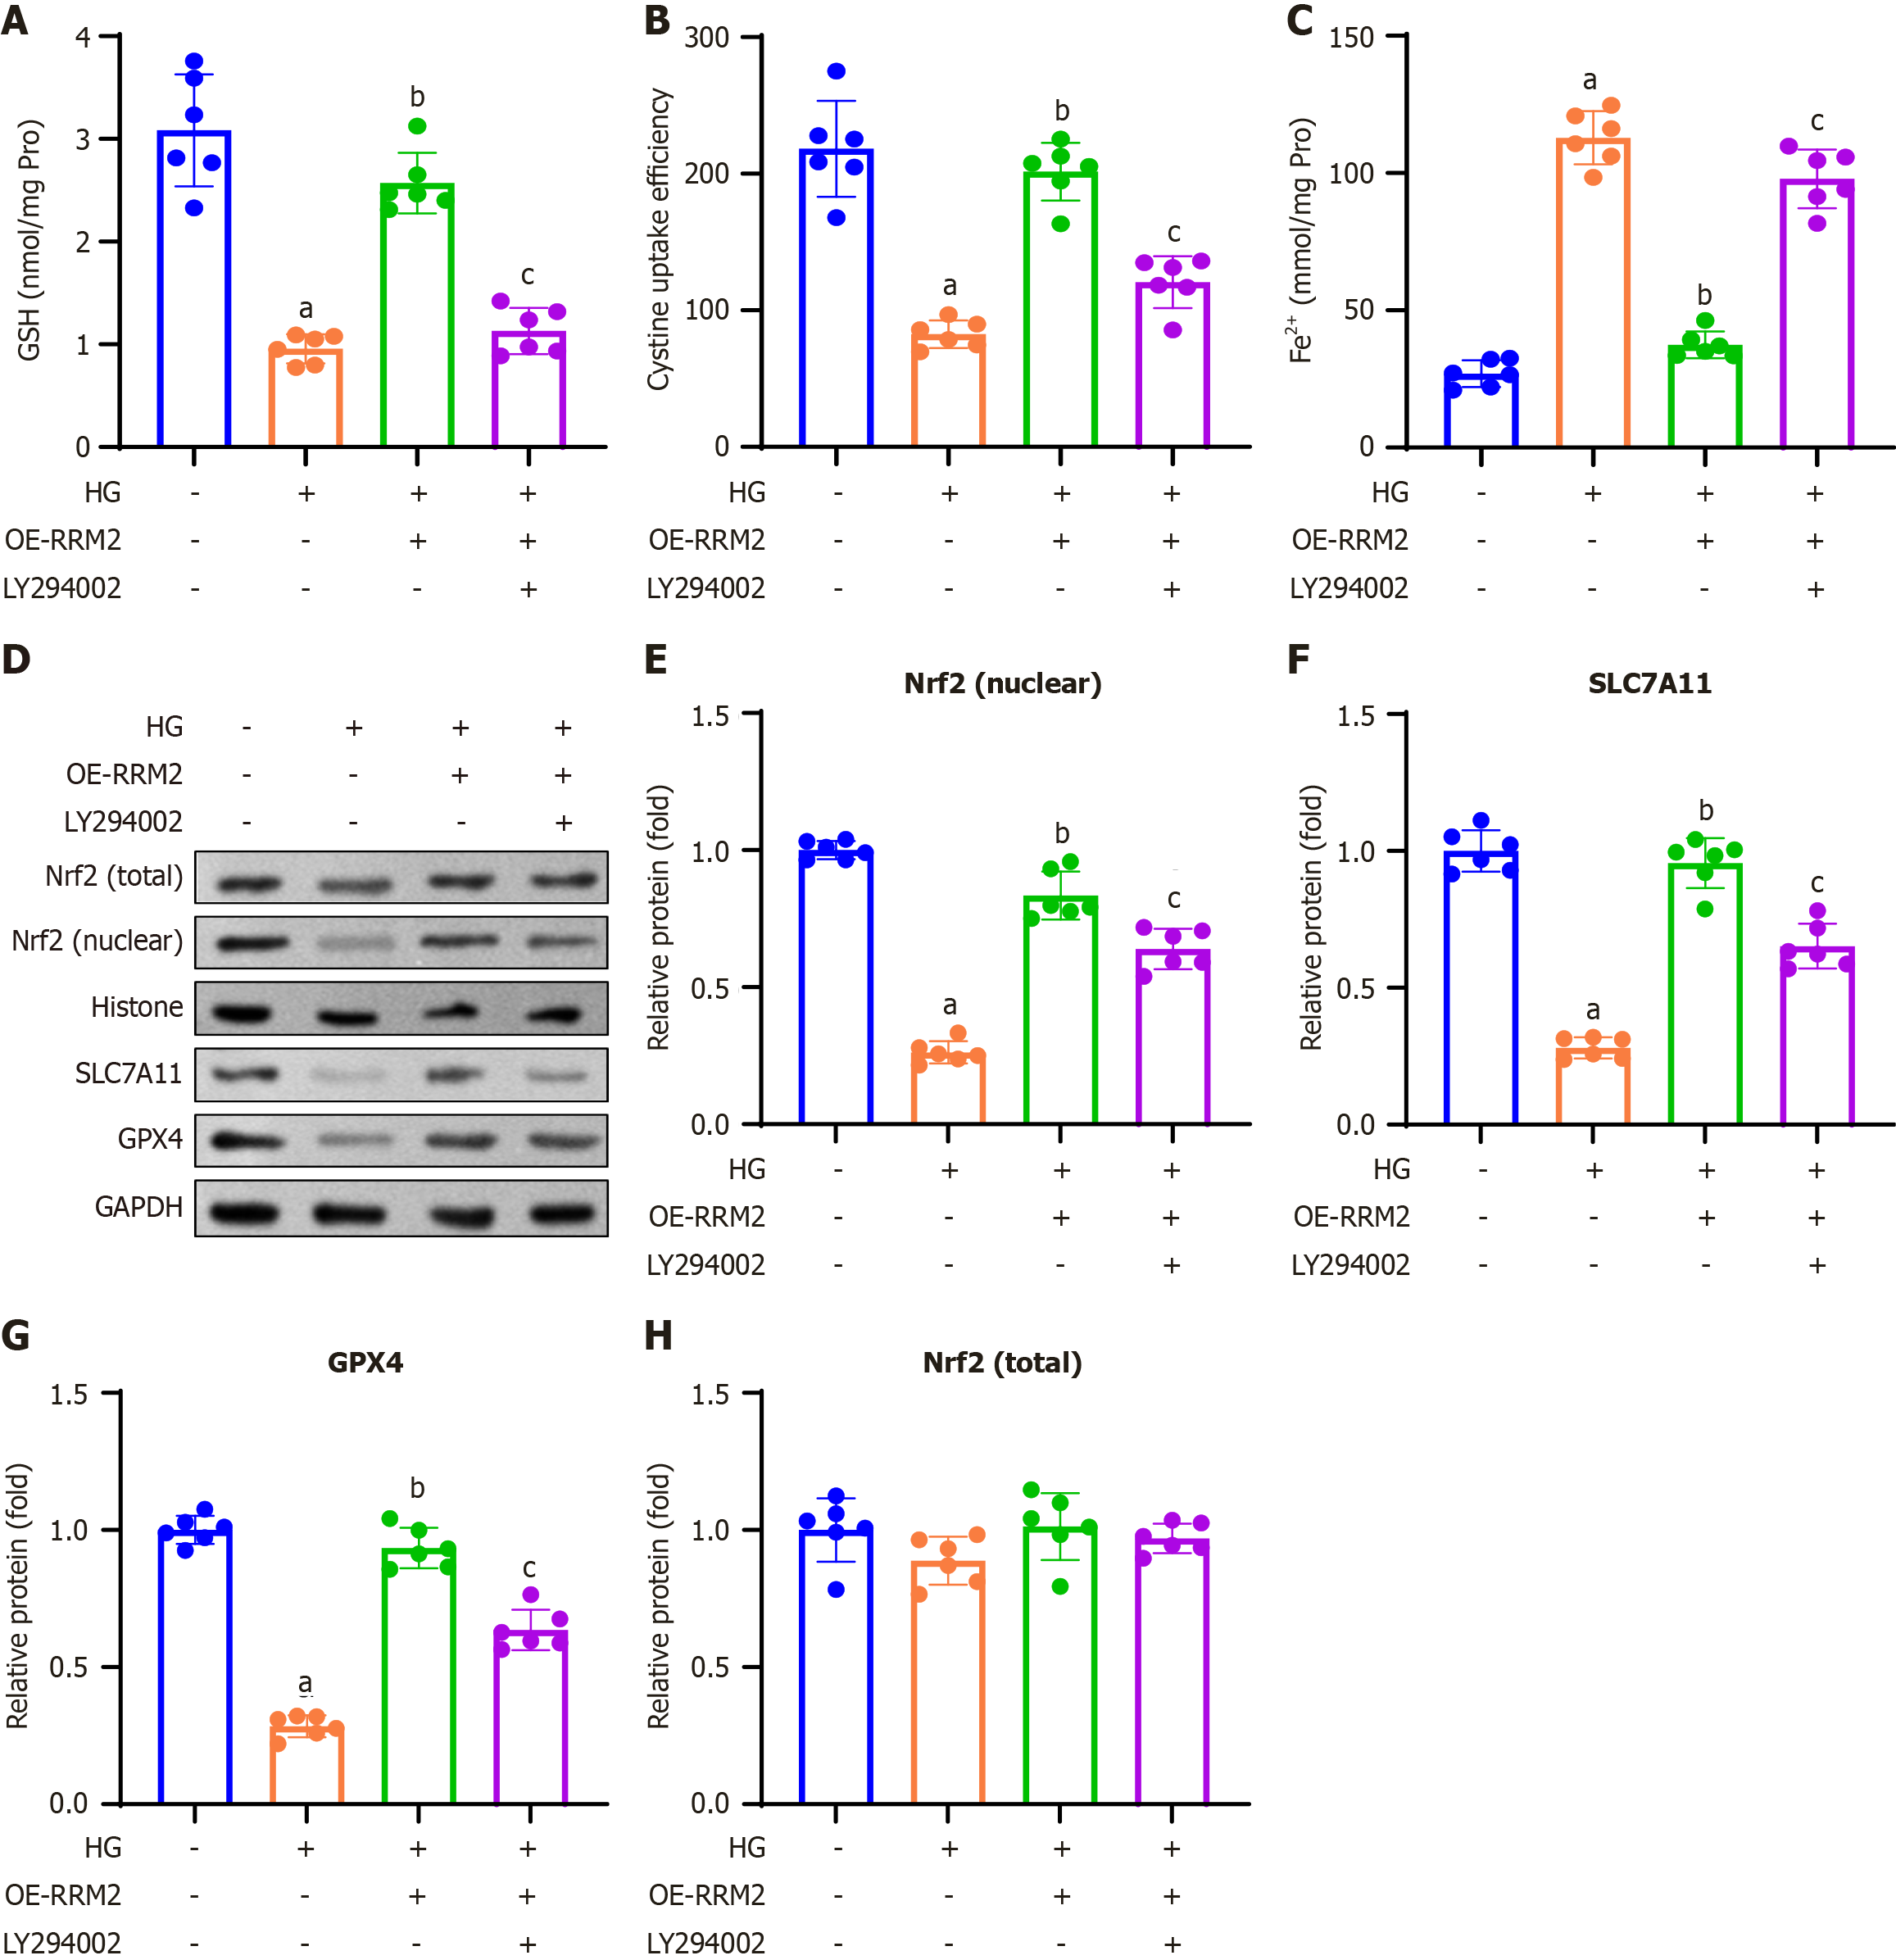
Figure 6 Ribonucleotide reductase regulatory subunit M2 overexpression modulates ferroptosis-related indicators and proteins through the PI3K/Akt pathway.
A: Colorimetric method was used to analyze the glutathione content; B: Cystine uptake capacity was measured in high glucose (HG)-treated HK-2 cells; C: The concentration of Fe2+ was measured in the HG-treated HK-2 cells; D: Western blotting was performed to determine ferroptosis-related proteins; E-H: Nrf2 (E; nuclear, normalized to histone), SLC7A11 (F) GPX4 (G), and quantification of Nrf2 (H; total, normalized to GAPDH). Data are presented as mean ± SD in triplicate and analyzed using one-way ANOVA. aP < 0.001 vs control group; bP < 0.001 vs HG group; cP < 0.001 vs HG + overexpressing-ribonucleotide reductase regulatory subunit M2 group. HG: High glucose; OE-RRM2: Overexpressing ribonucleotide reductase regulatory subunit M2; GSH: Glutathione.
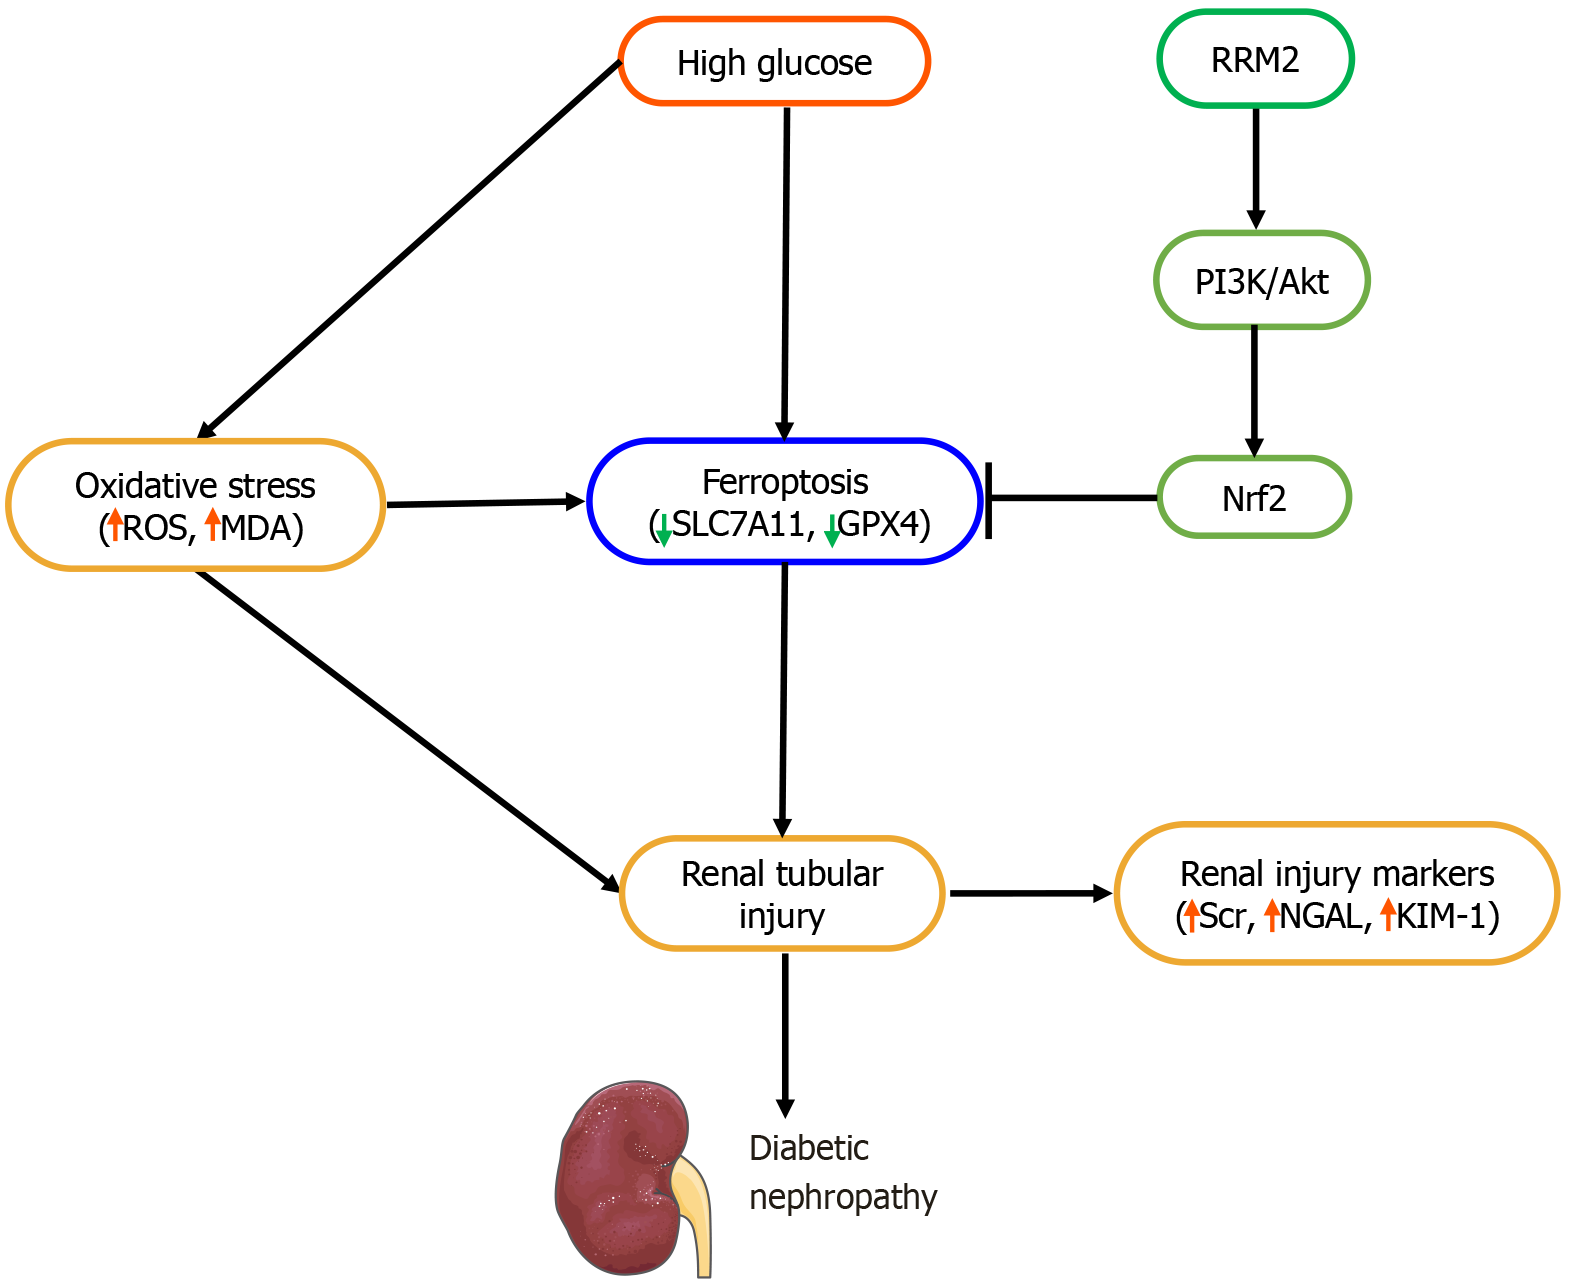
Figure 7 Schematic representation of the role of ribonucleotide reductase regulatory subunit M2 in ferroptosis and diabetic nephropathy.
ROS: Reactive oxygen species; MDA: Malondialdehyde; SLC7A11: Solute carrier family 7 member 11; GPX4: Glutathione peroxidase 4; RRM2: Ribonucleotide reductase regulatory subunit M2; Scr: Serum creatinine; NGAL: Neutrophil gelatinase-associated lipocalin; KIM-1: Kidney injury molecule-1.
- Citation: Gao CC, Ding FF, Jiang X. RRM2 attenuates the renal tubular ferroptosis in diabetic kidney disease through PI3K/Akt/Nrf2 pathway. World J Diabetes 2025; 16(11): 111223
- URL: https://www.wjgnet.com/1948-9358/full/v16/i11/111223.htm
- DOI: https://dx.doi.org/10.4239/wjd.v16.i11.111223


