©The Author(s) 2025.
World J Diabetes. Nov 15, 2025; 16(11): 109859
Published online Nov 15, 2025. doi: 10.4239/wjd.v16.i11.109859
Published online Nov 15, 2025. doi: 10.4239/wjd.v16.i11.109859
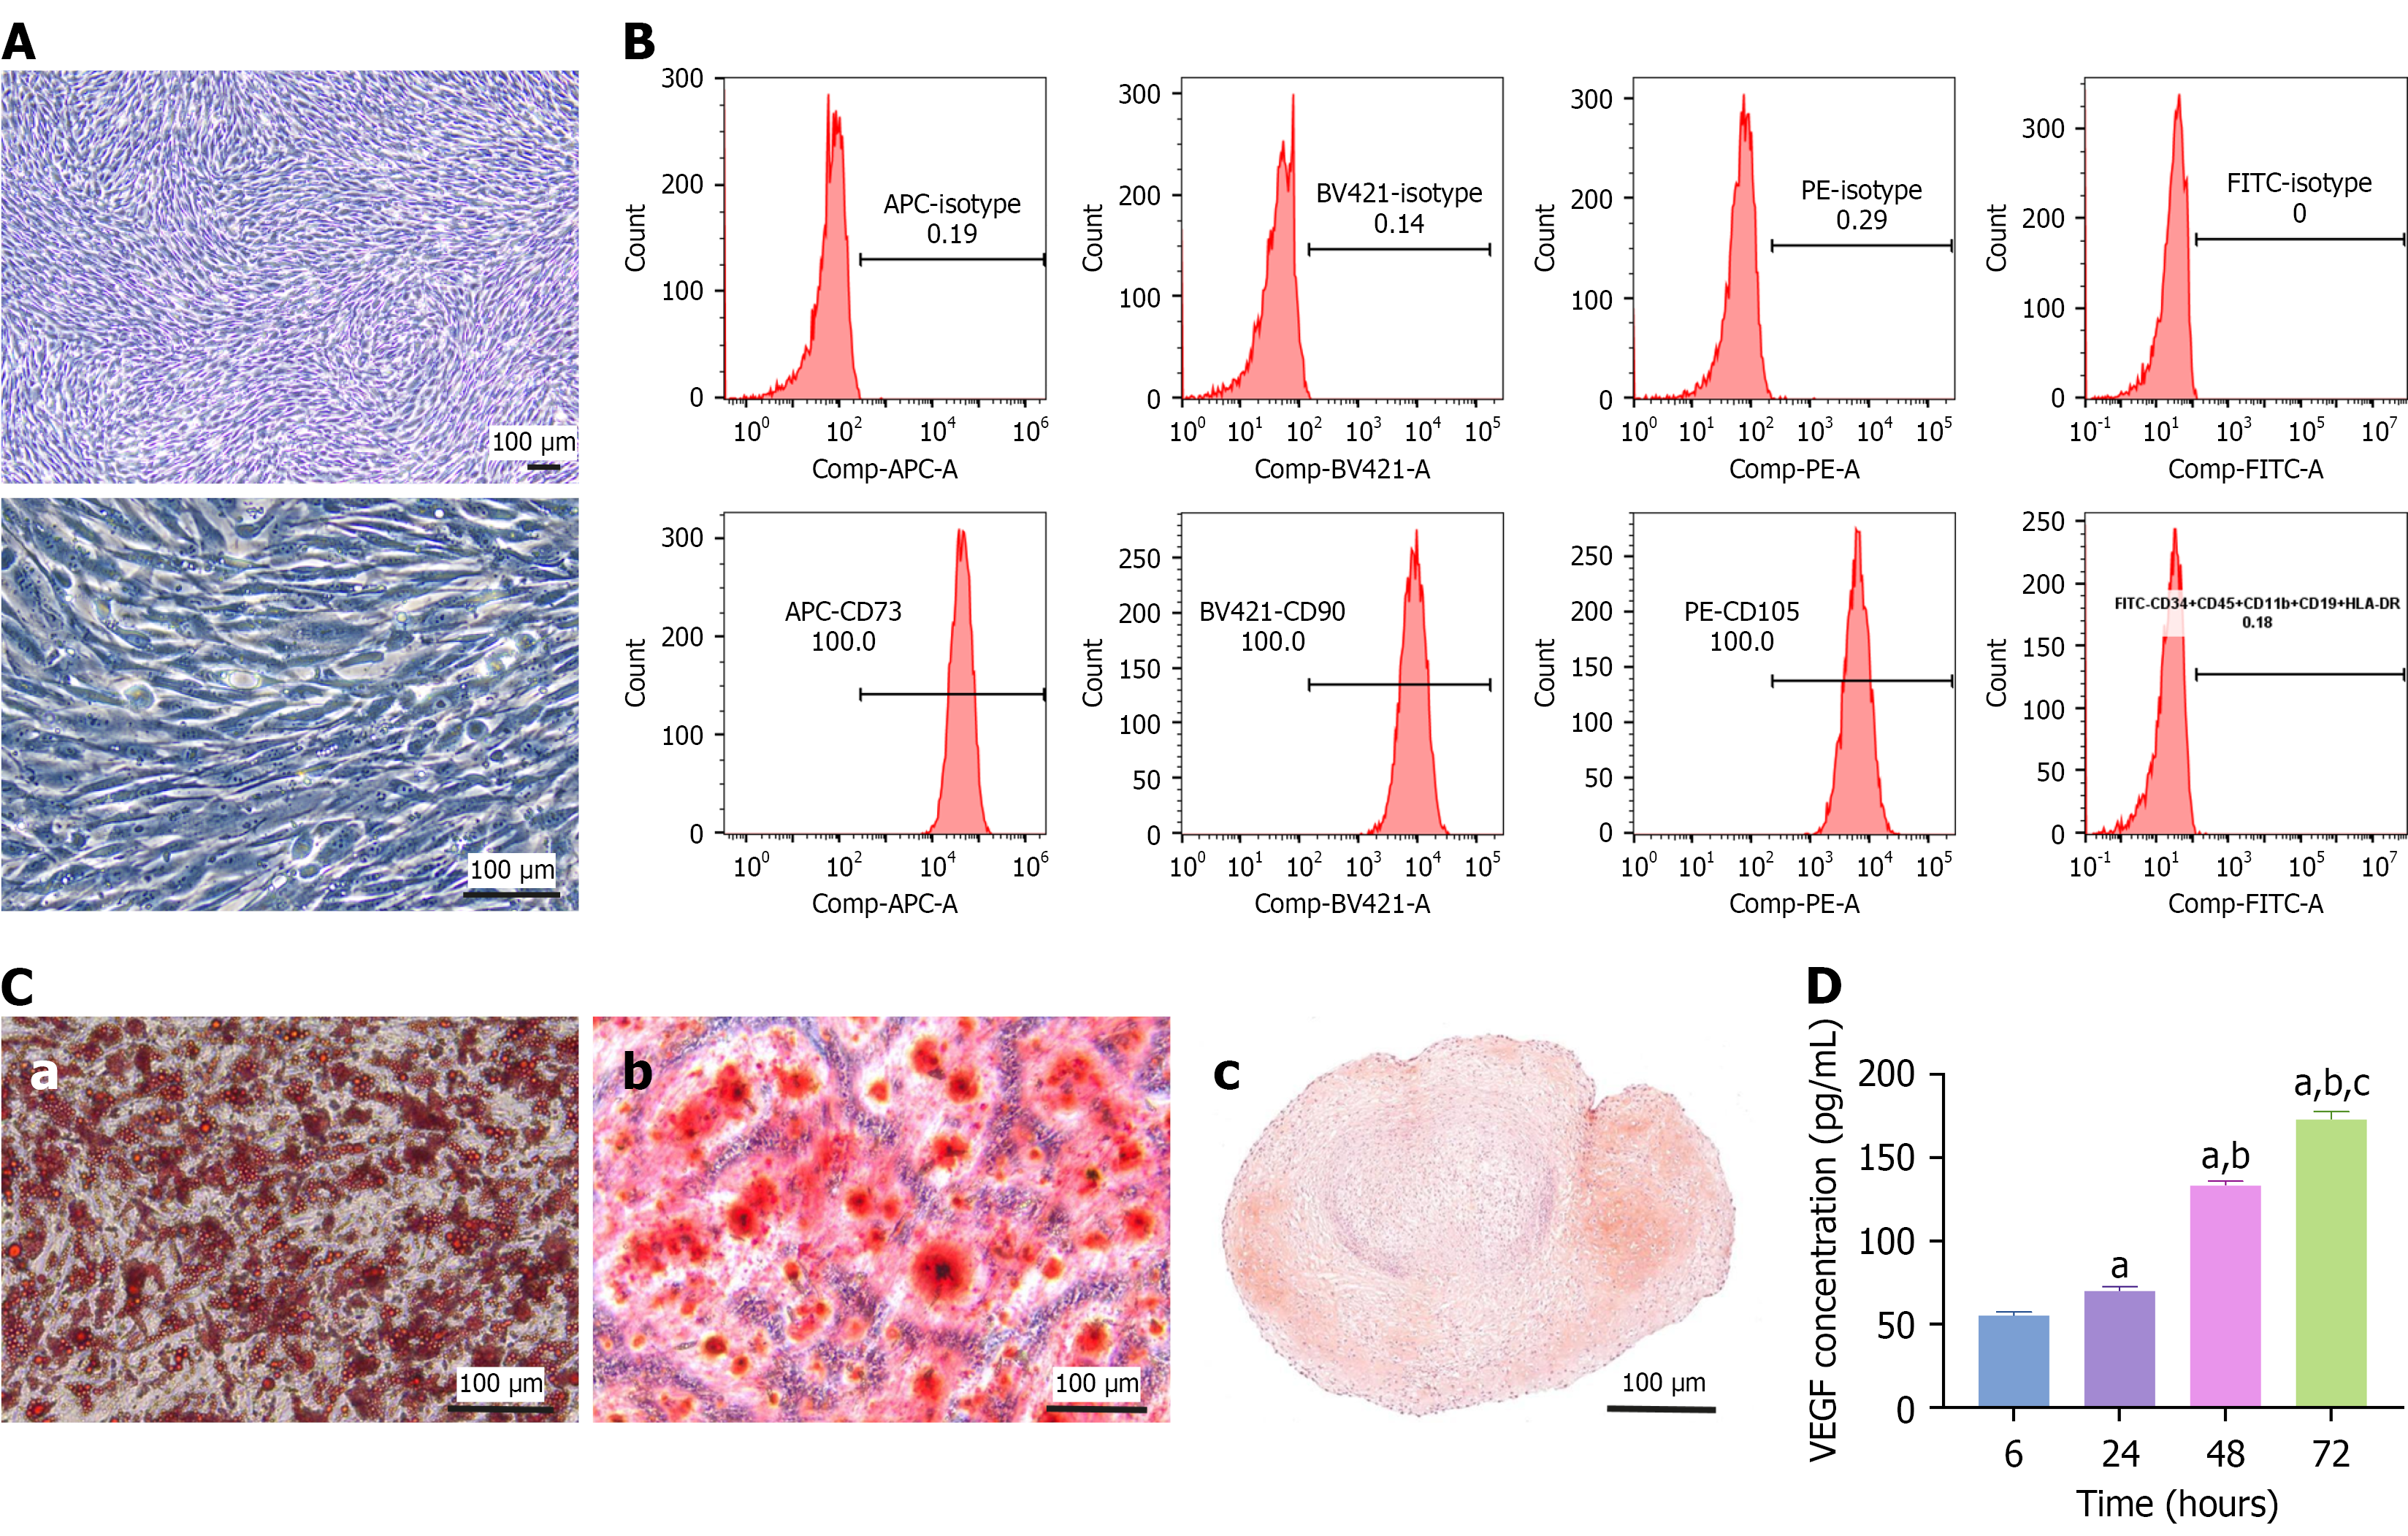
Figure 1 Characterization of adipose-derived mesenchymal stem cells.
A: Representative cell morphology images of adipose-derived mesenchymal stem cells (ADSCs) at 5 × and 20 ×; B: Flow cytometry indicated that CD73, CD105, and CD90 were highly expressed and that CD11b, CD19, CD34, CD45, and human leukocyte antigen-DR were negligibly expressed by ADSCs; C: Triplet differentiation assays revealed that ADSCs could differentiate into adipocytes (a), osteocytes (b), and chondrocytes (c), which were stained with Oil Red O, alizarin red, and safranin O, respectively; D: Enzyme-linked immunosorbent assay was used to measure the concentration of vascular endothelial growth factor secreted by ADSCs cultured for 6, 24, 48, and 72 hours. The data are presented as mean ± SD. Scale bar, 100 μm. Comp: Compensation; APC: Allophycocyanin; A: Area; BV421: Brilliant violet 421; PE: Phycoerythrin; FITC: Fluorescein isothiocyanate; HLA-DR: Human leukocyte antigen-DR; VEGF: Vascular endothelial growth factor. aP < 0.0001 vs 6 hours, bP < 0.0001 vs 24 hours, and cP < 0.0001 vs 48 hours.
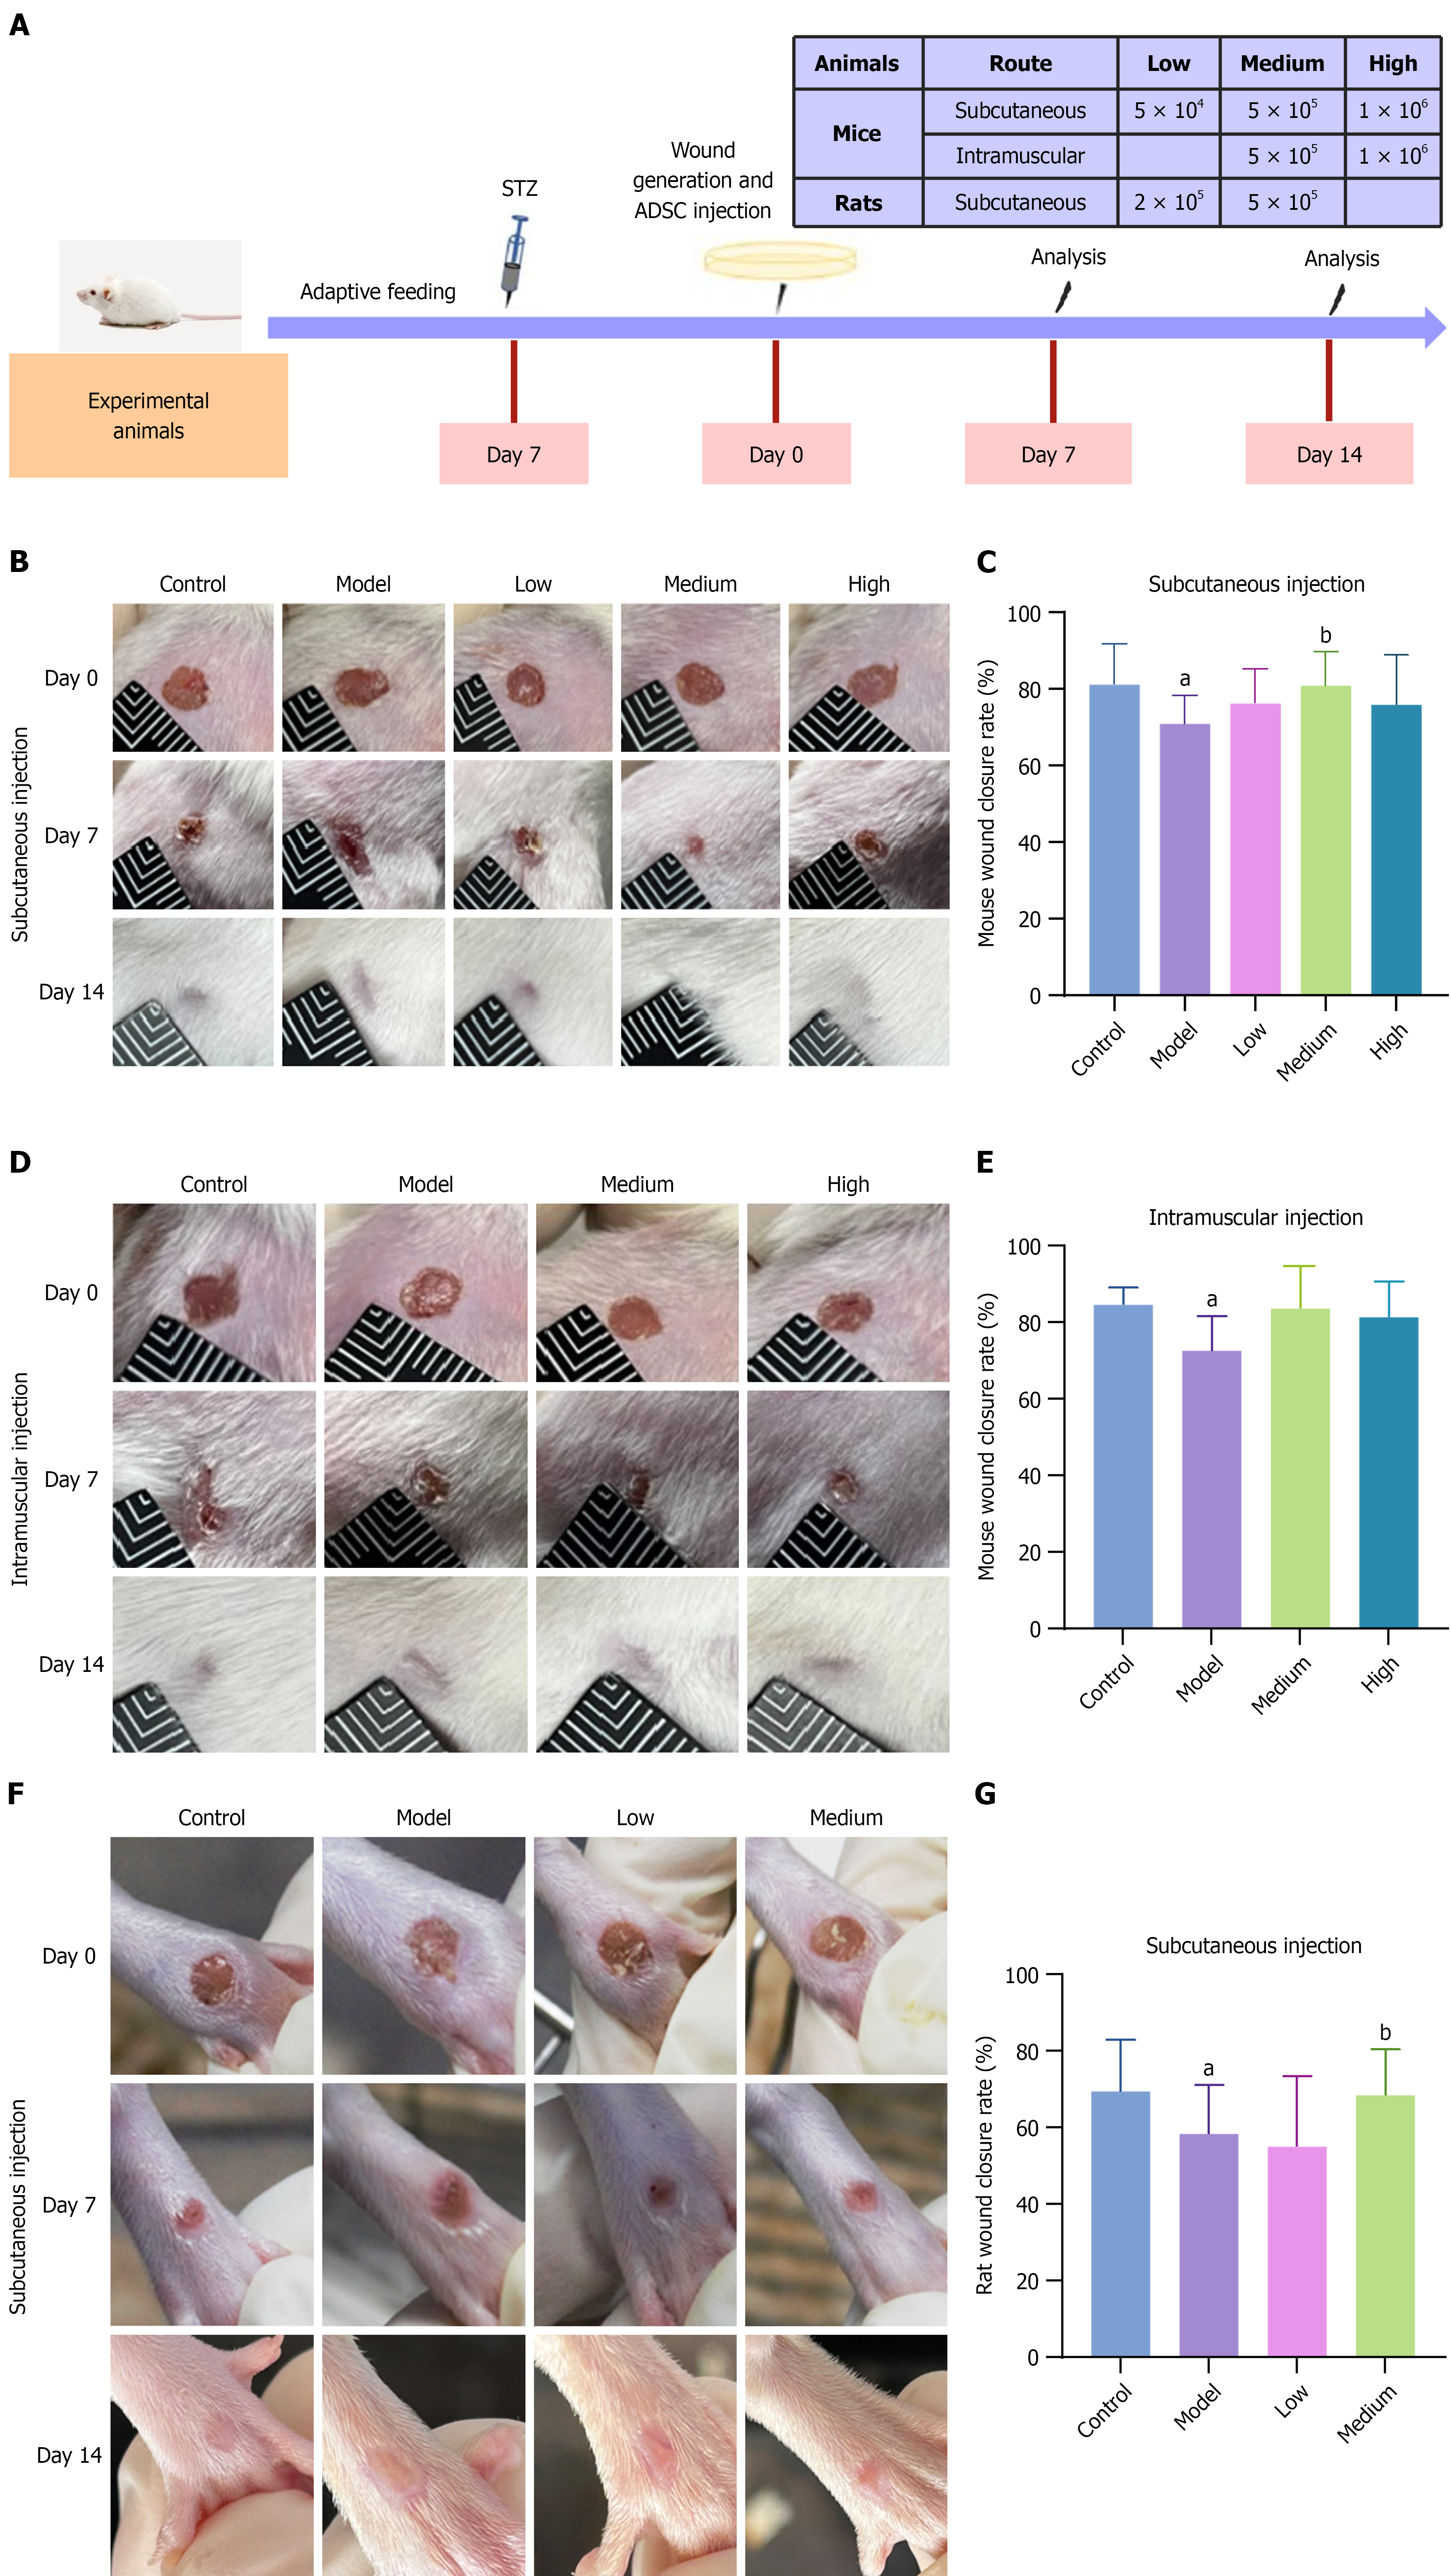
Figure 2 Wound closure in diabetic foot ulcer model mice and rats after treatment with adipose-derived mesenchymal stem cells.
A: Schematic diagram of the animal experiment; B: Representative images of ulcers in diabetic foot ulcer (DFU) mice on days 7 and 14 after subcutaneous injection of low, medium, or high doses of adipose-derived mesenchymal stem cells (ADSCs) or vehicle; C: Statistical bar chart of the wound closure rate in DFU mice on day 7 after subcutaneous injection. The wound healing rate in the medium-dose group was significantly greater than that in the model group (P < 0.05), n = 14; D: Representative images of ulcers in DFU mice on days 7 and 14 after intramuscular injection of medium and high ADSC doses; E: Statistical chart of the wound closure rate in DFU mice on day 7 after intramuscular injection, n = 7; F: Representative images of ulcers in DFU rats on days 7 and 14 after subcutaneous injection of low and medium ADSC doses; G: Statistical chart of the wound closure rate in DFU rats on day 7 after subcutaneous injection. The wound healing rate in the medium-dose group was significantly greater than that in the model group (P < 0.05), n = 14. The data are presented as mean ± SD. STZ: Streptozotocin; ADSC: Adipose-derived mesenchymal stem cell. aP < 0.05 vs control, and bP < 0.05 vs model.
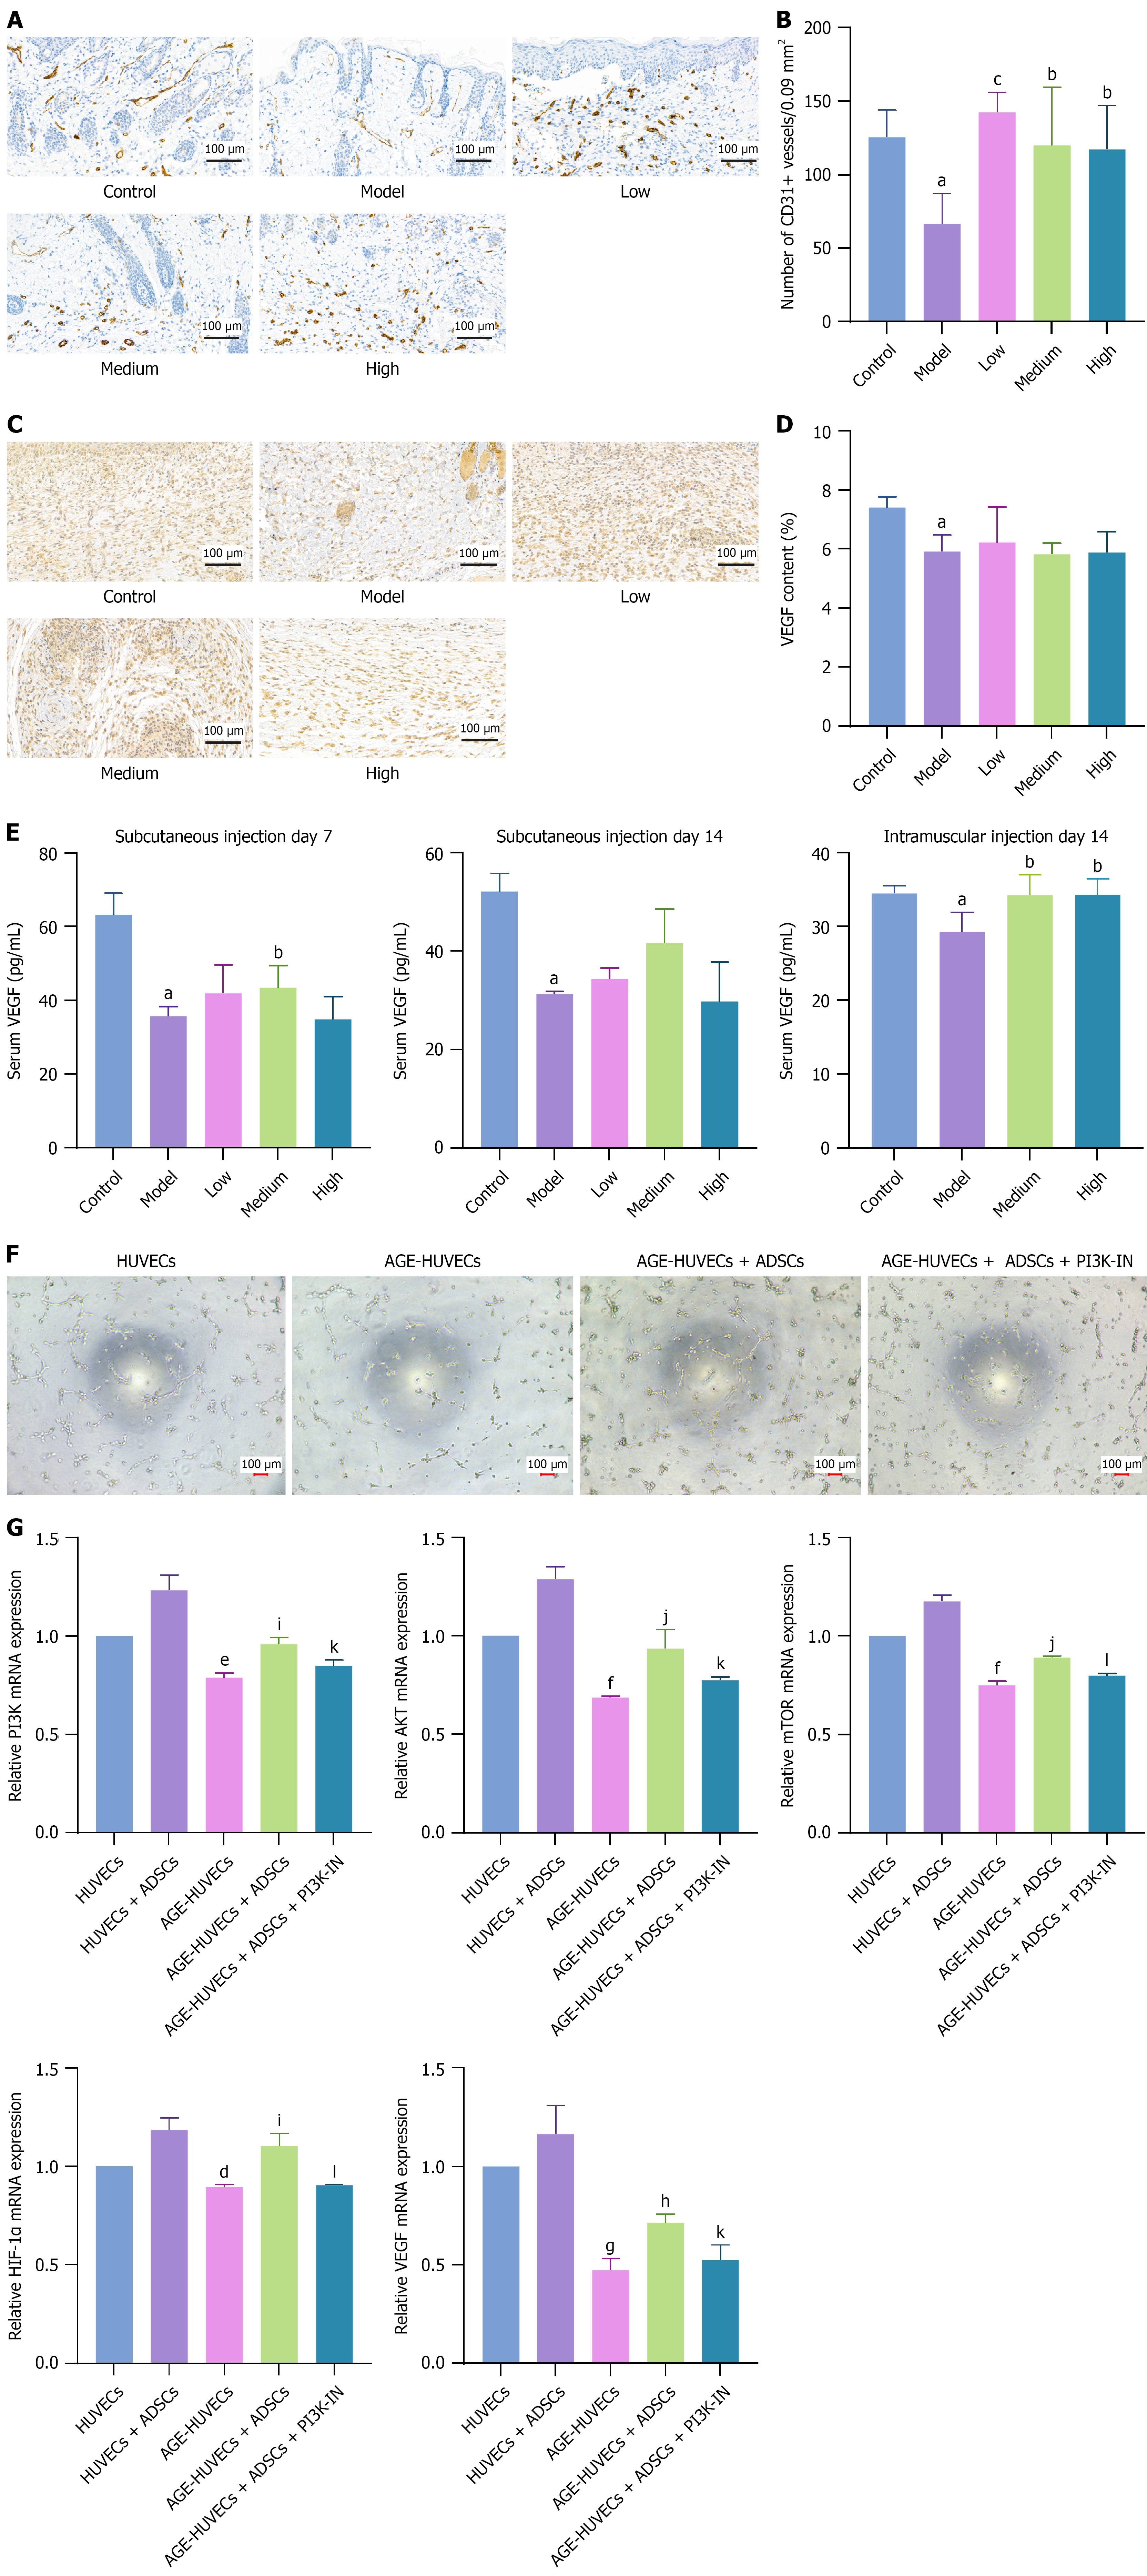
Figure 3 Effects of adipose-derived mesenchymal stem cells on angiogenesis in diabetic foot ulcers.
A: Immunohistochemical staining of CD31 in the wound beds of diabetic foot ulcer model mice on day 7 after subcutaneous adipose-derived mesenchymal stem cell (ADSC) administration; B: Quantification of blood vessels expressed as the number of CD31+ vessels in three random 0.3 cm × 0.3 cm fields, n = 5; C and D: Immunohistochemistry images and quantification of vascular endothelial growth factor (VEGF) by assessing integrated optical density, n = 5; E: Enzyme-linked immunosorbent assay was used to measure the serum VEGF concentration in diabetic foot ulcer model mice on days 7 and 14 after subcutaneous injection of ADSCs and on day 14 after intramuscular injection; F: A tube formation assay revealed that inhibition of the phosphatidylinositol 3-kinase signaling pathway impaired the proangiogenic effect of ADSCs in an advanced glycation end products (AGE) culture setting; G: Reverse transcription-quantitative polymerase chain reaction showed that ADSCs enhanced the phosphatidylinositol 3-kinase, protein kinase B, mammalian target of rapamycin, hypoxia-inducible factor-1α, and VEGF expression in human umbilical vein endothelial cells (HUVECs). AGE-HUVECs, HUVECs cultured in an AGE environment. The data are presented as mean ± SD. Scale bar, 100 μm. VEGF: Vascular endothelial growth factor; HUVEC: Human umbilical vein endothelial cell; ADSC: Adipose-derived mesenchymal stem cell; PI3K-IN: Phosphatidylinositol 3-kinase inhibitor; PI3K: Phosphatidylinositol 3-kinase; AKT: Protein kinase B; mTOR: Mammalian target of rapamycin; HIF-1α: Hypoxia-inducible factor-1α. aP < 0.05 vs control, bP < 0.05 vs model, cP < 0.01 vs model, dP < 0.05 vs human umbilical vein endothelial cells, eP < 0.01 vs human umbilical vein endothelial cells, fP < 0.001 vs human umbilical vein endothelial cells, gP < 0.0001 vs human umbilical vein endothelial cells, hP < 0.05 vs advanced glycation end products-human umbilical vein endothelial cells, iP < 0.01 vs advanced glycation end products-human umbilical vein endothelial cells, jP < 0.001 vs advanced glycation end products-human umbilical vein endothelial cells, kP < 0.05 vs advanced glycation end products-human umbilical vein endothelial cells + adipose-derived mesenchymal stem cells, and lP < 0.01 vs advanced glycation end products-human umbilical vein endothelial cells + adipose-derived mesenchymal stem cells.
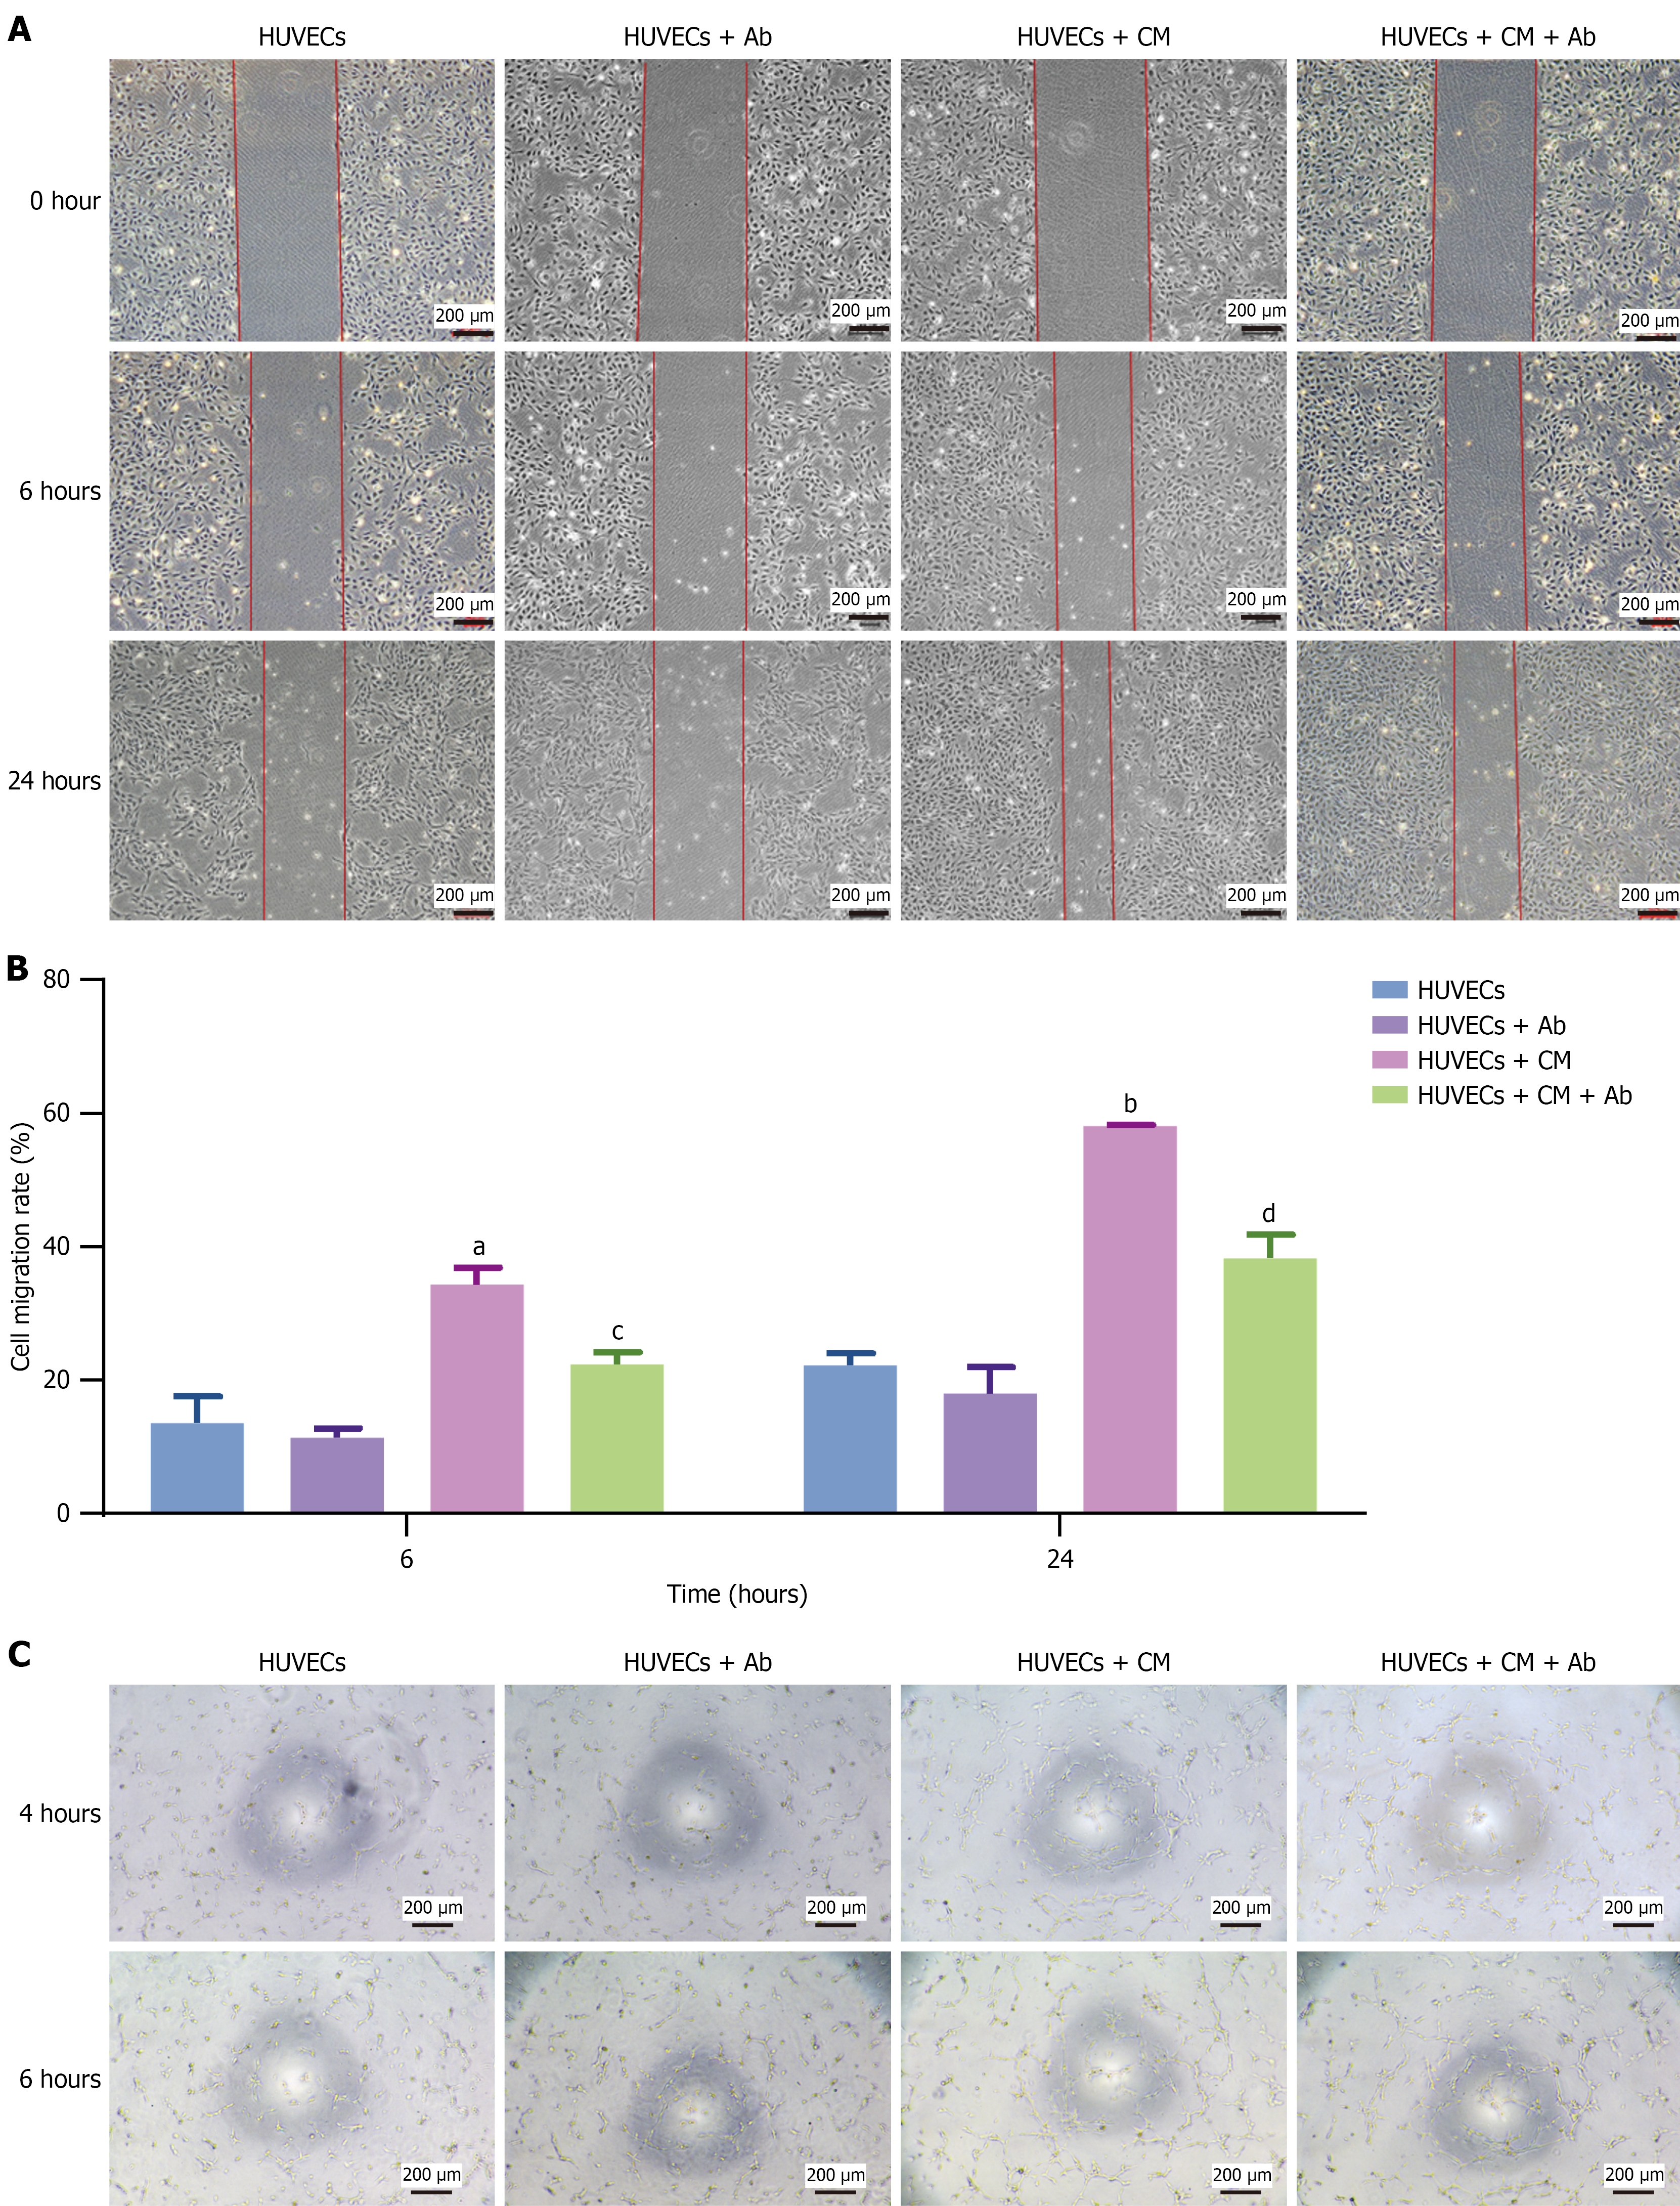
Figure 4 Effects of vascular endothelial growth factor on angiogenesis.
A: Wound healing assay demonstrated that conditioned medium (CM) promoted human umbilical vein endothelial cell migration, while a vascular endothelial growth factor-neutralizing antibody attenuated the promigratory effects of CM; B: Statistical bar chart of the cell migration rate at 6 and 24 hours after scratching; C: A tube formation assay showed that CM promoted angiogenesis, while antibody attenuated the proangiogenic effects of CM. The data are presented as mean ± SD. Scale bar, 200 μm. HUVECs: Human umbilical vein endothelial cells; Ab: Antibody; CM: Conditioned medium. aP < 0.01 vs human umbilical vein endothelial cells, bP < 0.0001 vs human umbilical vein endothelial cells, cP < 0.01 vs human umbilical vein endothelial cells + conditioned medium, and dP < 0.001 vs human umbilical vein endothelial cells + conditioned medium.
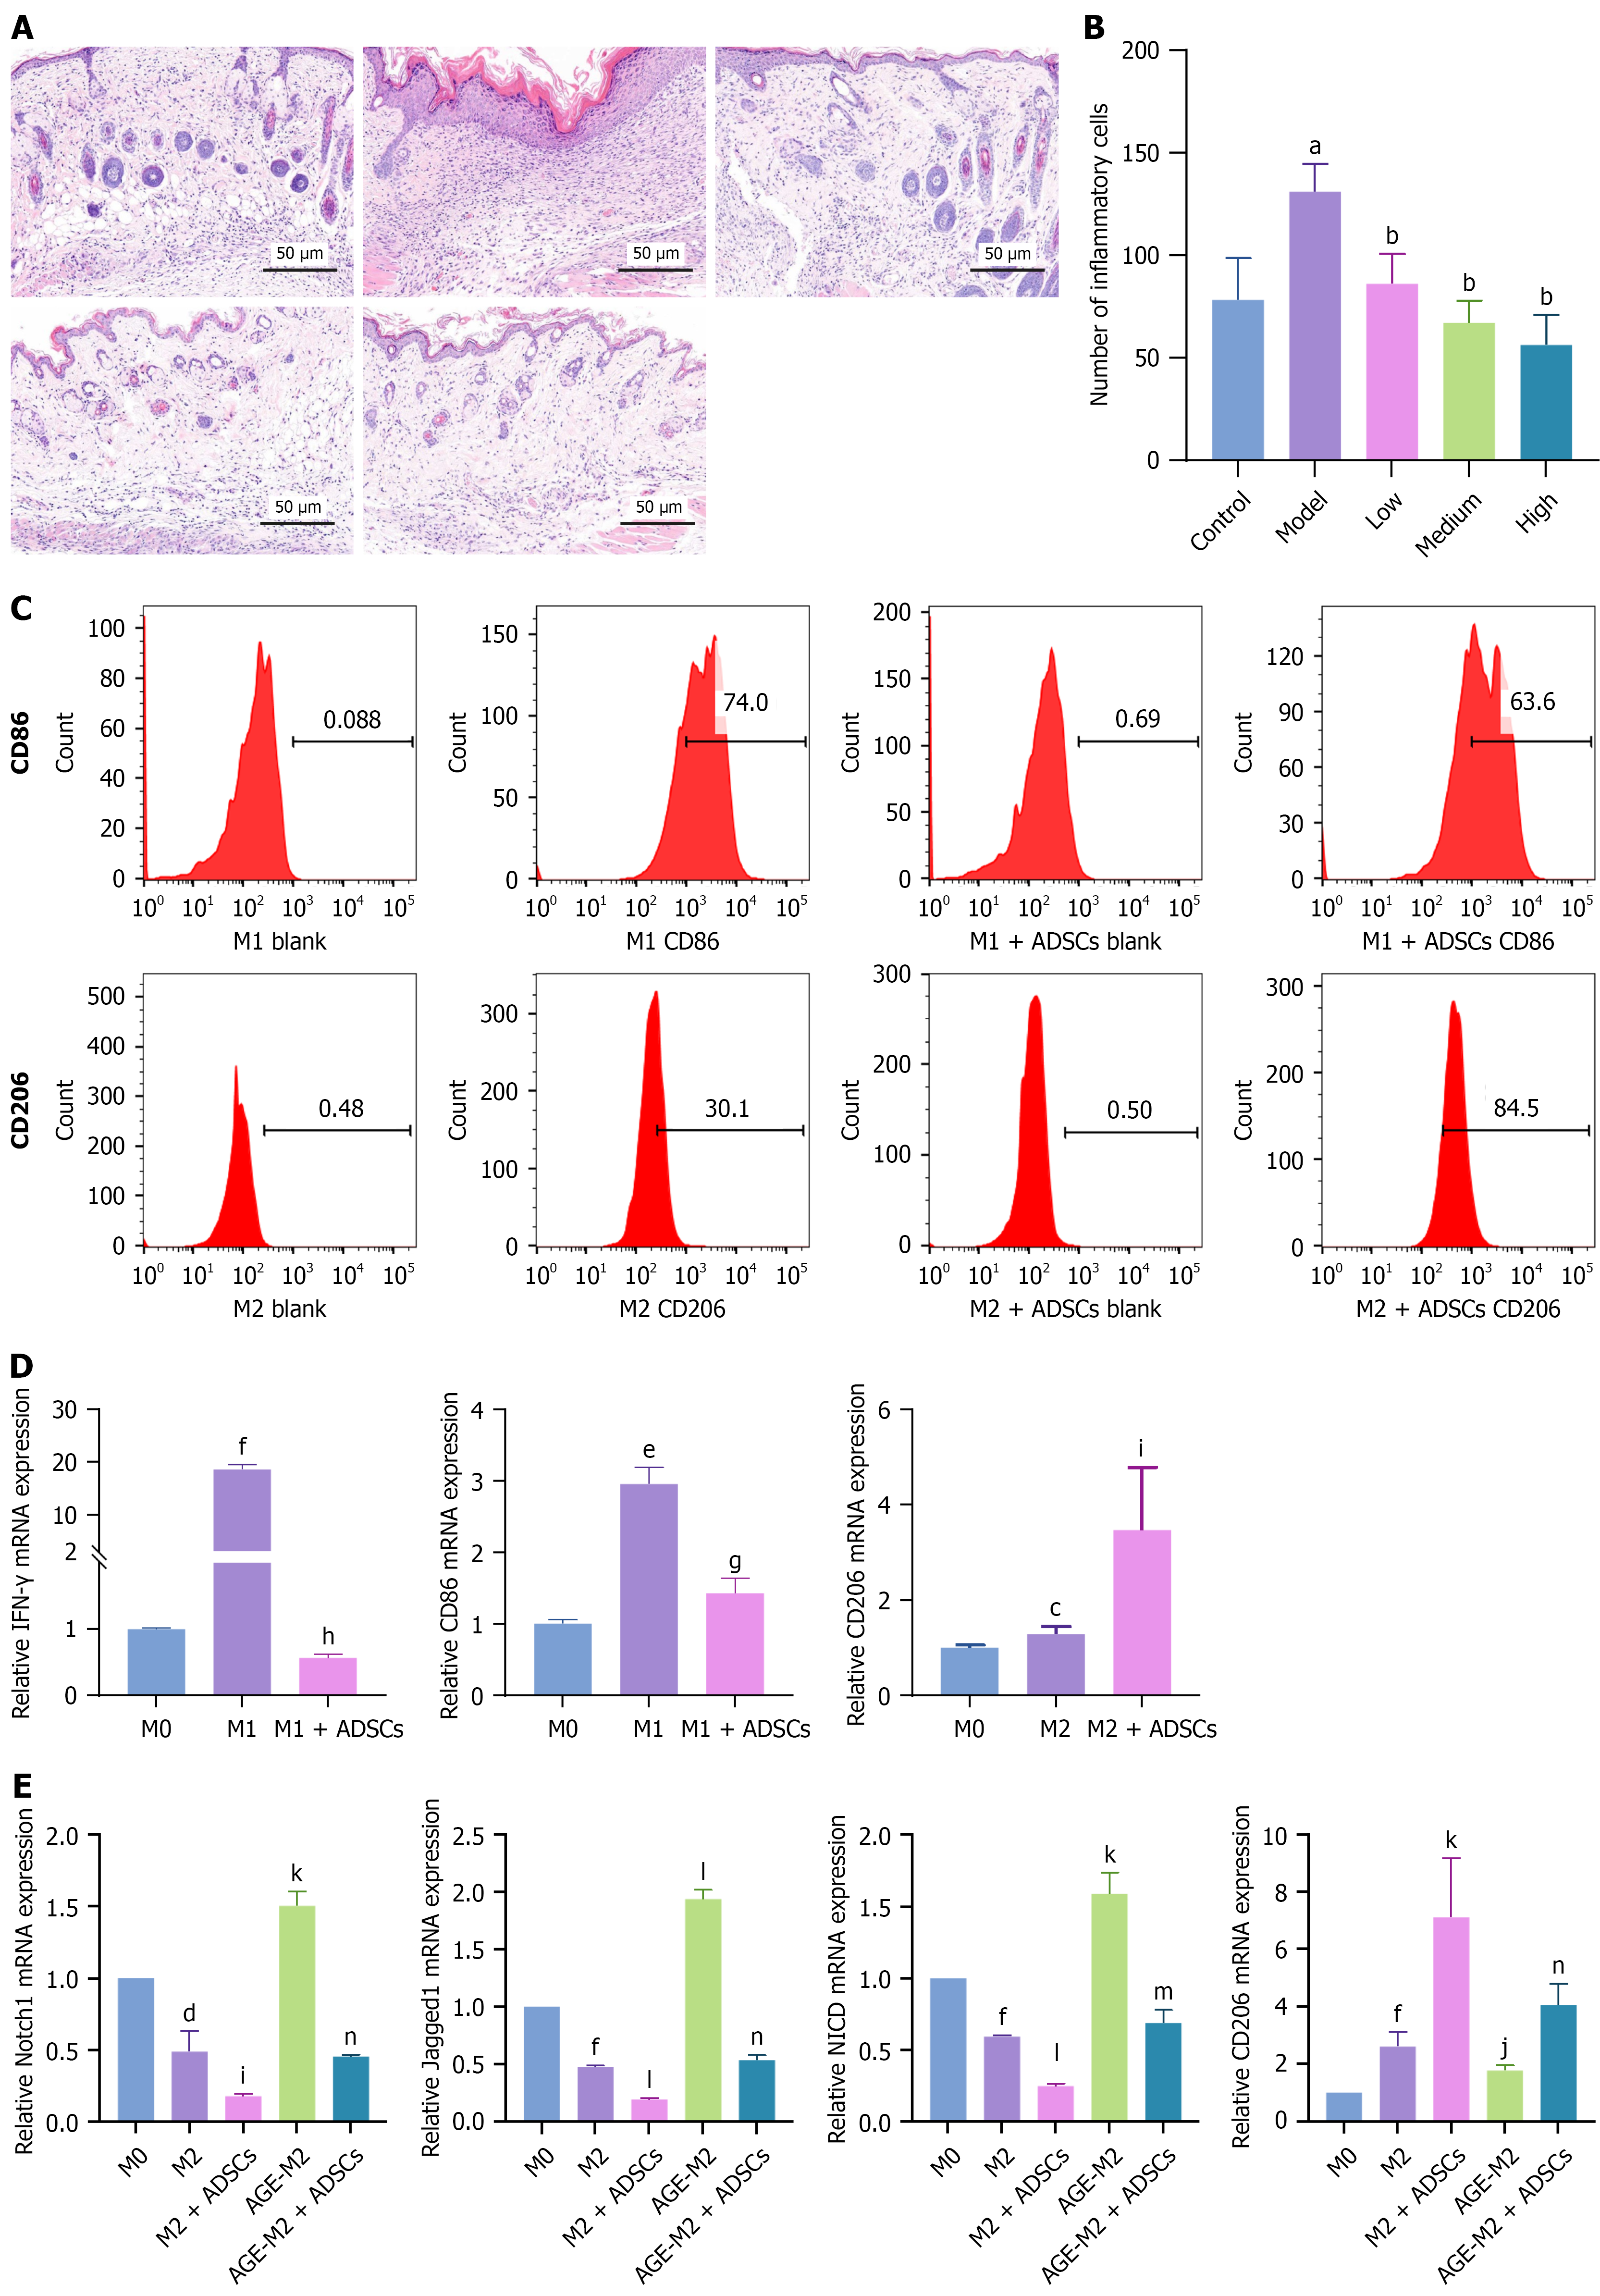
Figure 5 Immunomodulation of adipose-derived mesenchymal stem cells in diabetic foot ulcer mouse model and THP-1-derived macrophages.
A and B: Hematoxylin and eosin staining revealed a significant decrease in inflammatory infiltrating cells on day 7 after subcutaneous adipose-derived mesenchymal stem cell (ADSC) administration to the mice, n = 7; C: Flow cytometry revealed that coculture with ADSCs reduced the proportion of CD86-positive M1 macrophages and increased the proportion of CD206-positive M2 macrophages; D: Reverse transcription-quantitative polymerase chain reaction demonstrated that ADSCs promoted CD206 expression while inhibiting CD86 and interferon-γ gene expression; E: Reverse transcription-quantitative polymerase chain reaction showed that advanced glycation end products treatment led to Notch1, Jagged1, and Notch intracellular domain overexpression while inhibiting CD206 expression. However, ADSCs adjusted the excessive activation of key genes in the Notch1 signaling pathway and restored CD206 expression. M1 and M2 represent M0 cells stimulated with M1 or M2 polarization factors, respectively. M1 blank indicates M1 cells incubated with the isotype antibody. M1 CD86 represents M1 cells that were incubated with the anti-CD86 antibody. M1 + ADSCs CD86 indicates M1 cells cocultured with ADSCs and then incubated with an anti-CD86 antibody. The grouping method for M2 is the same as that for M1. The data are presented as mean ± SD. Scale bar, 50 μm. ADSC: Adipose-derived mesenchymal stem cell; IFN-γ: Interferon; AGE: Advanced glycation end products; NICD: Notch intracellular domain. aP < 0.0001 vs control, bP < 0.0001 vs model, cP < 0.05 vs M0, dP < 0.01 vs M0, eP < 0.001 vs M0, fP < 0.0001 vs M0, gP < 0.01 vs M1, hP < 0.0001 vs M1, iP < 0.05 vs M2, jP < 0.01 vs M2, kP < 0.001 vs M2, lP < 0.0001 vs M2, mP < 0.001 vs advanced glycation end products-M2, and nP < 0.0001 vs advanced glycation end products-M2.
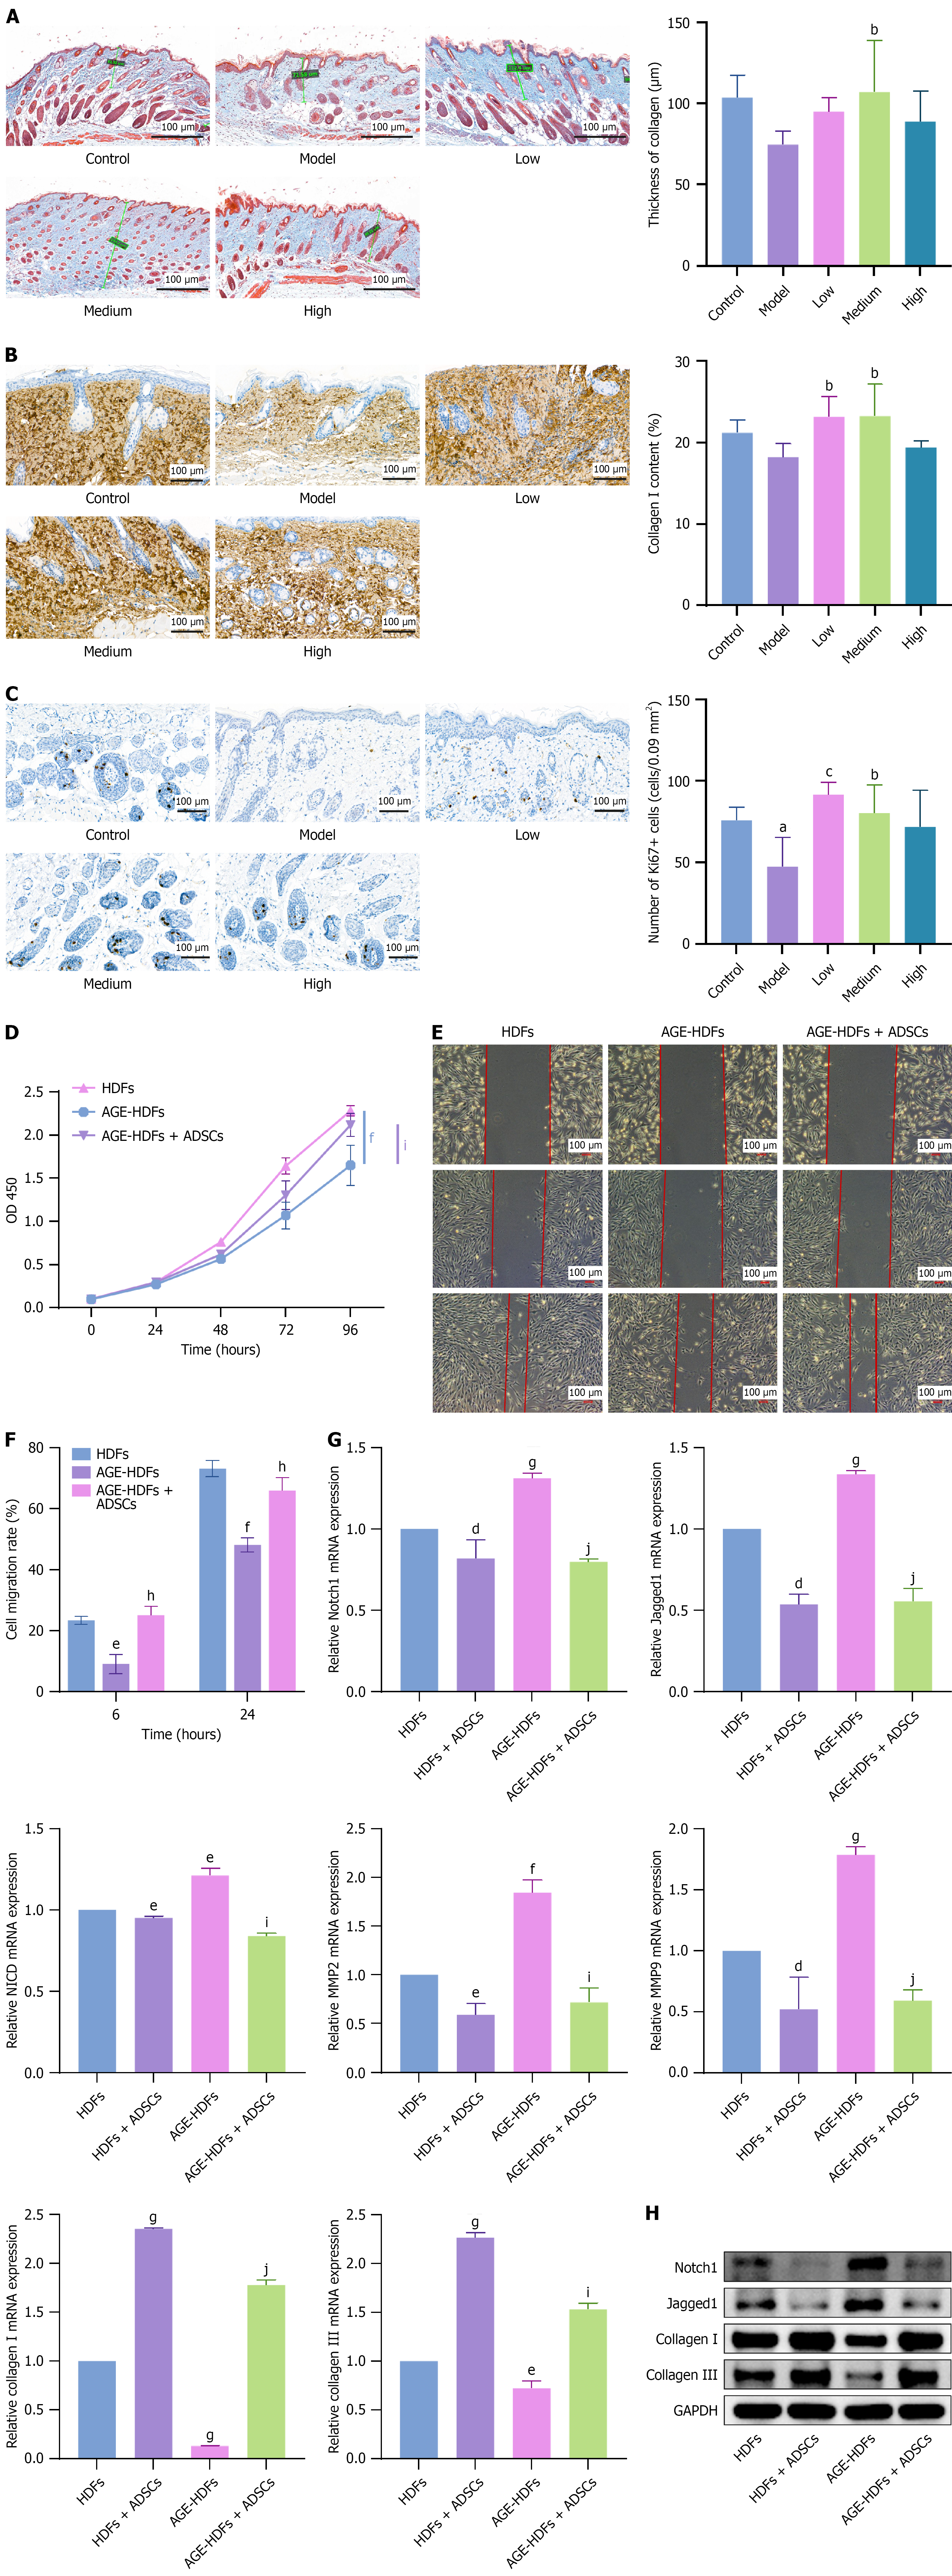
Figure 6 Effects of adipose-derived mesenchymal stem cells on tissue regeneration.
A: Masson’s trichrome staining showed increased collagen deposition in the dermis of mice on day 7 after subcutaneous adipose-derived mesenchymal stem cell (ADSC) injection, with the most significant effect observed in the medium-dose group, n = 7; B and C: Immunohistochemical staining of collagen I and Ki67 in the wound beds of diabetic foot ulcers model mice on day 7 after subcutaneous ADSC administration, n = 5; D: Exposure to advanced glycation end products (AGE) inhibited human dermal fibroblast (HDF) proliferation, and ADSCs reversed this inhibitory effect; E and F: AGE inhibited HDF migration, and ADSCs reversed this inhibitory effect; G and H: Reverse transcription-quantitative polymerase chain reaction and western blot analysis demonstrated that in an AGE environment, HDFs overexpressed key genes of the Notch signaling pathway, namely Notch1, Jagged1, and Notch intracellular domain, as well as matrix metalloproteinase-2 and matrix metalloproteinase-9, while collagen I and III were downregulated. However, coculture with ADSCs inhibited Notch1, Jagged1, Notch intracellular domain, matrix metalloproteinase-2, and matrix metalloproteinase-9 expression and restored collagen I and III expression. The data are presented as mean ± SD. Scale bar, 100 μm. HDFs: Human dermal fibroblasts; AGE: Advanced glycation end products; ADSCs: Adipose-derived mesenchymal stem cell; OD: Optical density; NICD: Notch intracellular domain; MMP2: Matrix metalloproteinase-2; MMP9: Matrix metalloproteinase-9; GAPDH: Glyceraldehyde 3-phosphate dehydrogenase. aP < 0.05 vs control, bP < 0.05 vs model, cP < 0.01 vs model, dP < 0.05 vs human dermal fibroblasts, eP < 0.01 vs human dermal fibroblasts, fP < 0.001 vs human dermal fibroblasts, gP < 0.0001 vs human dermal fibroblasts, hP < 0.01 advanced glycation end products-human dermal fibroblasts, iP < 0.001 advanced glycation end products-human dermal fibroblasts, and jP < 0.0001 vs advanced glycation end products-human dermal fibroblasts.
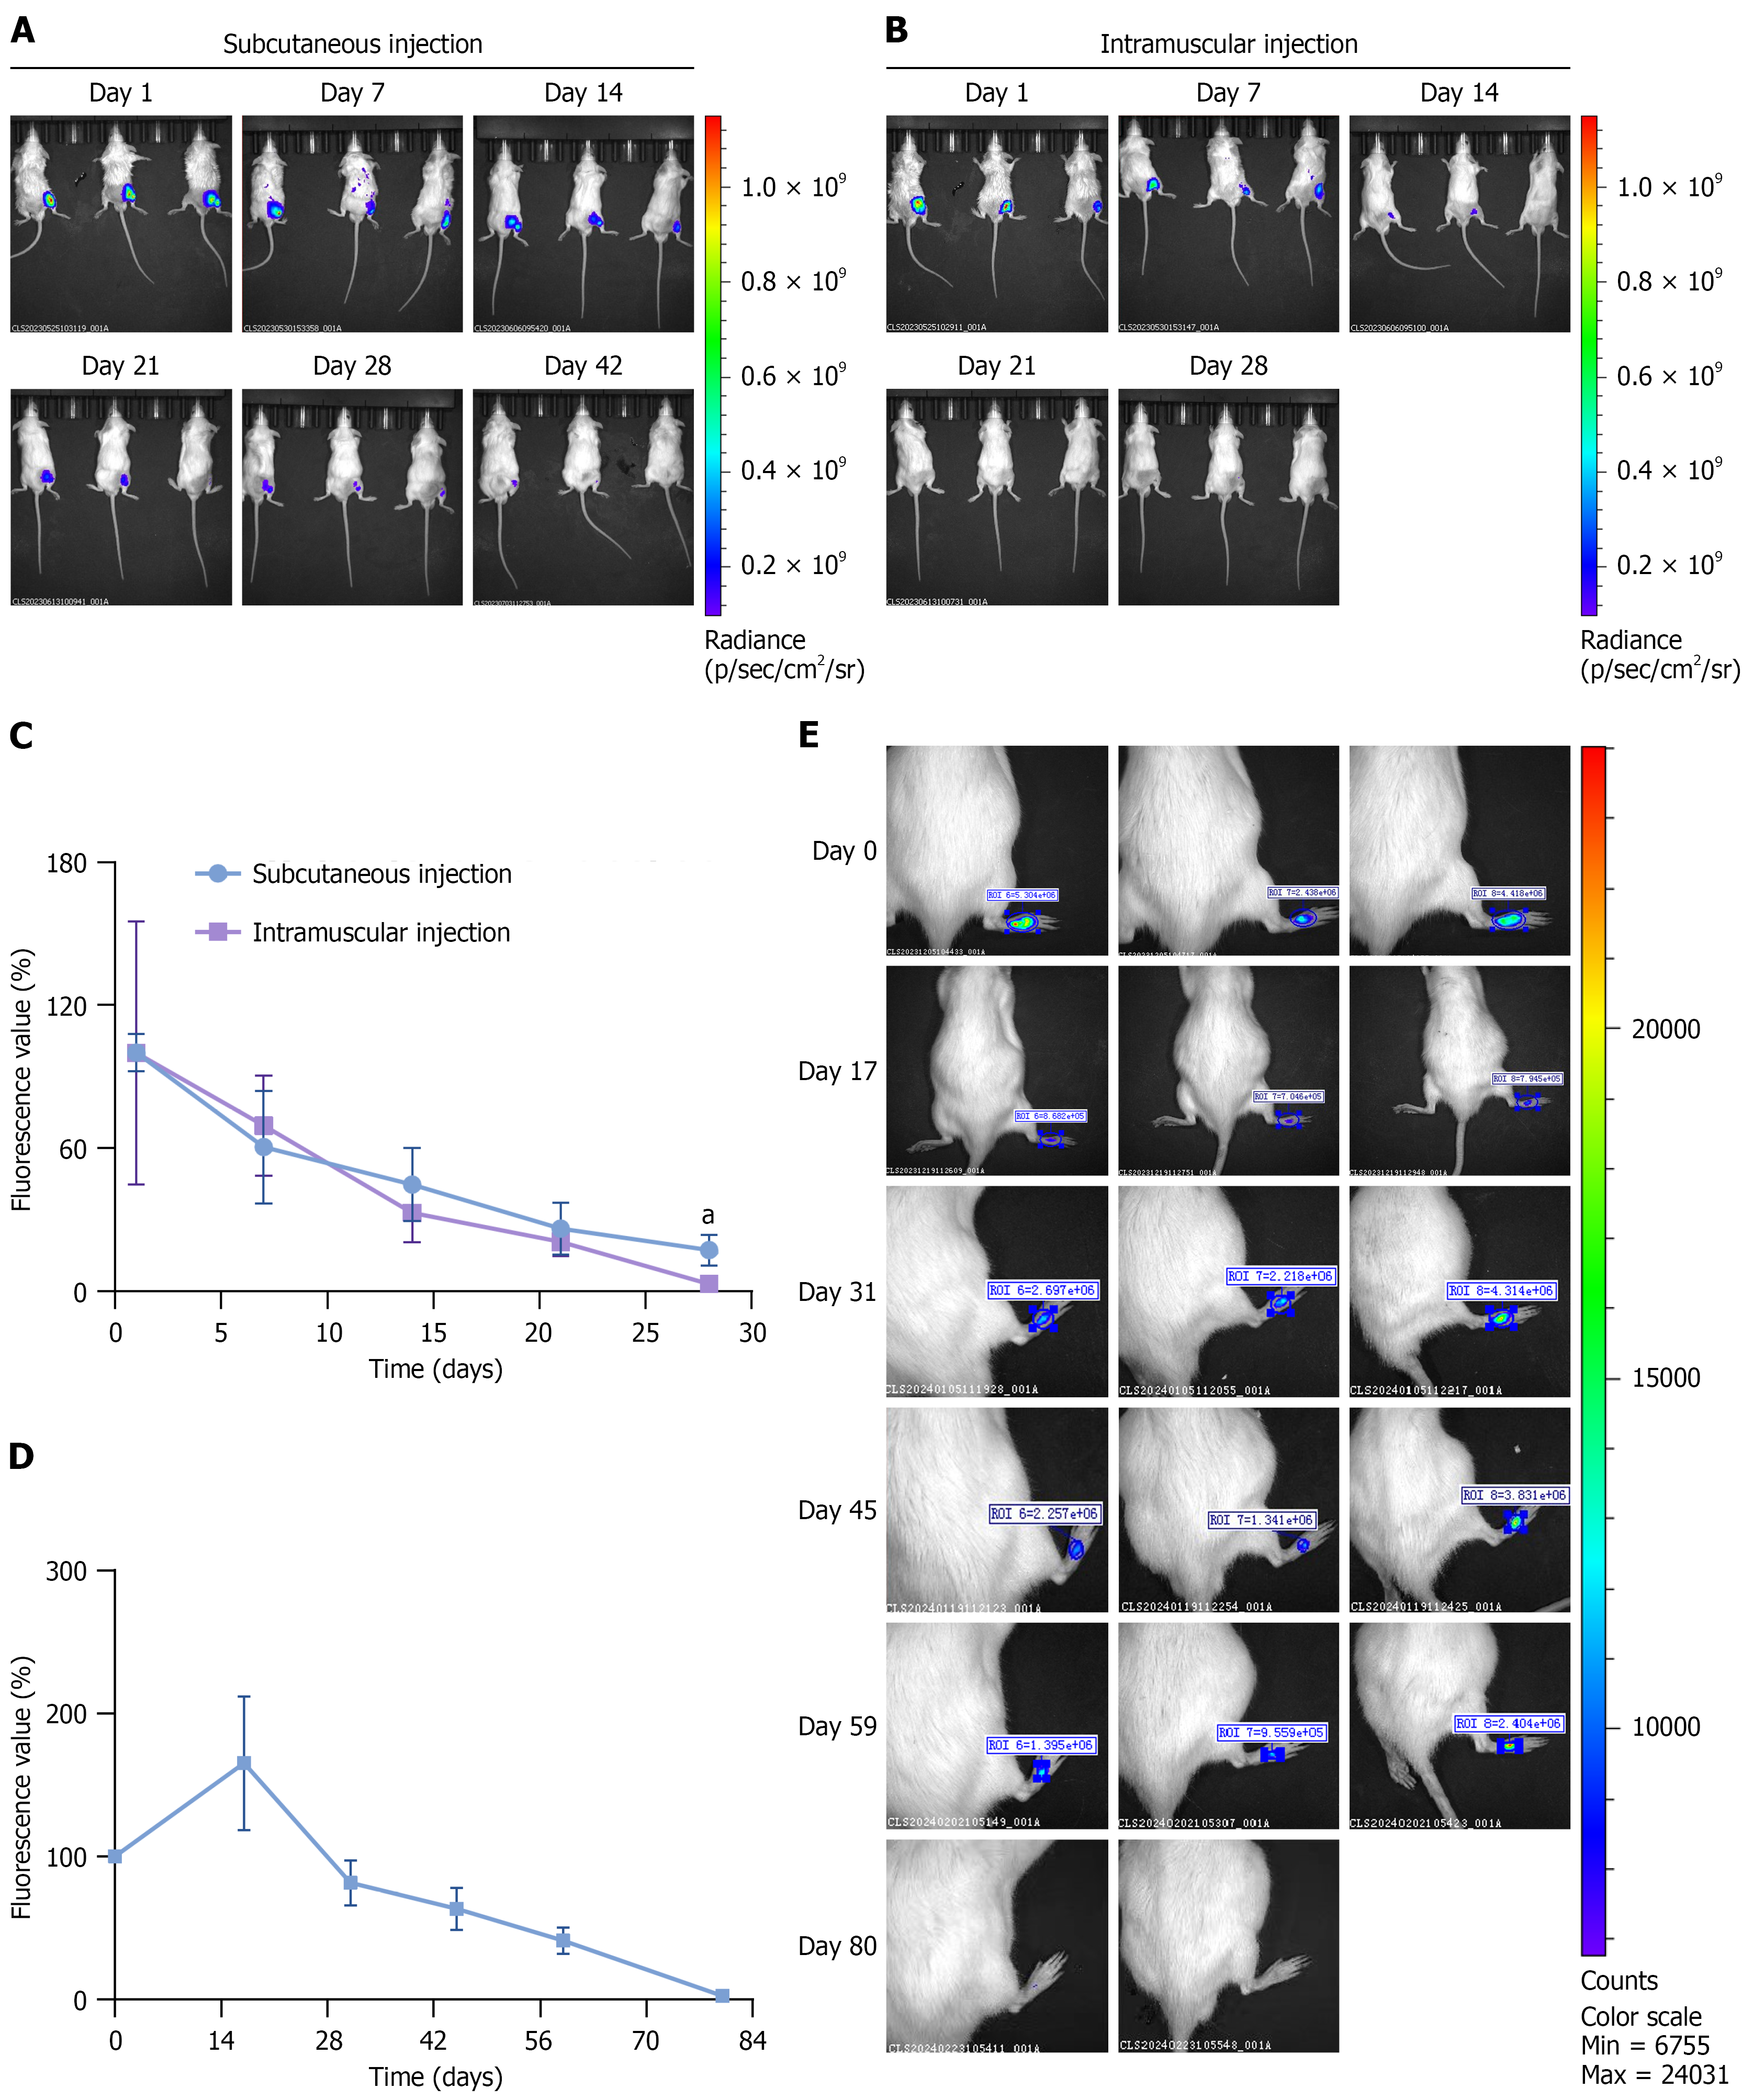
Figure 7 Fate of adipose-derived mesenchymal stem cells after transplantation in diabetic foot ulcer models.
Adipose-derived mesenchymal stem cells (ADSCs) were labeled with 1,1′-dioctadecyl-3,3,3′,3′-tetramethylindodicarbocyanine perchlorate (DiD) and detected by an in vivo imaging system. A and B: Images of DiD-labeled ADSCs after subcutaneous or intramuscular injection on the dorsal side of the hindleg in diabetic foot ulcer model mice; C: The fluorescence intensity of DiD in DiD-labeled ADSCs gradually decreased during the four weeks after transplantation, n = 3; D: Fluorescence intensity of DiD in DiD-labeled ADSCs at various time points, n = 3; E: Images of DiD-labeled ADSCs after subcutaneous injection on the right hindfoot in the diabetic foot ulcers model rats at different time points. The data are presented as mean ± SD. aP < 0.05 vs intramuscular injection.
- Citation: Cao J, Liu ZC, An WQ, Zhang S, Zhang X, Li LJ, Ji HL, Long X, Yang YM. Optimizing adipose-derived stem cell therapy for diabetic foot ulcers. World J Diabetes 2025; 16(11): 109859
- URL: https://www.wjgnet.com/1948-9358/full/v16/i11/109859.htm
- DOI: https://dx.doi.org/10.4239/wjd.v16.i11.109859


