©The Author(s) 2025.
World J Diabetes. Oct 15, 2025; 16(10): 111230
Published online Oct 15, 2025. doi: 10.4239/wjd.v16.i10.111230
Published online Oct 15, 2025. doi: 10.4239/wjd.v16.i10.111230
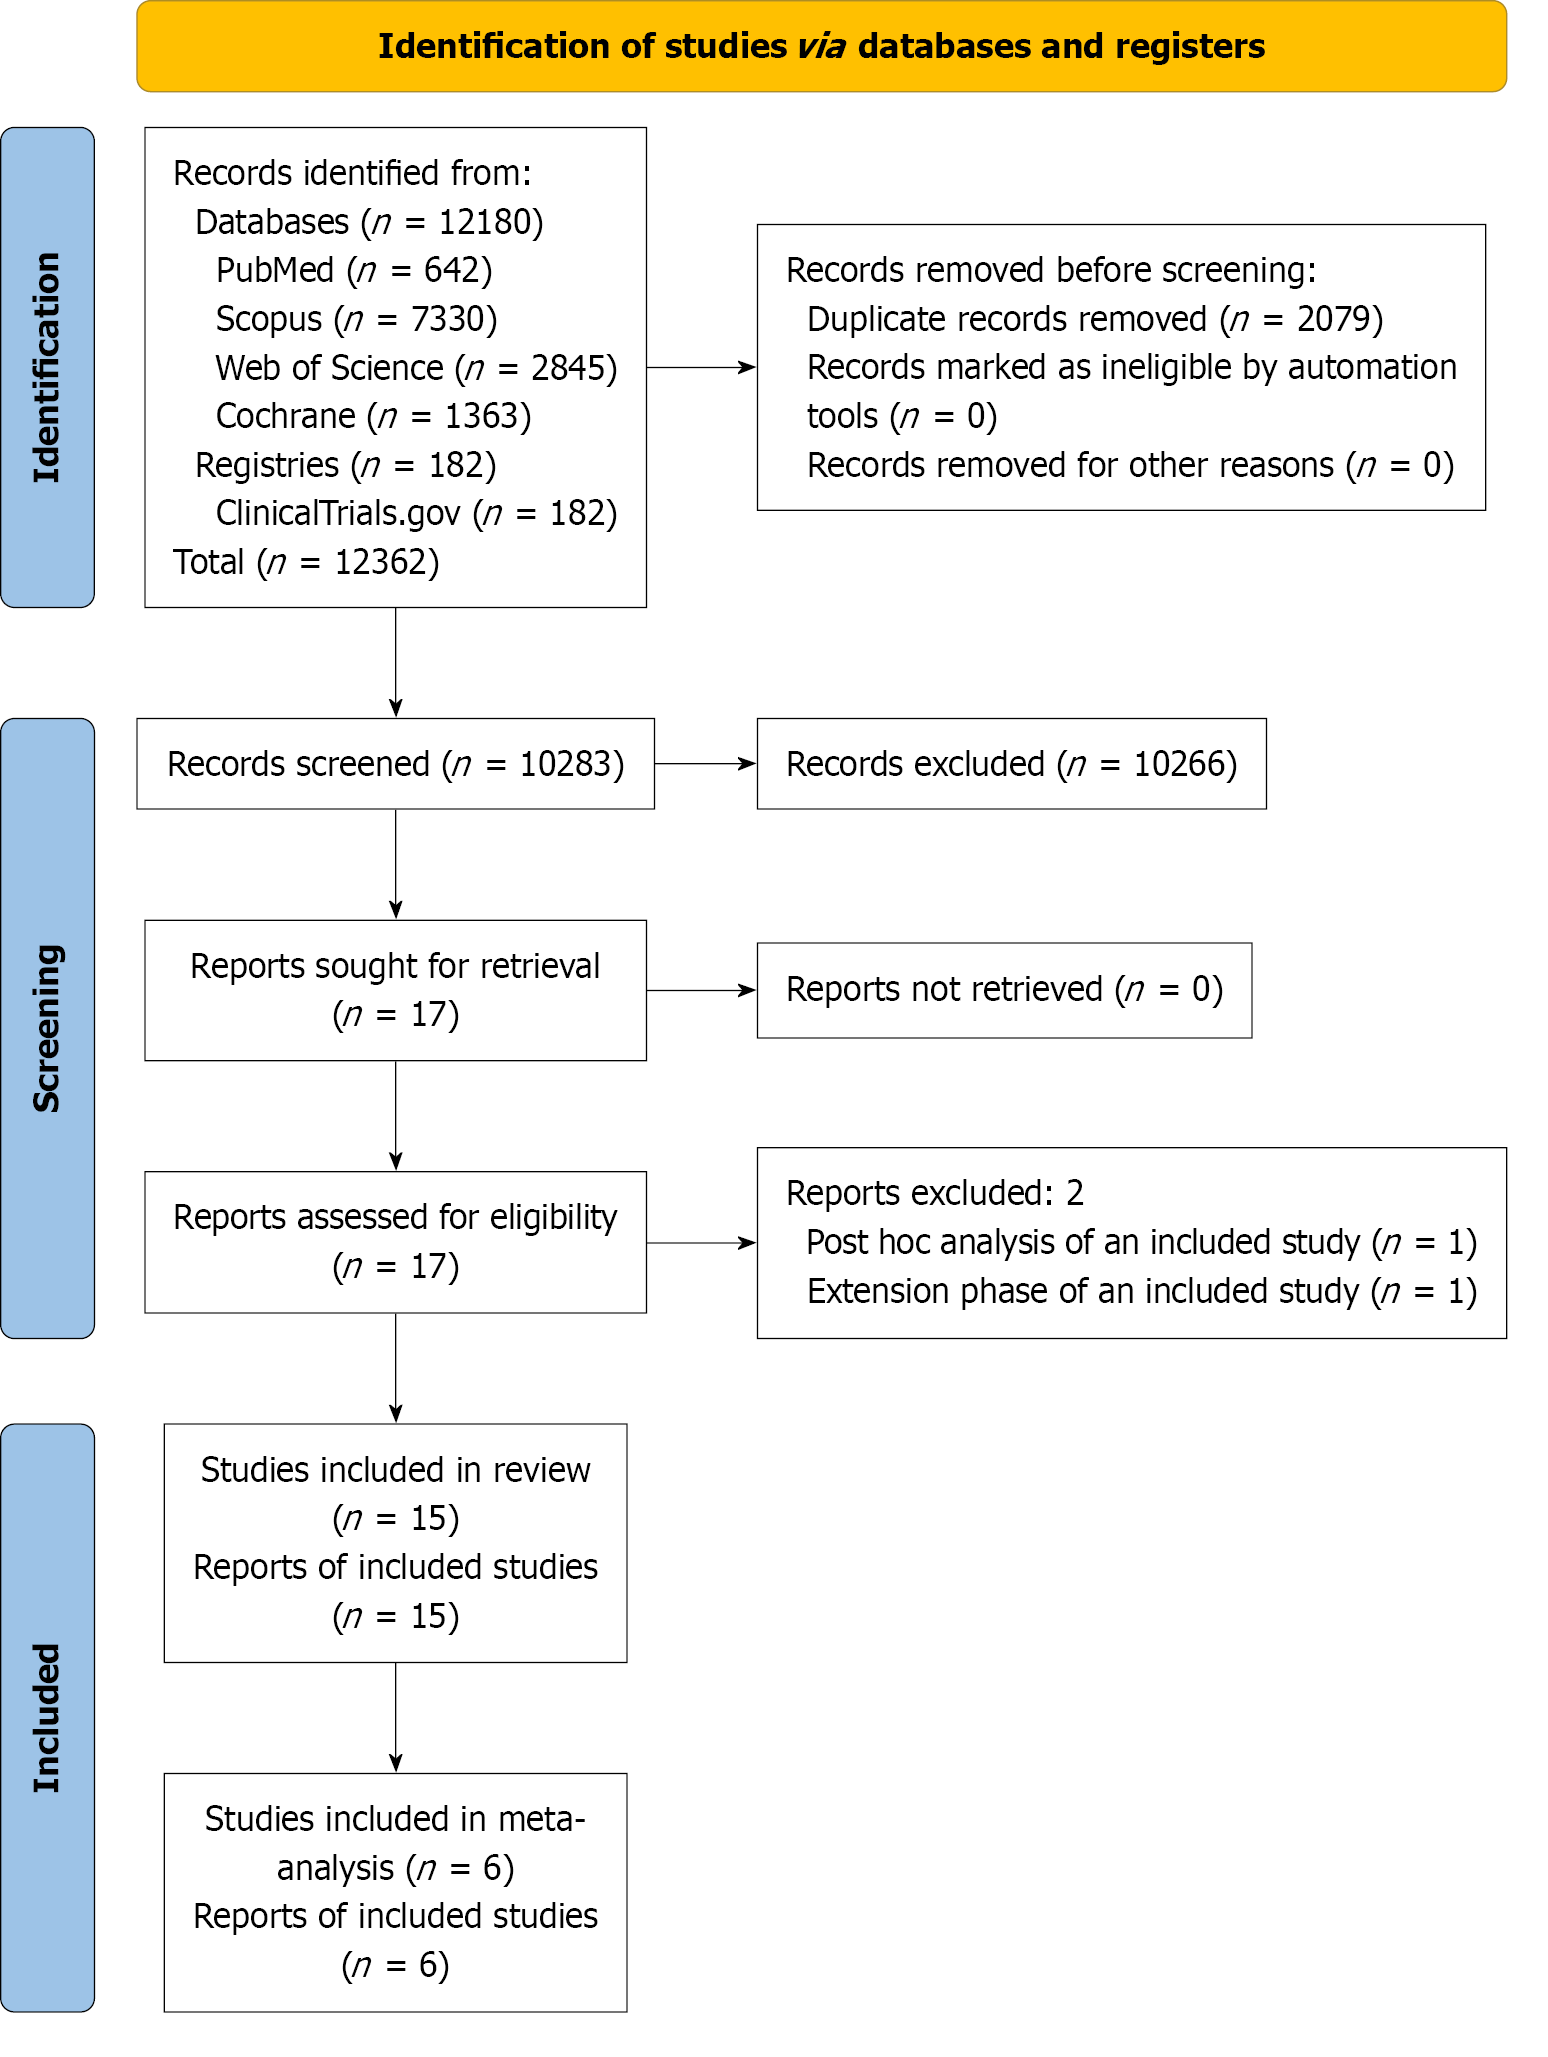
Figure 1
Flowchart on study retrieval and inclusion in the meta-analysis.
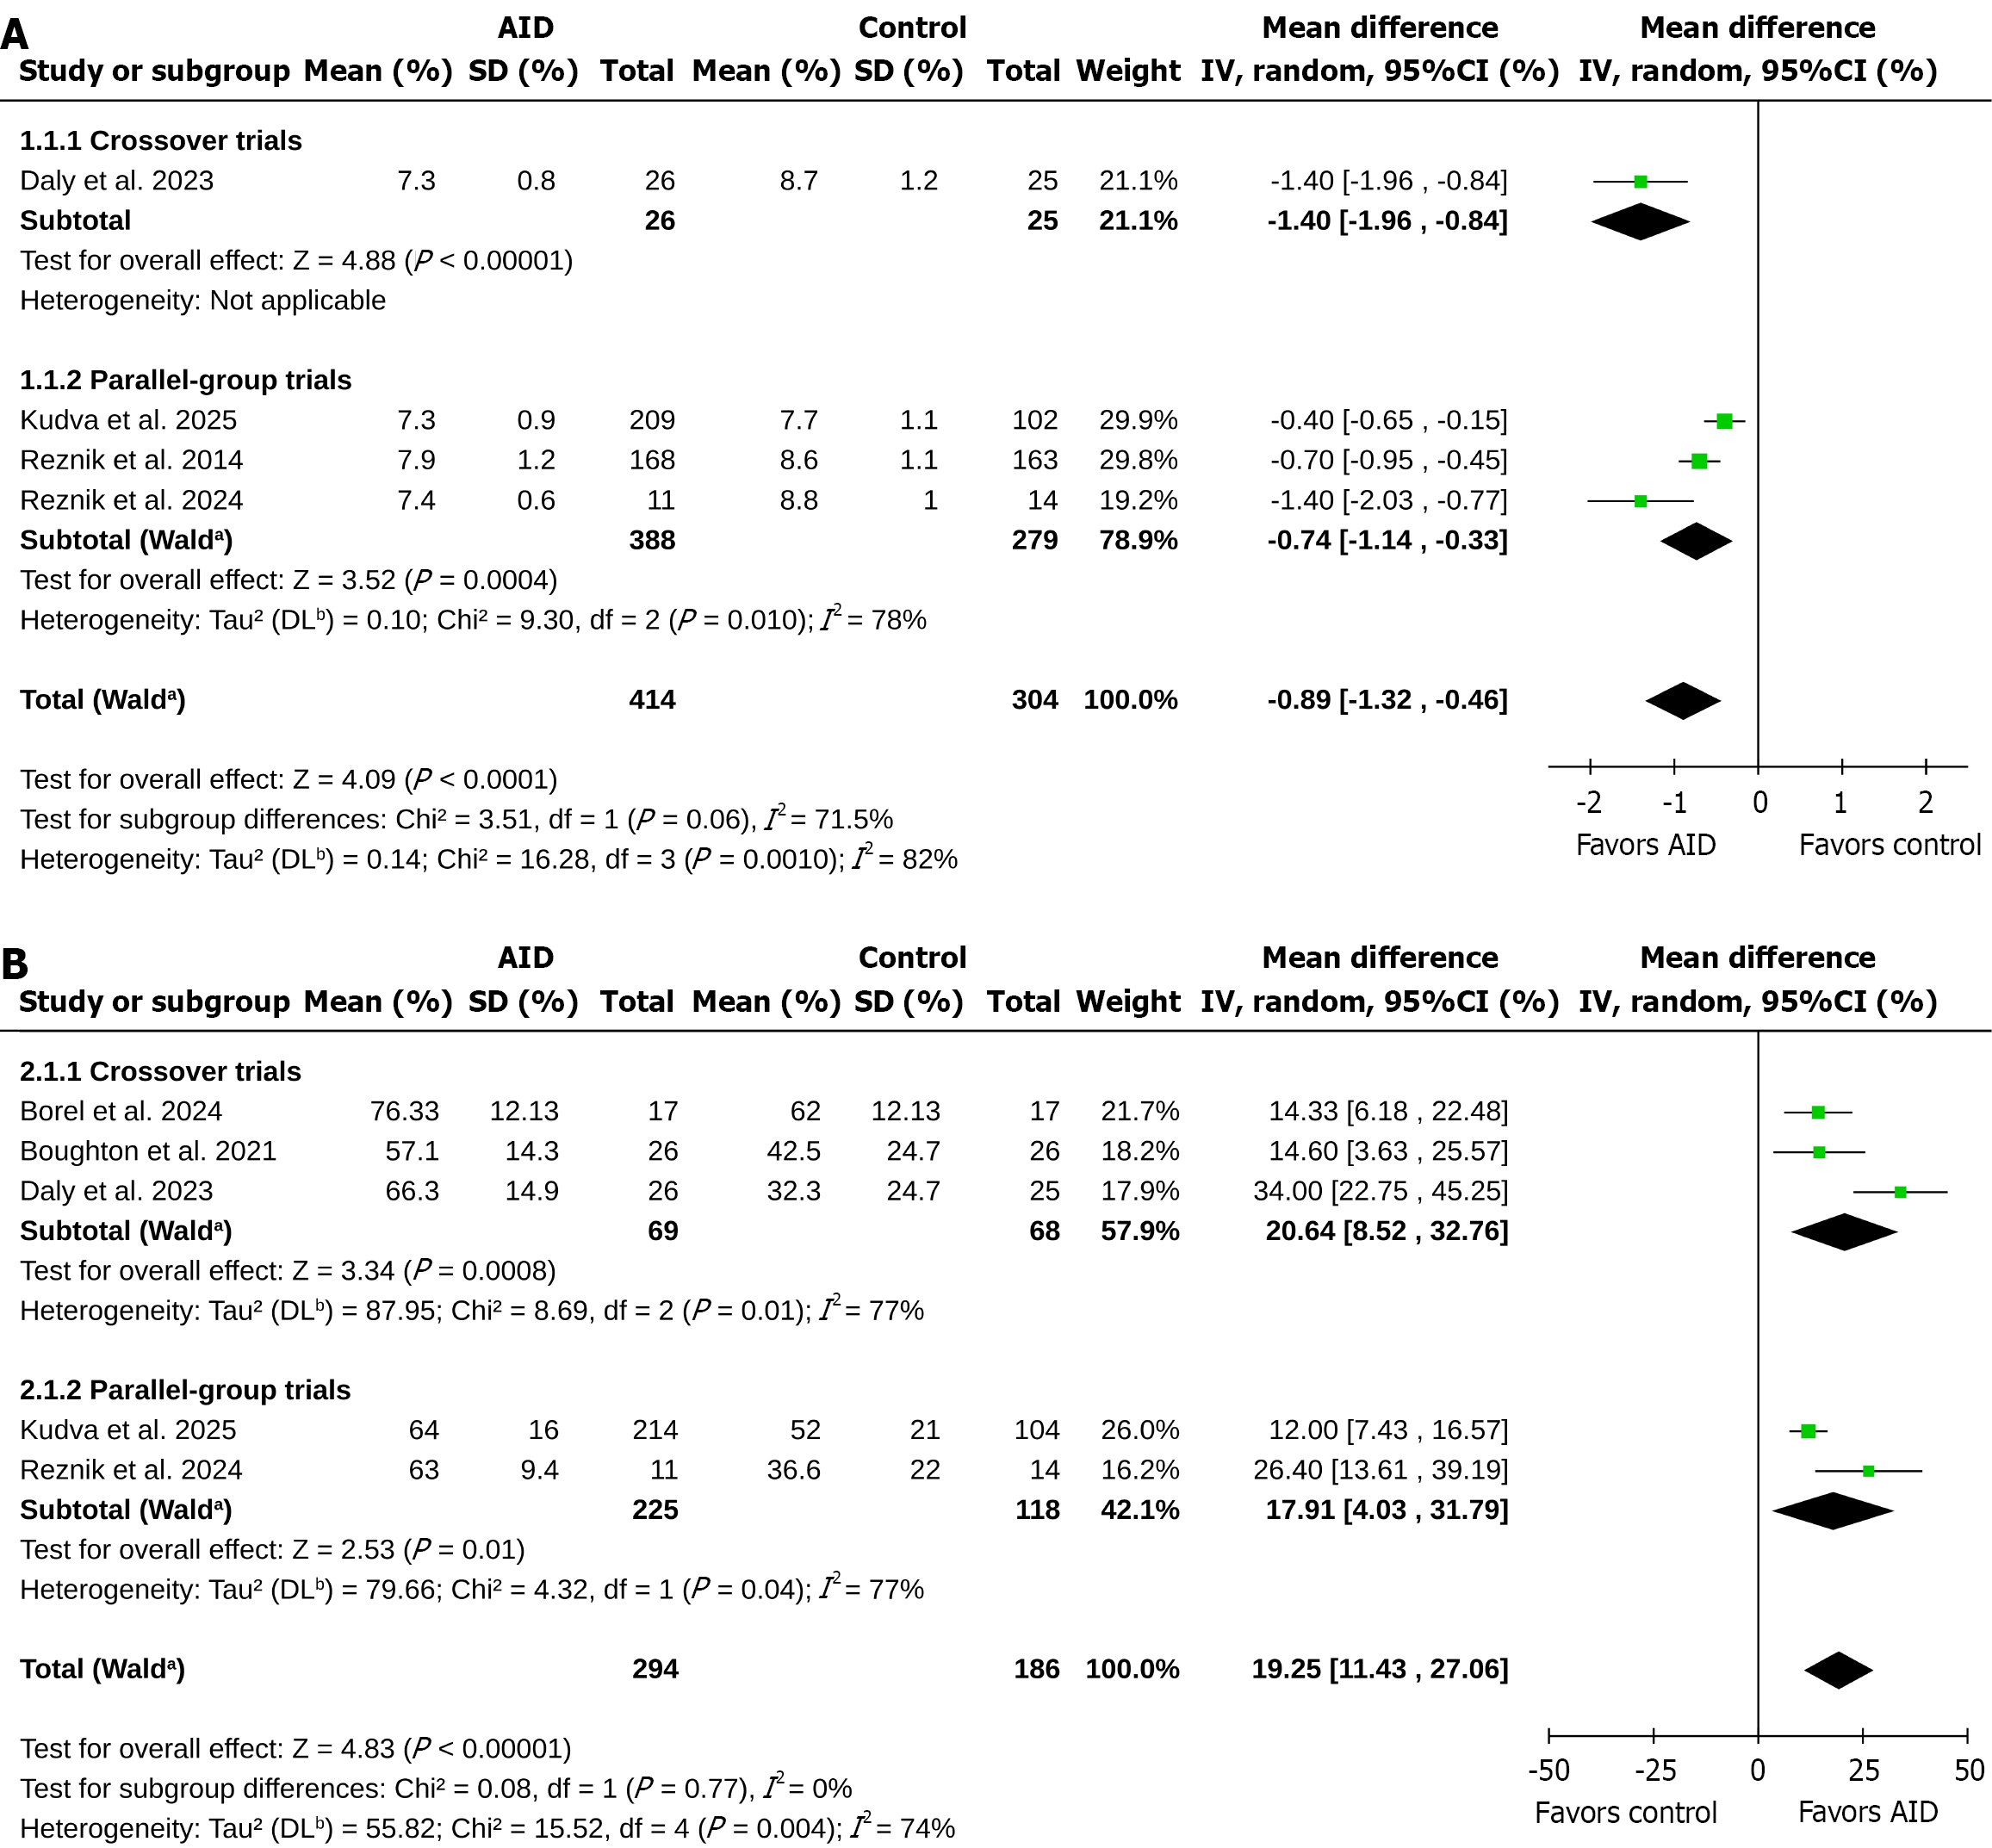
Figure 2 Forest plot highlighting the mean difference in glycated hemoglobin levels and time in range at the end of the study in the auto
- Citation: Kamrul-Hasan ABM, Pappachan JM, Nagendra L, Akter N, Jena S, Dutta D, Nair S. Role of automated insulin delivery in managing insulin-treated outpatients with type 2 diabetes: A systematic review and meta-analysis. World J Diabetes 2025; 16(10): 111230
- URL: https://www.wjgnet.com/1948-9358/full/v16/i10/111230.htm
- DOI: https://dx.doi.org/10.4239/wjd.v16.i10.111230


