©The Author(s) 2025.
World J Diabetes. Oct 15, 2025; 16(10): 110097
Published online Oct 15, 2025. doi: 10.4239/wjd.v16.i10.110097
Published online Oct 15, 2025. doi: 10.4239/wjd.v16.i10.110097
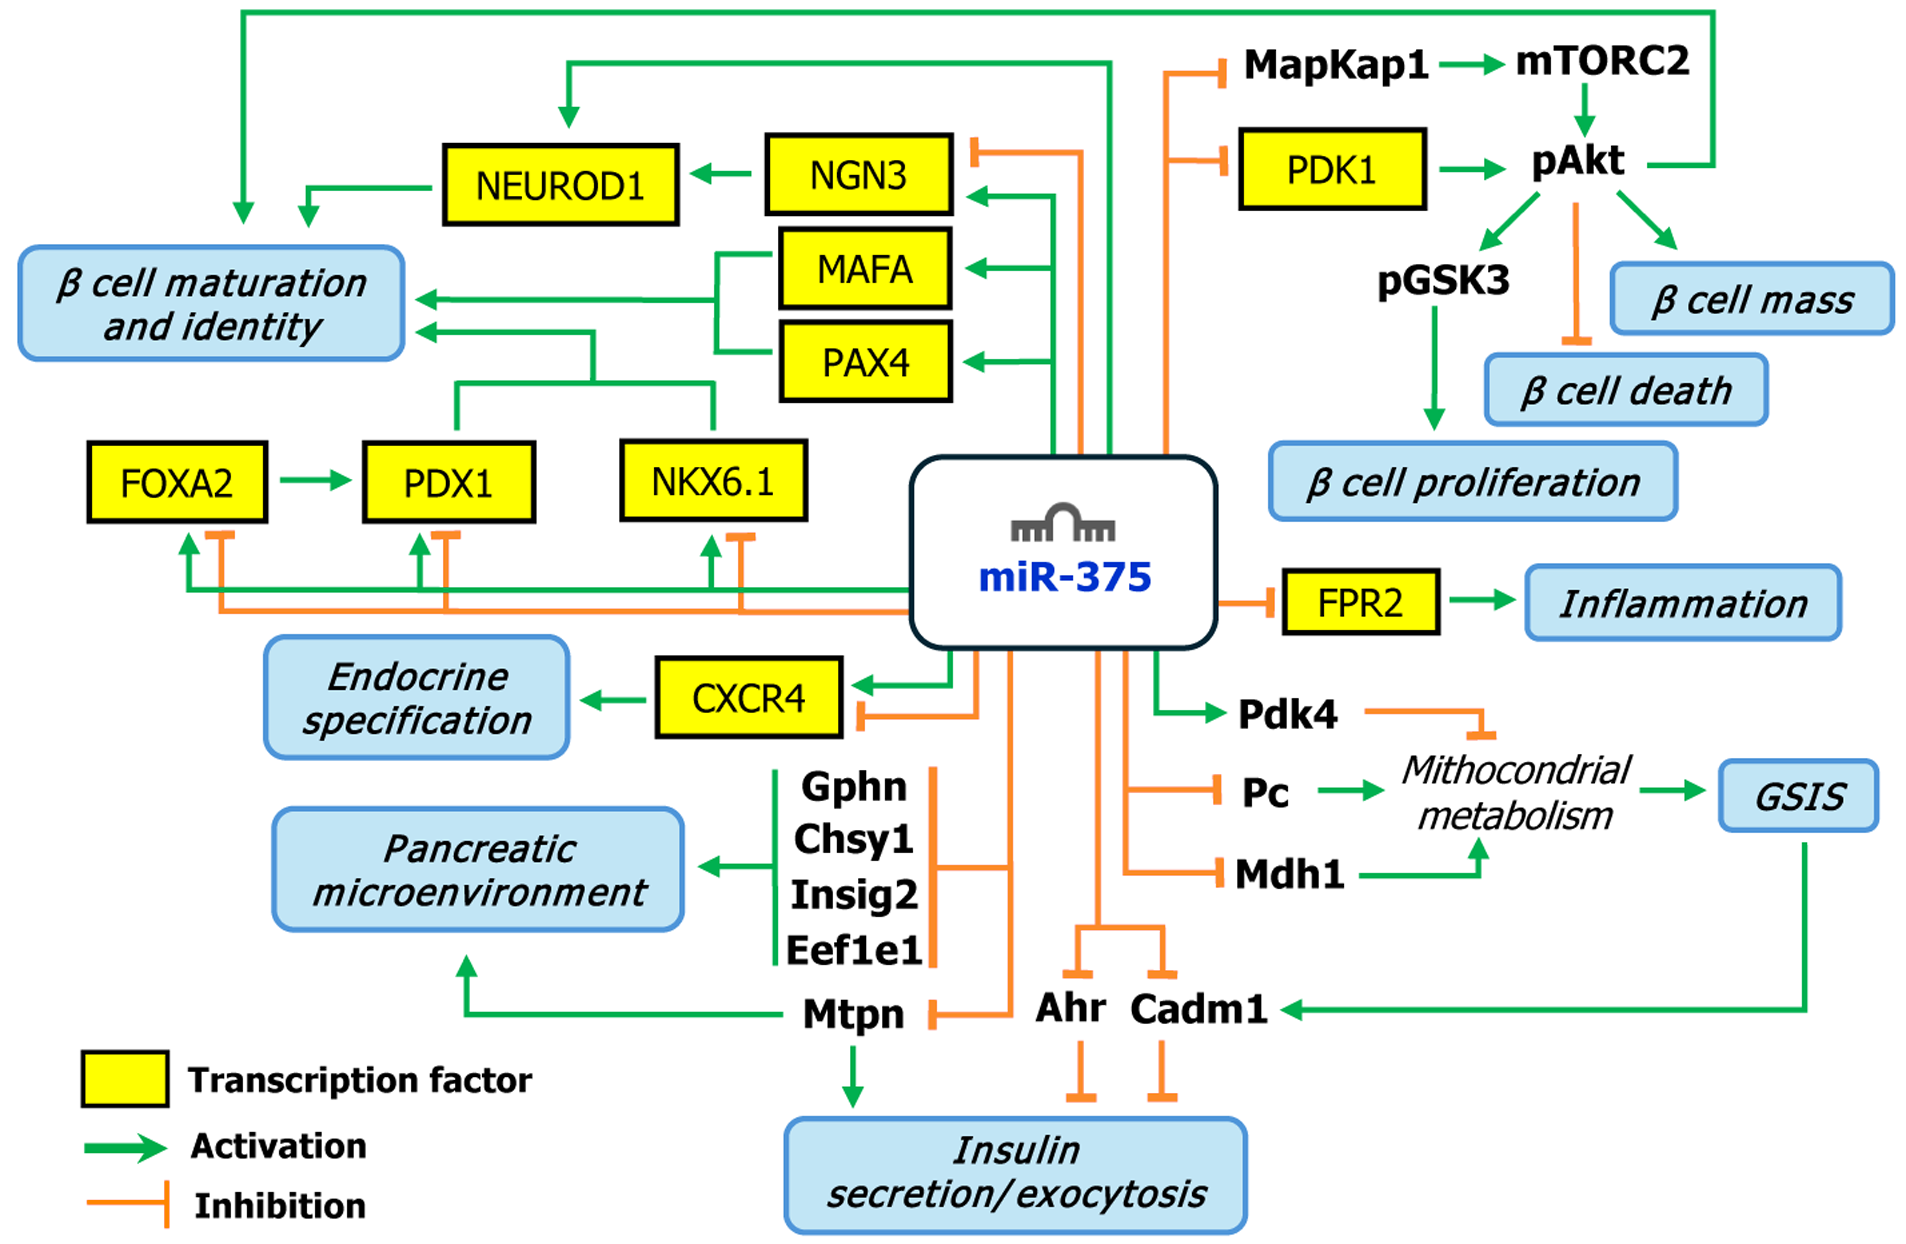
Figure 1 Schematic representation of the molecular pathways regulated by microRNA 375 in pancreatic β cells.
Green arrows indicate positive regulation (activation), while orange lines ending with a T bar represent negative regulation (inhibition). NEURPD1: Neurogenic differentiation 1; NGN3: Neurogenin 3; MAFA: V-maf avian musculoaponeurotic fibrosarcoma oncogene homolog A; PAX4: Paired box 4; FOXA2: Forkhead box A2; PDX1: Pancreatic and duodenal homeobox-1; NKX6.1: NK6 homeobox 1; CXCR4: C-X-C chemokine receptor type 4; Gphn: Gephyrin; Chsy1: Chondroitin sulfate synthase 1; Insig2: Insulin induced gene 2; Eef1e1: Eukaryotic translation elongation factor 1 epsilon 1; Mtpn: Myotrophin; miR-375: MicroRNA 375; MAPKAP1: Mitogen-activated protein kinase associated protein 1; mTORC2: Mammalian target of rapamycin complex 2; PDK1: 3-phosphoinositide-dependent protein kinase 1; pAkt: Phosphorylated protein kinase B; pGSK3: Phosphorylated glycogen synthase kinase 3; FPR2: Formyl peptide receptor 2; Pdk4: Pyruvate dehydrogenase kinase 4; Pc: Pyruvate carboxylase; Mdh1: Malate dehydrogenase 1; GSIS: Glucose - stimulated insulin secretion; Ahr: Aryl hydrocarbon receptor; Cadm1: Cell adhesion molecule 1.
- Citation: Pierantoni M, Dell’Aira M, Grassilli S, Brugnoli F, Bertagnolo V. MicroRNA 375 and diabetes: A key regulator of β cell function and a promising non-invasive biomarker. World J Diabetes 2025; 16(10): 110097
- URL: https://www.wjgnet.com/1948-9358/full/v16/i10/110097.htm
- DOI: https://dx.doi.org/10.4239/wjd.v16.i10.110097


